


Theme: I say, trouble right here in River City
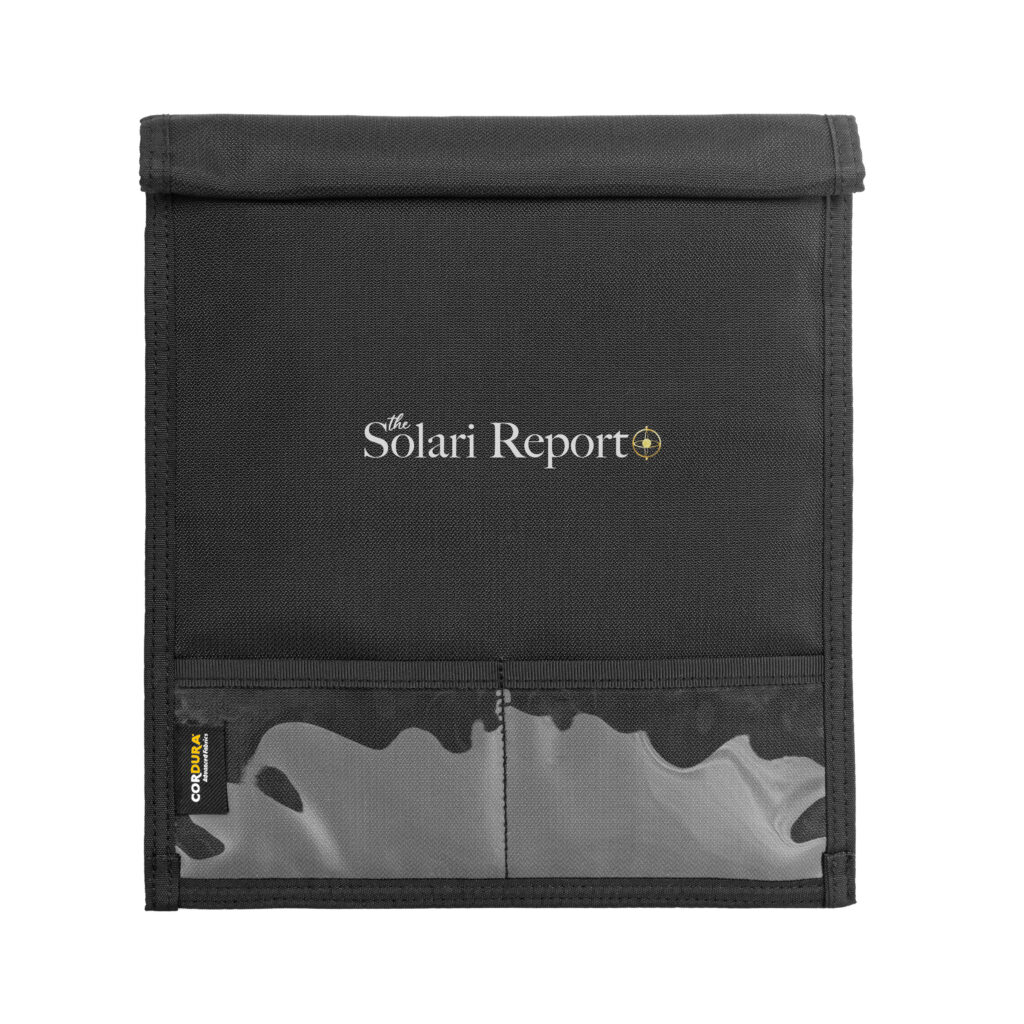
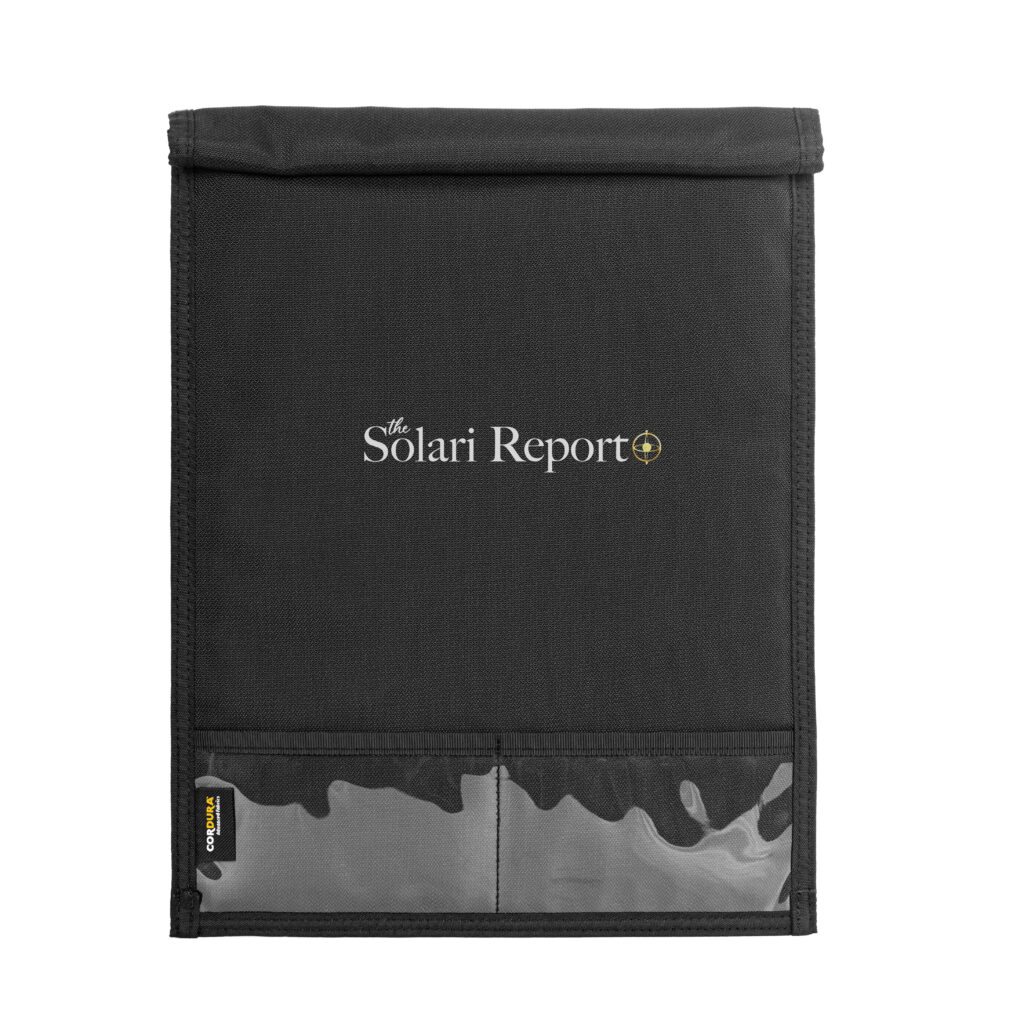
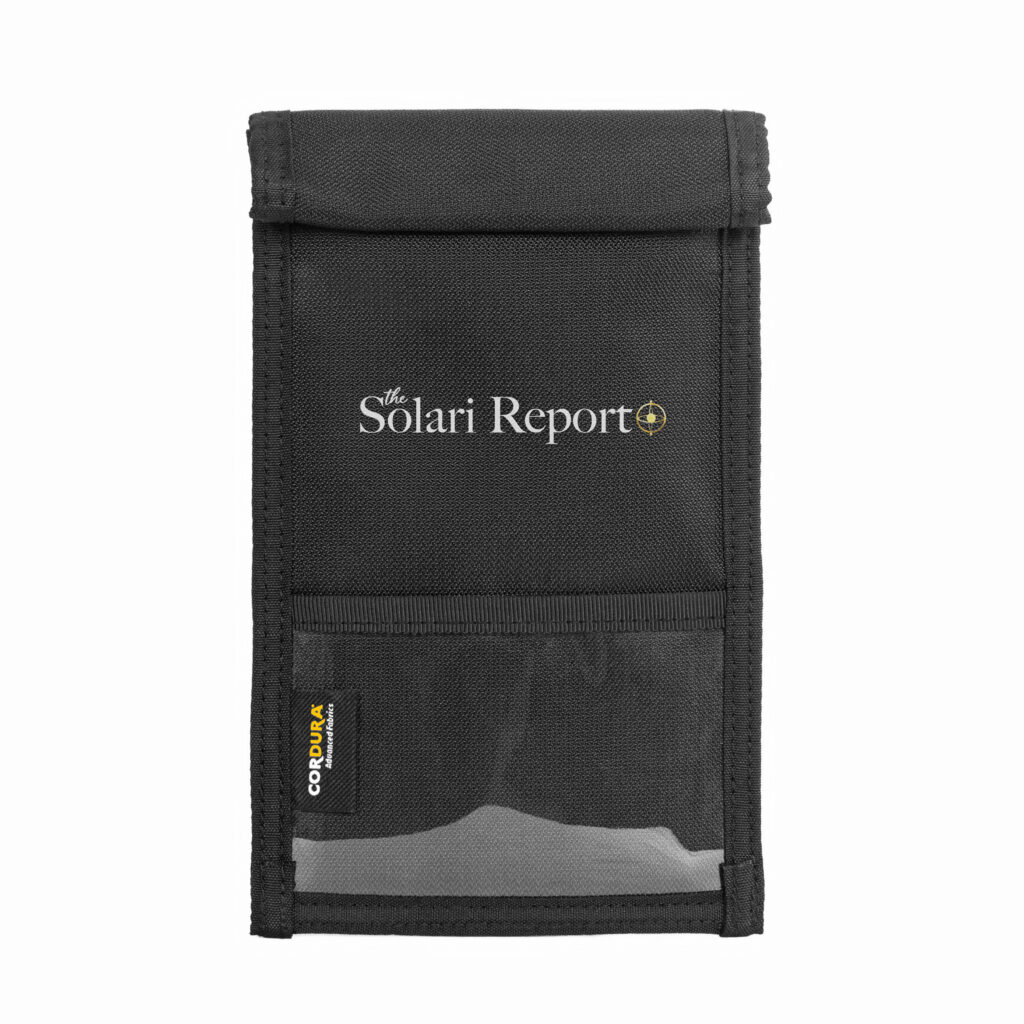
Interview: Solutions Series: Equip Yourself with Grid-Down Comms
Take Action
Please login to see stories, charts, and subscriber-only content.Not a subscriber yet? You are invited to join here!


No posts
Comments are closed.
Our mission is to help you live a free and inspired life. This includes building wealth in ways that build real wealth in the wider economy. We believe that personal and family wealth is a critical ingredient of both individual freedom and community, health and well-being.
Nothing on The Solari Report should be taken as individual investment, legal, or medical advice. Anyone seeking investment, legal, medical, or other professional advice for his or her personal situation is advised to seek out a qualified advisor or advisors and provide as much information as possible to the advisor in order that such advisor can take into account all relevant circumstances, objectives, and risks before rendering an opinion as to the appropriate strategy.
Be the first to know about new articles, series and events.

Your cart is currently empty!
Notifications
Catherine,
I keep hearing about agenda 21 ( which they did not meet their deadline of 2021 on many things) and now agenda 2030. You will hear some of the globalists making amazing claims that by 2030 we will own nothing and be happy. Well 2030 is right around the corner and we aren’t even close to owning nothing but very much own whatever we want. Do you feel they throw out dates like this knowing they won’t meet the deadline to just get us used to this sort of talk or do they think they can really meet these deadlines? Just interest in your thoughts on this.
So I could be wrong (any better informed subscribers please advise), but I was always under the impression that Agenda 21 referred to the 21st century, rather than the year 2021. Agenda 2030 being a component of Agenda 21.
Agreed that years with round numbers appear to be simply “thrown out there”. I also think that if goals aren’t met by an arbitrary year, it doesn’t worry the Globalists too much. They are very, very, patient, and operate across multigenerational time-frames.
yes to all of the above
https://en.wikipedia.org/wiki/Agenda_21
Howdy
As I watch the activities of the Central Banks I flash back to the Ed Sullivan Show (God I am old) Mr. Sullivan had a juggler that balanced plates on thin poles anchored into a long table by keeping the plates spinning so they would not fall and break. I guess the entertainers kept about 12 to 15 spinning plates going at the same time.
This week is Day of Atonement otherwise known as Yom Kippur. The feast holiday is observed with prayer, repentance, and fasting. Prayer is good, prayer with repentance is better and prayer with repentance and cleansing is best. Combine those activities with Wim Hof’s exercises of breathing and cold showers can be a giant step in creating a better world.
Who shorted the German market before the pipeline explosion?
October has a history of major market corrections; will we have another one this month? All it would take is one of those spinning plates crashing onto the floor. Would that be a black swan? When I cast my eyes upward I see a bevy of black swans circling looking for a landing spot.
What interesting times we are living. I feel blessed to be at the crossroads of mankind’s destiny, freedom or slavery.
All this time I had thought I remembered the spinning plates from Captain Kangaroo. Thanks for setting me straight!
Greeting Carolyn
Look what I found, the spinning plate guy on Ed Sullivan. Can’t you imagine Jerome Powell doing this act to keep the plates spinning? Or is he going to let the plates crash at the designate time?
https://www.youtube.com/watch?v=Cb6NS_F5xTE
I am currently in Portugal. One of the guests at the hotel struck up a conversation with me, a young Canadian who had been pickpocketed and had thus been relieved of his smartphone, credit card and cash. He wanted to contact his family and friends to ask them to send him money. Of course I said he could use my phone or laptop to call them or send them e-mails but he did not know any of their phone numbers or e-mail addresses. He said that they were all saved on his smartphone which is now gone. He couldn’t recall his bank account number either.
I wonder how many other people have transferred their memory to their phones.
When I was a little boy as young as 5 I had to know by heart my address and phone number as well as those of close family members.
I then noticed that there are no longer any public telephones around. There used to be public phones on almost every street, in shops, in restaurants, at the post office, at the airport and at the train station. They’re all gone. Not one public phone in sight. They all seem to have disappeared. When and how did that happen without me even realising it?
Good reminder to have a backup email account when traveling, which can be easily accessed from an internet cafe, and has a limited amount of information to assist recovery. Also to carry some information on paper.
Even Jeffrey Sachs says, “I would bet it (the Pipeline attacks) was the US”, and the moderators try to shut him off.
https://www.bitchute.com/video/acUS04DJrXO7/
If there is a list of people on the planet who are not worth your time, it would include Jeffery Sachs.
Not that I knew him before this week, and if Jeffery Sachs had said what his Stuart Smalley presentation suggests, I would simply ignore him, but I guess this is exactly how “limited hangouts” are conducted: let someone who is discreditable do it, and you sow confusion.
Anyone taking bets on when the first LNG ship is sabotaged?
Humans have a few centuries of experience in attacking and defending ships, as Venetians and pirates know well. Space systems, underwater vehicles and electronic warfare all have modern roles to play.
Greek shipping may be affected, https://www.moonofalabama.org/2022/10/crazy-sanctions.html
“This is of course an open invitation to other countries to enter the oil shipping and related financial services businesses at the cost of European companies. China and India will both [enter] it to increase their market shares in those fields. Their ships will transport Russian oil to whoever wants to buy it for the market price minus the always negotiable Russian rebate. Greek ships will sit idle or will be sold off while Indian and Chinese and other Asian tankers will be very, very busy. China’s big insurance companies will happily join that new global services business.”
Interesting that the CDS spread for CS (Credit Suisse) is the same now as it was in 2008. Provides possible clarity for the Pope’s financial mandates of late. The next Lehman Brothers?
So silly of me! I would never have posted this if I’d known that J. P. Morgan was going to give CS an upgrade today from underweight to neutral. Nothing to see here!
Catherine, Mathew Crawford (Rounding the Earth, Substack/YouTube) mentioned your Missing Money research on his YouTube RTE Raw: Crushing the European Economy. I am surprised and encouraged to hear so many of the economic (CAF, John Titus) money (George Gammon), math/data journalist (Rich Baris, Mathew Crawford), tech (Steve Kirsch), legal (Robert Barnes) etc people that I follow, coming to the same conclusions on so many things since COVID. It’s reassuring.
https://youtu.be/DiWzTJedOjY