


Rambus Blockbuster Chartology

By Catherine Austin Fitts
My “go to” website for technical analysis of precious metals, the US dollar & the US stock market is Rambus Chartology, where Rambus (that’s his handle – he’s the founding technical analyst) leads a discussion with extensive charts of what the markets are saying.
In January 2016, Rambus launched his quarterly Solari Report with a Blockbuster Chartology. You can find links to the entire series of quarterly and annual Blockbuster Chartologies at the end of this latest piece.
One of the reasons that Rambus is so good at his craft is that he focuses on “staying on the right side of the major trend.” The challenge of doing so at this time is that it is tempting to look for bottoms or to assume that the trend upwards in the US dollar or stock market may be over. However, Rambus consistently brings us back to the discipline of the Chartology. What does price tell us? As he describes so aptly, we are dealing with psychological warfare.
Sitting back once each quarter to get this perspective offers invaluable insight. So, here we go for the 2nd Quarter 2025 Wrap Up Blockbuster Chartology!
Blockbuster Chartology Quarterly Report
By Rambus
~ 2nd Quarter 2025 Wrap Up ~
Can Big Chart Patterns Lead To Even Bigger Chart Patterns?
Tonight, I would like to paint the very big picture for the PM complex, so you can see how the Chartology has evolved to get us to this most bullish phase of the secular bull market. There is an old expression in Chartology that says, “BIG CHART PATTERNS LEAD TO BIG MOVES.” There is another expression that I came up with that says, “BIG CHART PATTERNS CAN LEAD TO EVEN BIGGER PATTERNS AND BIGGER MOVES,” which we will look at tonight for the PM complex.
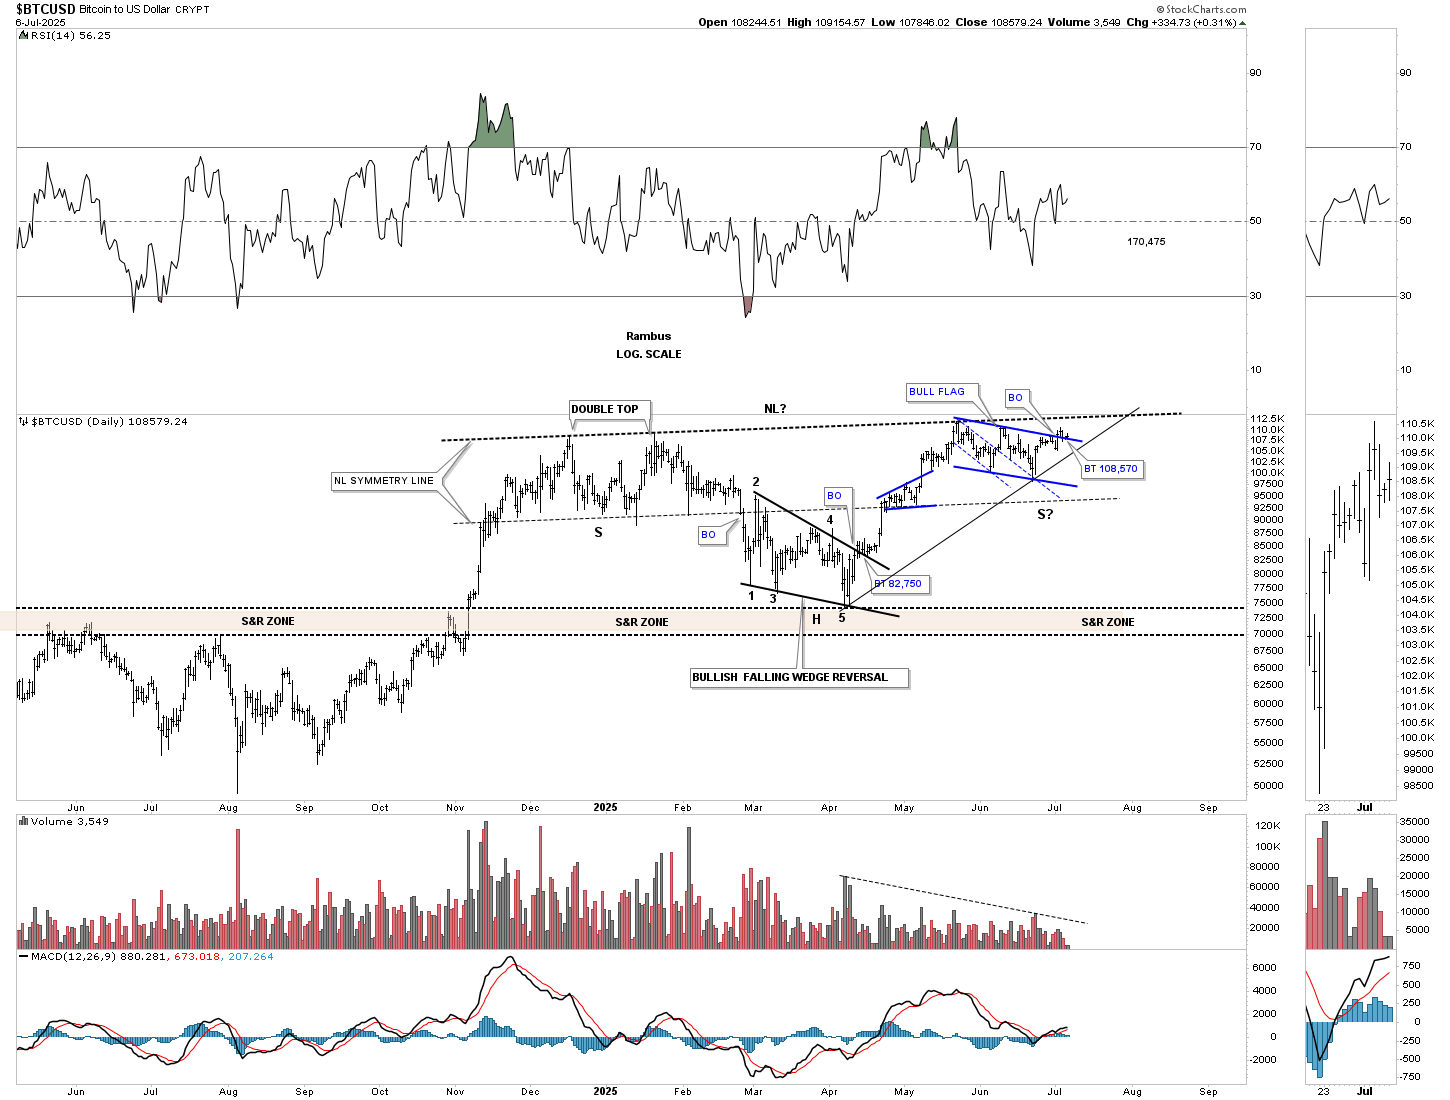
First, let’s look at a few charts we’ve been following very closely and see how they’re progressing. Up first is the daily chart for BTCUSD, which broke out from the blue bull flag right shoulder and then the neckline and is now in backtest mode to the neckline. I saved one position in the Leveraged Trade Portfolio to buy one last position in BITX 2X long BTCUSD on the backtest. If we don’t get a complete backtest, there are other areas in the stock markets I can add the one last trade.
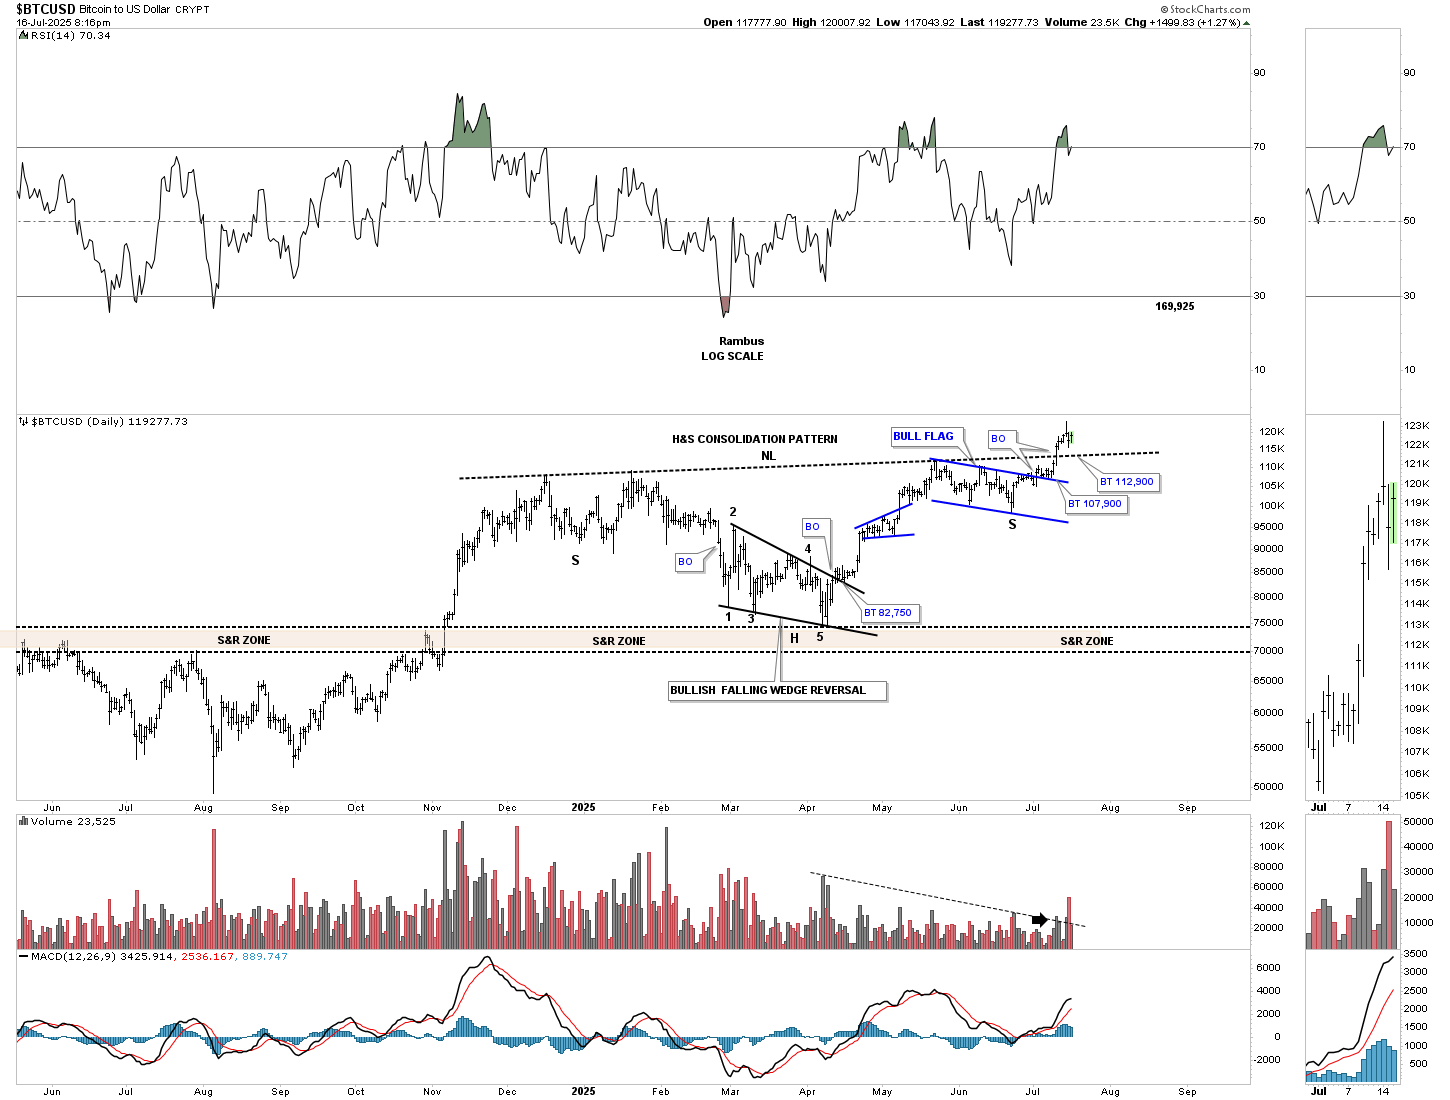
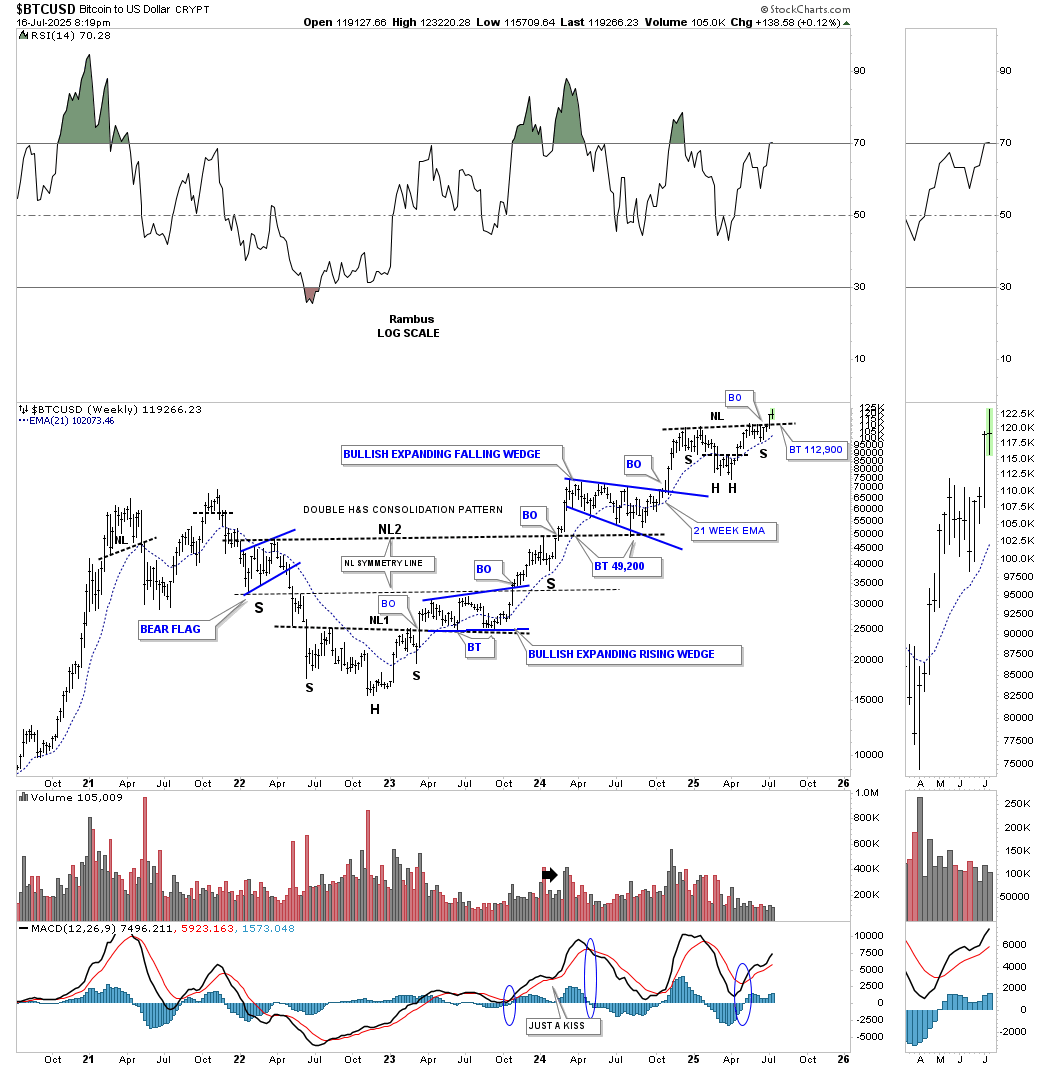
After breaking out from the large 2023 double head and shoulders consolidation pattern, BTCUSD formed the blue bullish expanding falling wedge as the backtest to the neckline, which then led to a new all-time high. During the consolidation phase after a new all-time high was made, BTCUSD formed another H&S consolidation pattern, daily chart above, on top of the blue bullish expanding falling wedge and is now in its second week of the breakout move.
Looking at the price action since the October 2022 low, the head of the double H&S bottom, BTCUSD has formed a classic bull market uptrend with one consolidation pattern forming on top of the previous one.
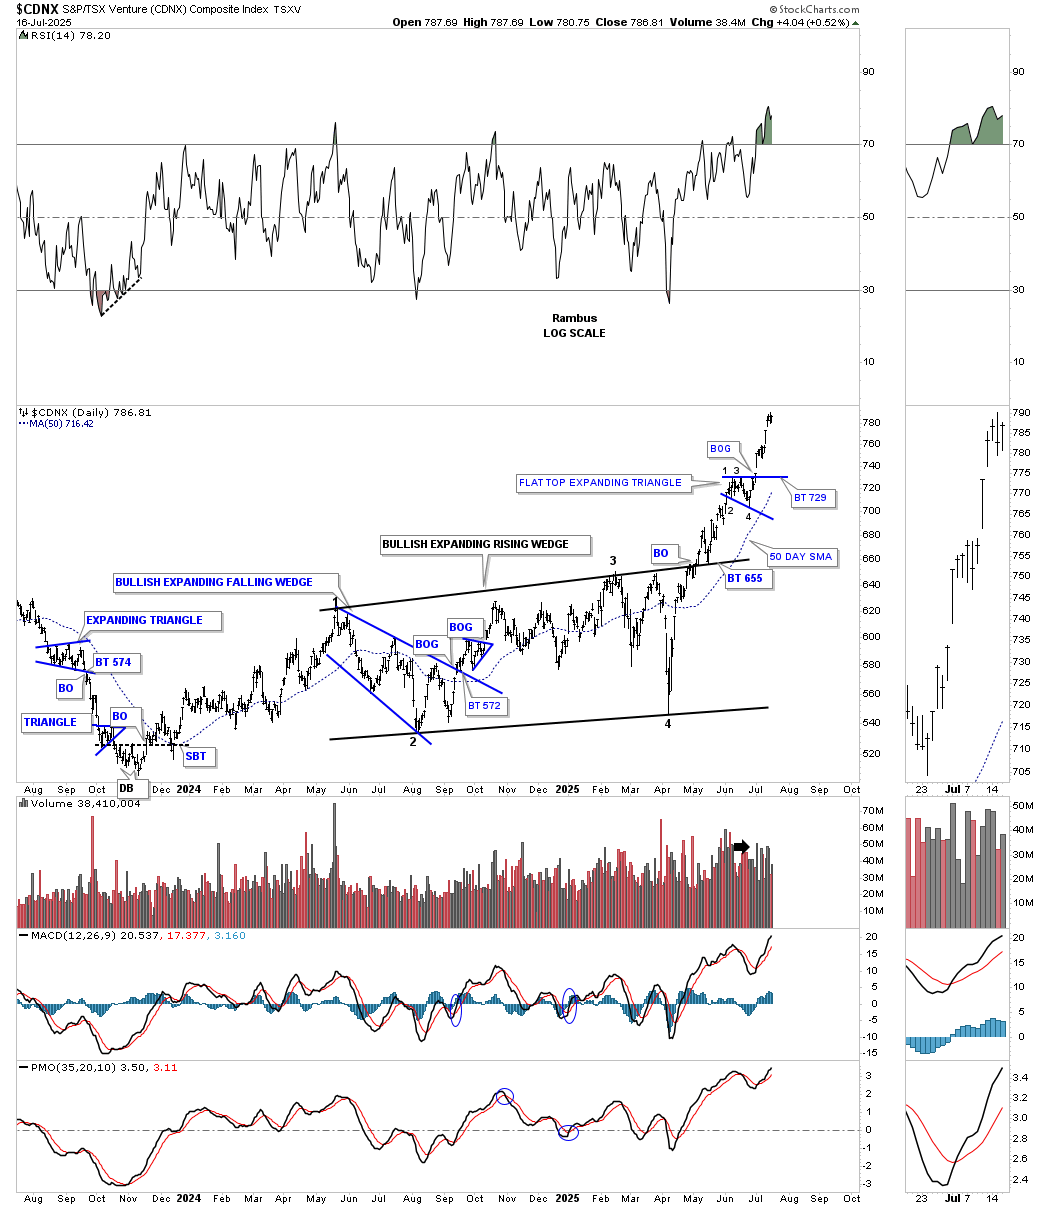
From this short-term daily chart perspective, the CDNX is still impulsing higher after a slight pause to refresh, forming the small blue flat-top expanding triangle.
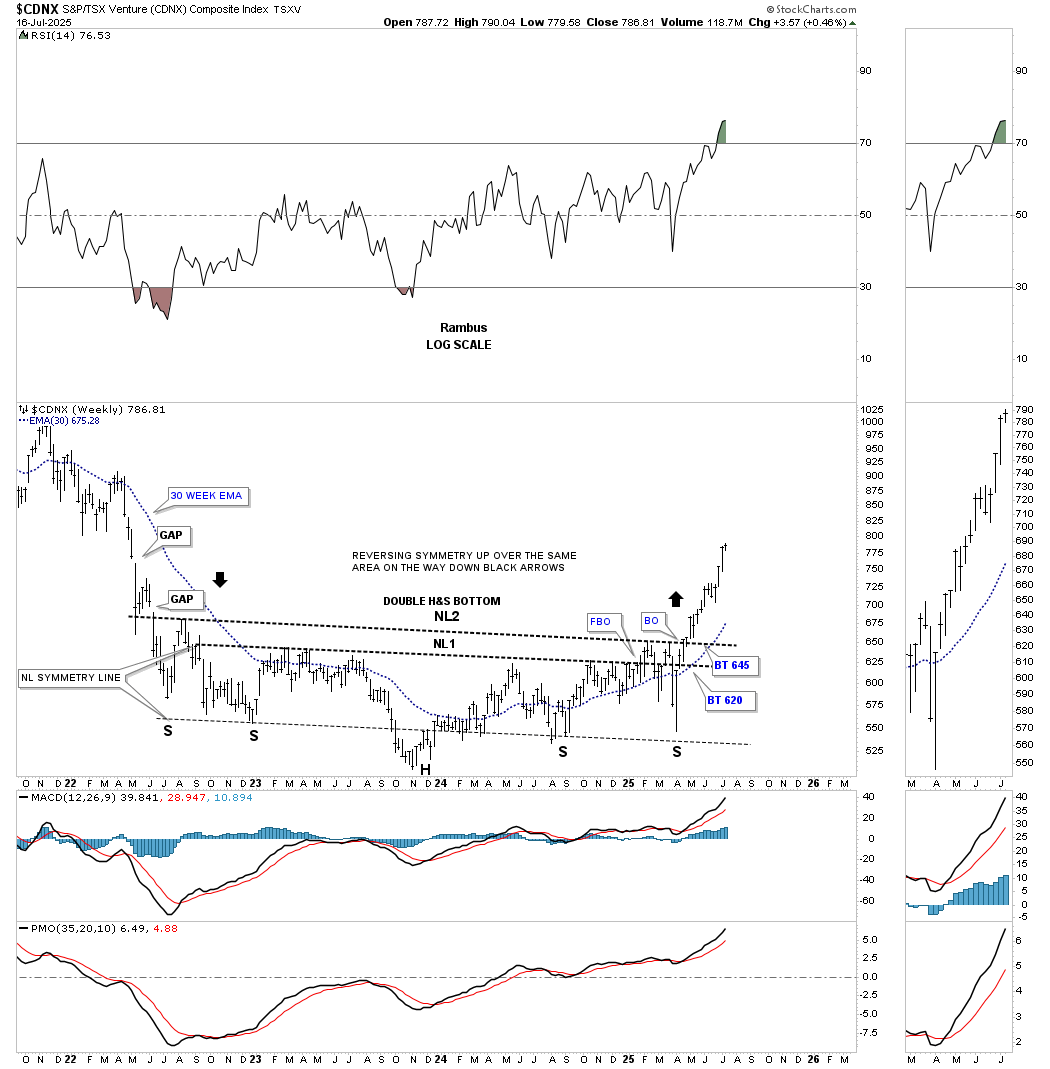
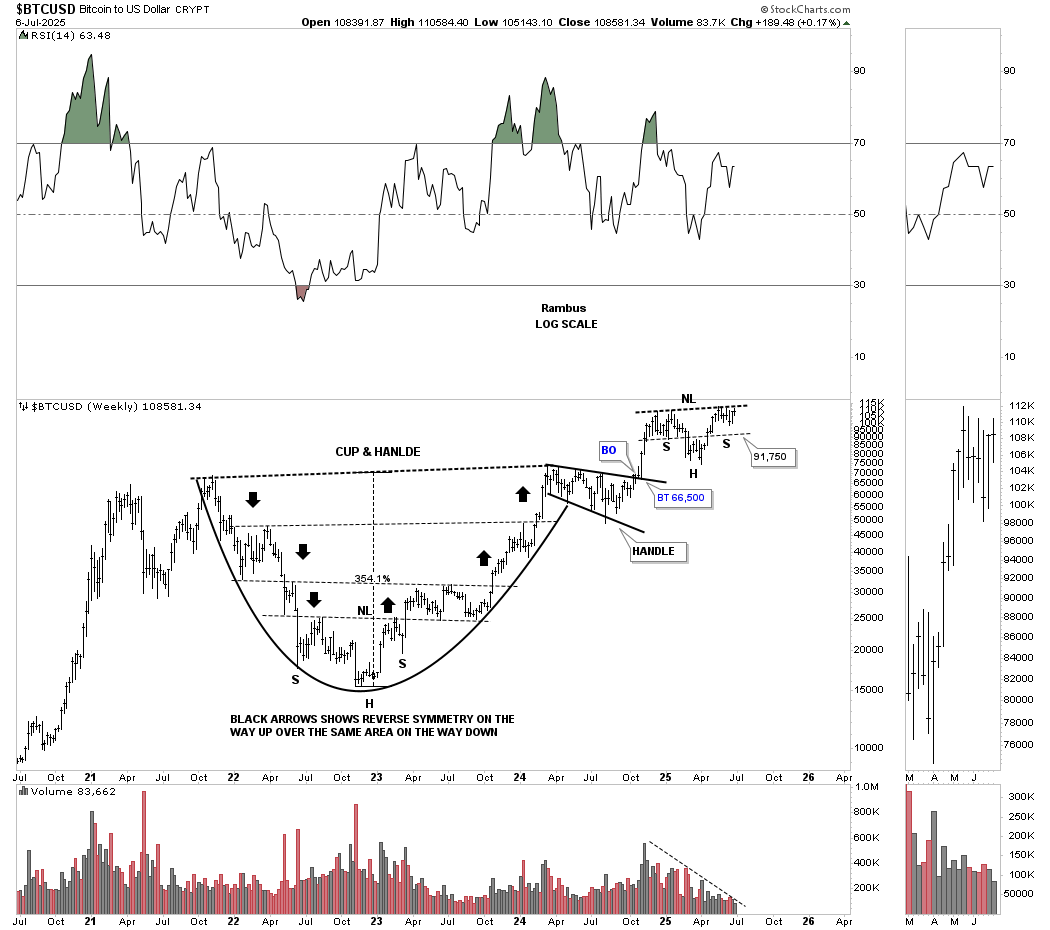
This weekly chart shows the clean version of the double H&S bottom, which is very symmetrical, as shown by the neckline symmetry line, which showed us where to look for a possible low for the right shoulder for both necklines. The reverse symmetry to the upside is still playing out beautifully as shown by the black arrows; how CDNX went down is how it’s going up over the same area.
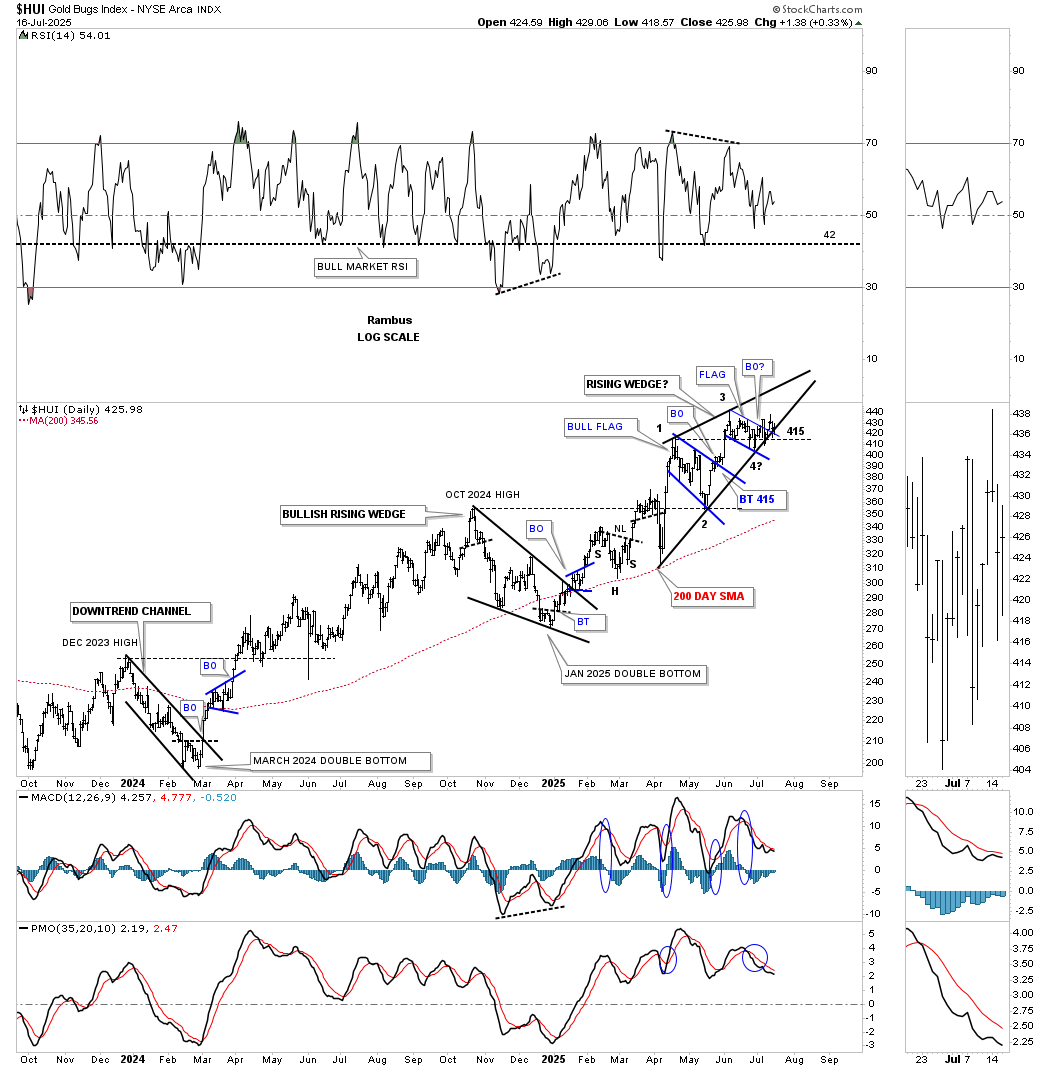
A quick look at the very short-term daily chart for the HUI shows the smaller rising wedge still in play, with a lot of sideways chopping action since the 3rd reversal point with 415 still helping with support.
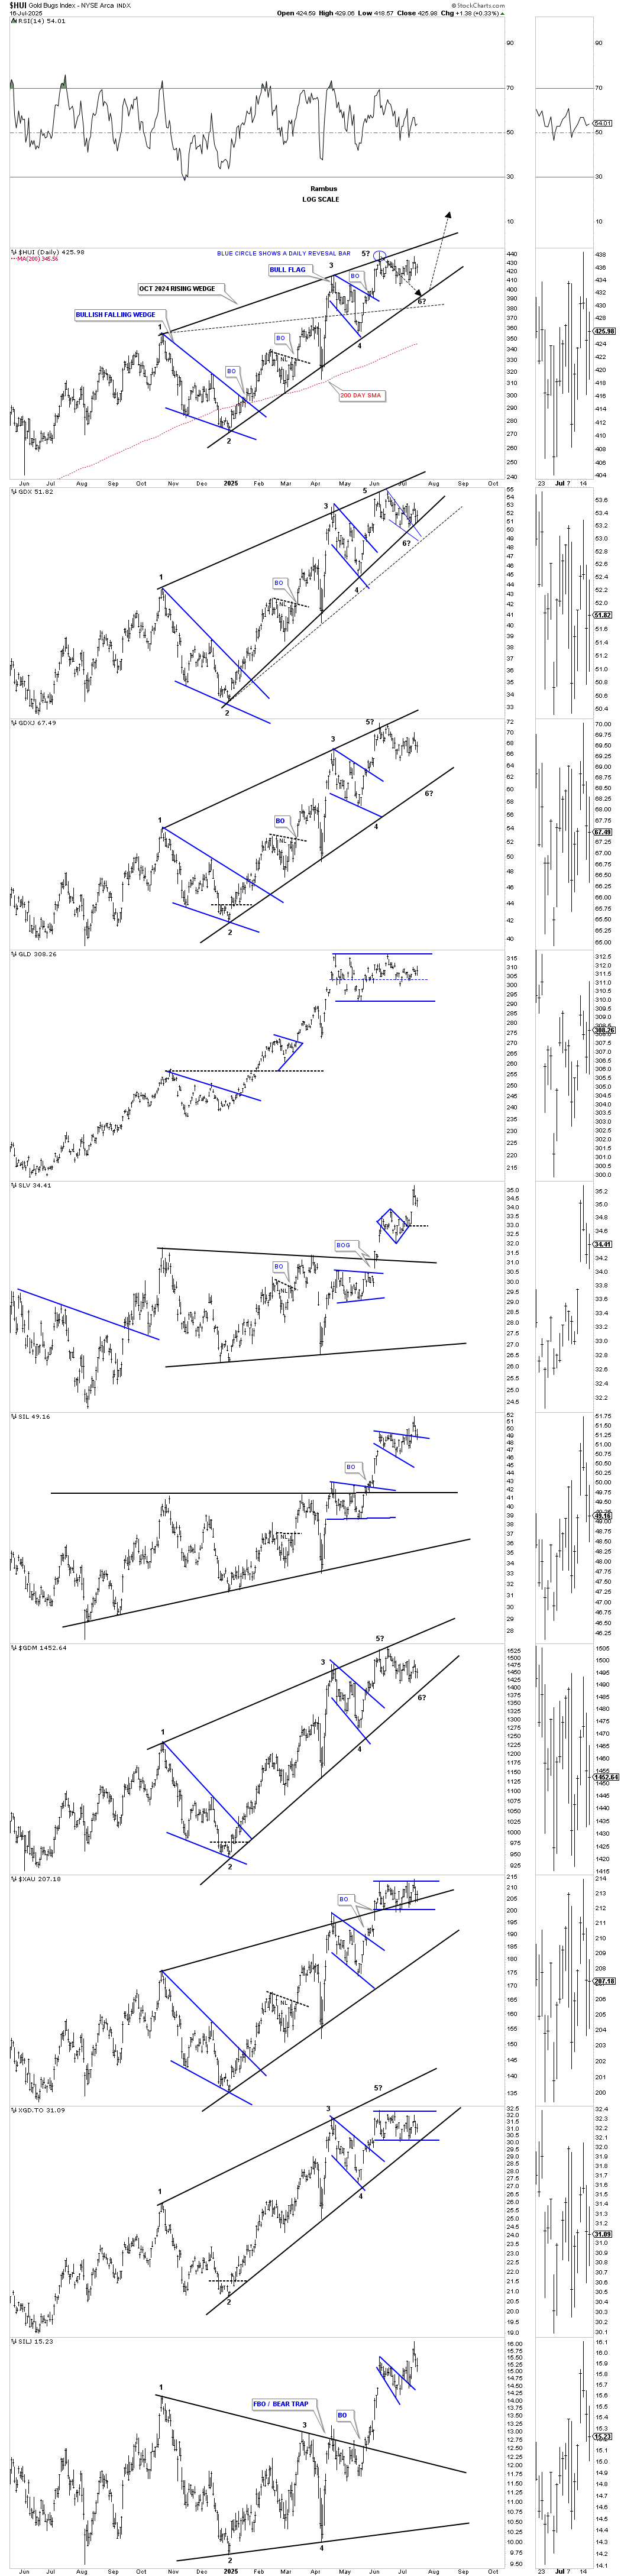
This longer-term daily combo chart shows the much bigger rising wedge that began to form at the October 2024 high and has completed four reversal points in most cases, with a possible 5th and 6th reversal point still a possibility.
GLD is still trading in the center of its current consolidation pattern, while SLV just broke out from its small 6-point diamond consolidation pattern, while the XAU and XGD.TO are forming a possible small rectangle.
Now, I would like to try and paint you a picture of how big consolidation patterns can lead to an even bigger consolidation pattern that will produce a much larger rally. Keep in mind, chart patterns are fractal. If you see a triangle on a daily chart, for instance, that takes maybe 6 months to a year to form, that impulse move will be relative to the size of that triangle. If you then see another triangle on a longer-term weekly chart that may have taken a couple of years or longer to form, then that impulse move will be relative to that triangle, and so on. There is an internal structure of most trading ranges that goes beyond this post, that makes up those trading ranges. There is a lot more to charting than just drawing a couple of lines on a chart and calling it a pattern.
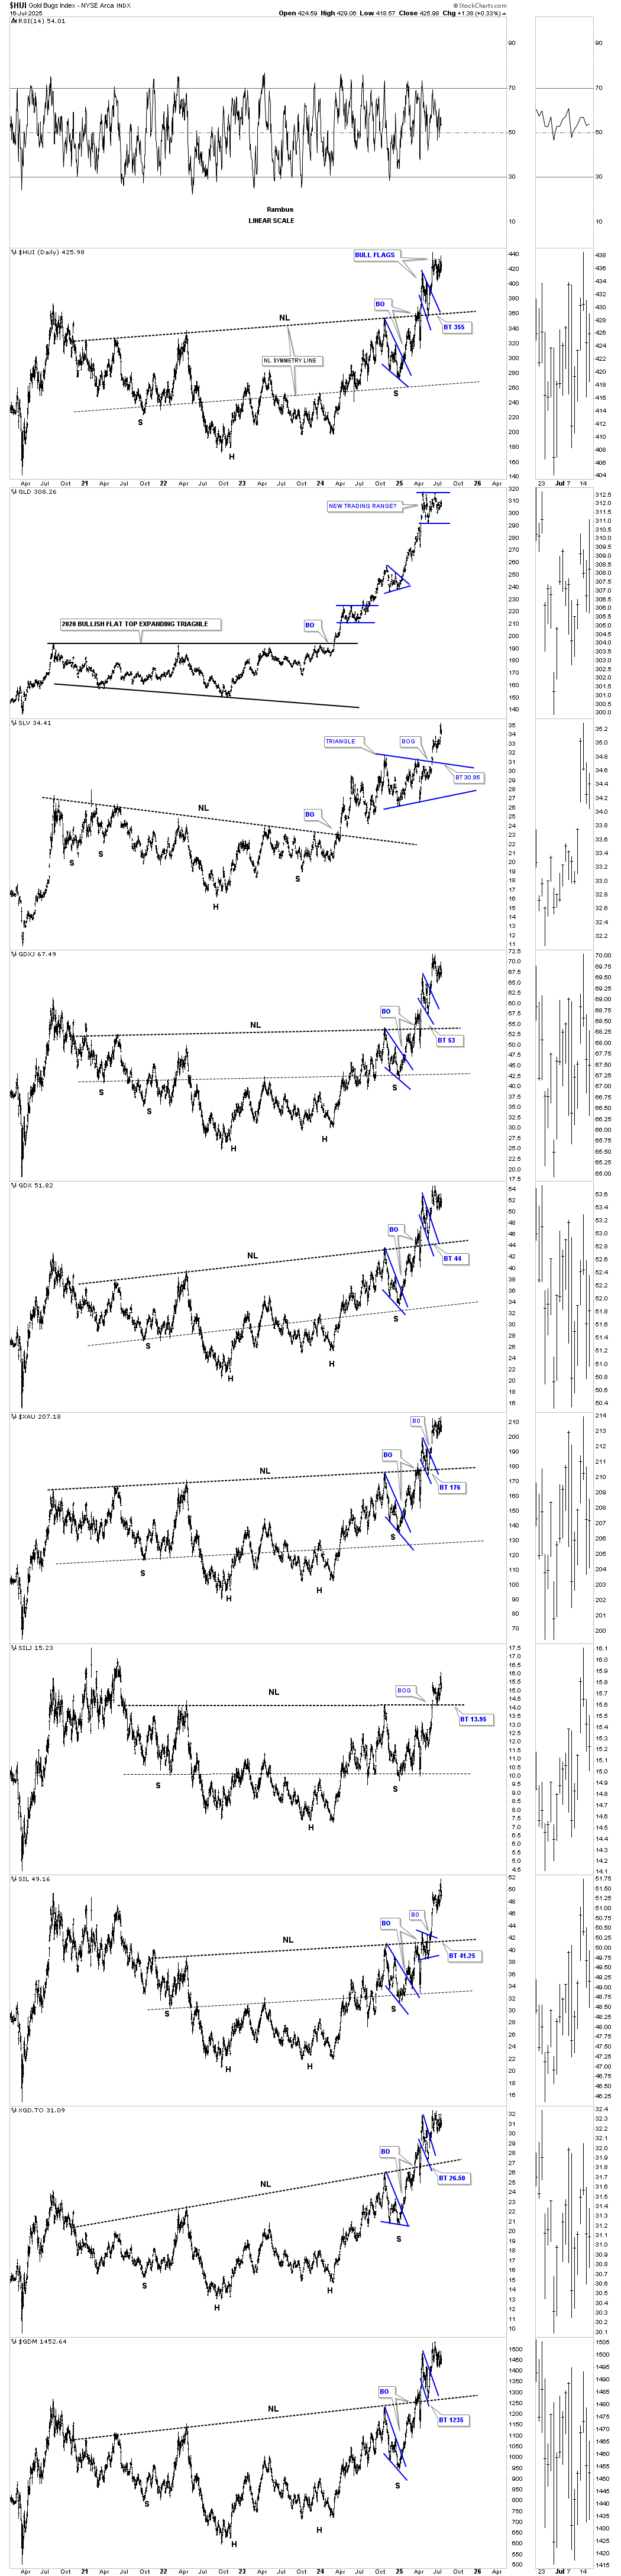
Below is a long-term daily combo chart, which shows the 2023 H&S consolidation pattern in most cases. We finally got the breakout above the neckline earlier this year, with most forming the small blue bull flag as the backtest. Most of these H&S bottoms are pretty symmetrical, as shown by the neckline symmetry line, which gave us an area to look for the right shoulder low. You can also see that many of the H&S are a little unbalanced, with two left shoulders and one right shoulder.
GLD was the only index in the PM complex that didn’t form a H&S consolidation, as it formed the 2020 bullish flat-top expanding triangle, which has led to its current impulse move. Gold is now pausing to refresh, forming another small blue consolidation pattern, gaining energy for the next move higher.
Note that, as GLD has been trading sideways since its April high, the rest of the PM complex has made a slightly higher high, outperforming gold on a short-term basis. It looks like SLV has taken the baton from GLD and is now moving higher on a relative basis, after breaking out from its October 2024 triangle consolidation pattern.
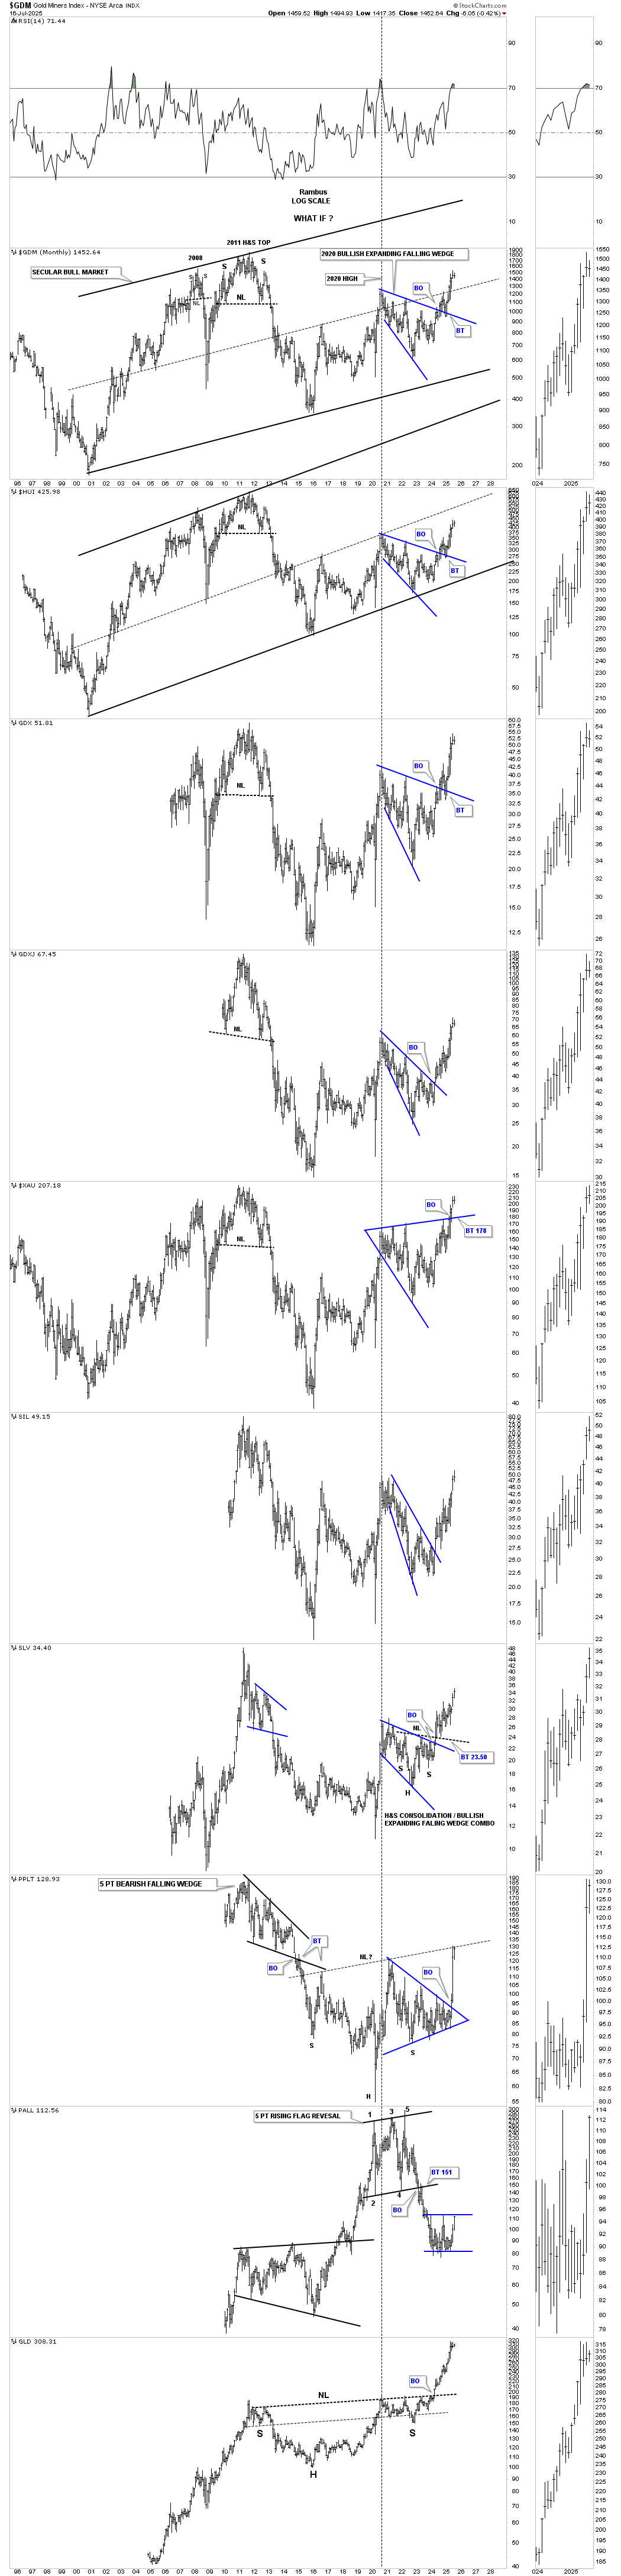
There is another large consolidation pattern that formed after the 2020 high, which is the blue bullish expanding falling wedge, one of the most bullish chart patterns in Chartology. Let’s focus on that large bullish expanding falling wedge on this long-term monthly chart below.
The reason the bullish expanding falling wedge is such a very powerful chart pattern is because of its psychological makeup. During the last reversal point to the downside, the move is generally pretty severe, washing out all the sell stops before the price action reverses quickly, leaving all the sold-out bulls to lick their wounds as the price action reverses on them.
The breakout above the top rail of the 2020 bullish expanding falling wedge came last fall, with the backtest completing in January of this year. Since the completion of the backtest, the price action has been impulsing higher, leaving no doubt about the bullishness of the bullish expanding falling wedge.
Not every 2020 trading range created a bullish expanding falling wedge; the XAU formed a larger expanding triangle as its consolidation pattern. Toward the bottom of this combo chart, PPLT formed a very symmetrical triangle consolidation pattern with a massive breakout move just recently and may be in the process of forming an even larger H&S inverse H&S bottom. Note how the price action hit the potential neckline last month and backed off, telling us the neckline is hot and to be respected. PALL has reached the top of its sideways trading range, gearing up for its breakout move higher.
I would like you to focus on SLV, which has created a very bullish combo consolidation pattern, made up of the 2023 H&S consolidation pattern that we looked at above on the daily combo chart showing the H&S consolidation patterns, and the 2020 blue bullish expanding falling wedge. That precise combo consolidation pattern is the exact same consolidation pattern that gold formed at its 2008 crash low, which then led to the large impulse move to the 2011 all-time high back then before the bear market began.
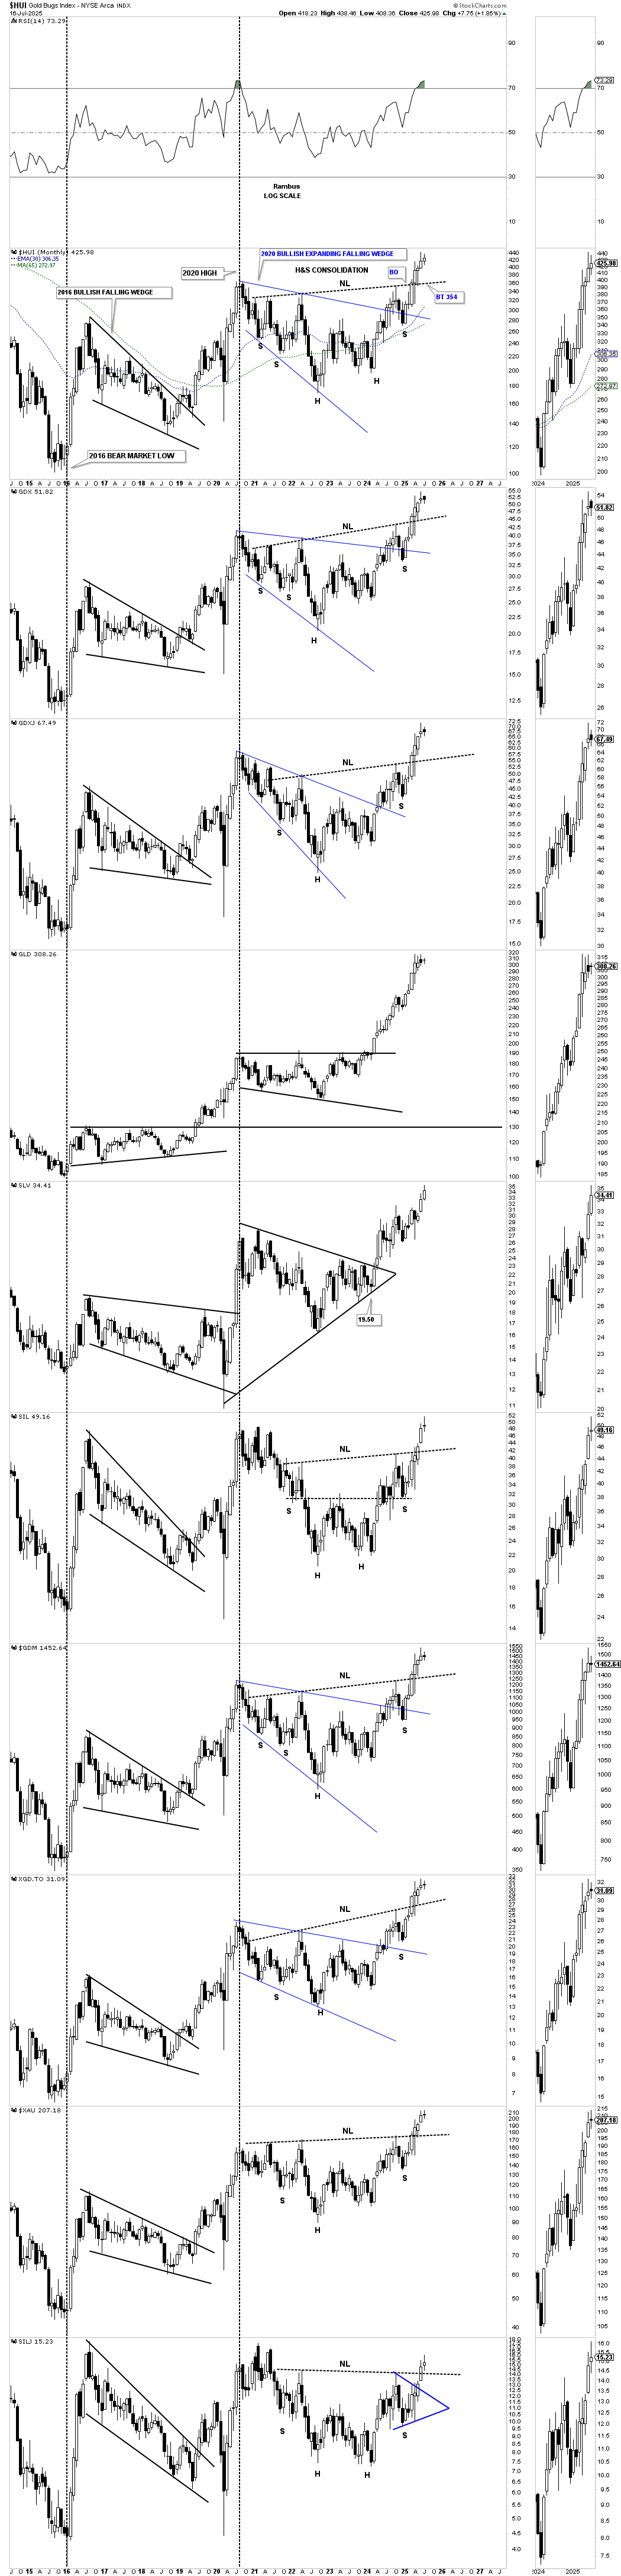
So far, we’ve looked at the nearly four-year H&S consolidation pattern, as shown on the daily combo chart above, and the 2020 blue bullish expanding falling wedge. This next monthly combo chart combines the 2023 H&S consolidation pattern and the 2020 blue bullish expanding falling wedge into one consolidation pattern, which is a very powerful setup.
We can now add another large consolidation pattern to the mix, which is the 2016 bullish falling wedge that was the first consolidation pattern to have formed after the 2016 bear market low. These are the three large consolidation patterns that the PM complex has formed since the bear market low, and when we combine all three, we get an even bigger consolidation pattern, which we’ll look at next.
In the first paragraph of this Wednesday Report, I wrote:
There is an old expression in Chartology that says, “BIG CHART PATTERNS LEAD TO BIG MOVE.” There is another expression that I came up with that says, “BIG CHART PATTERNS CAN LEAD TO EVEN BIGGER PATTERNS AND BIGGER MOVES.”
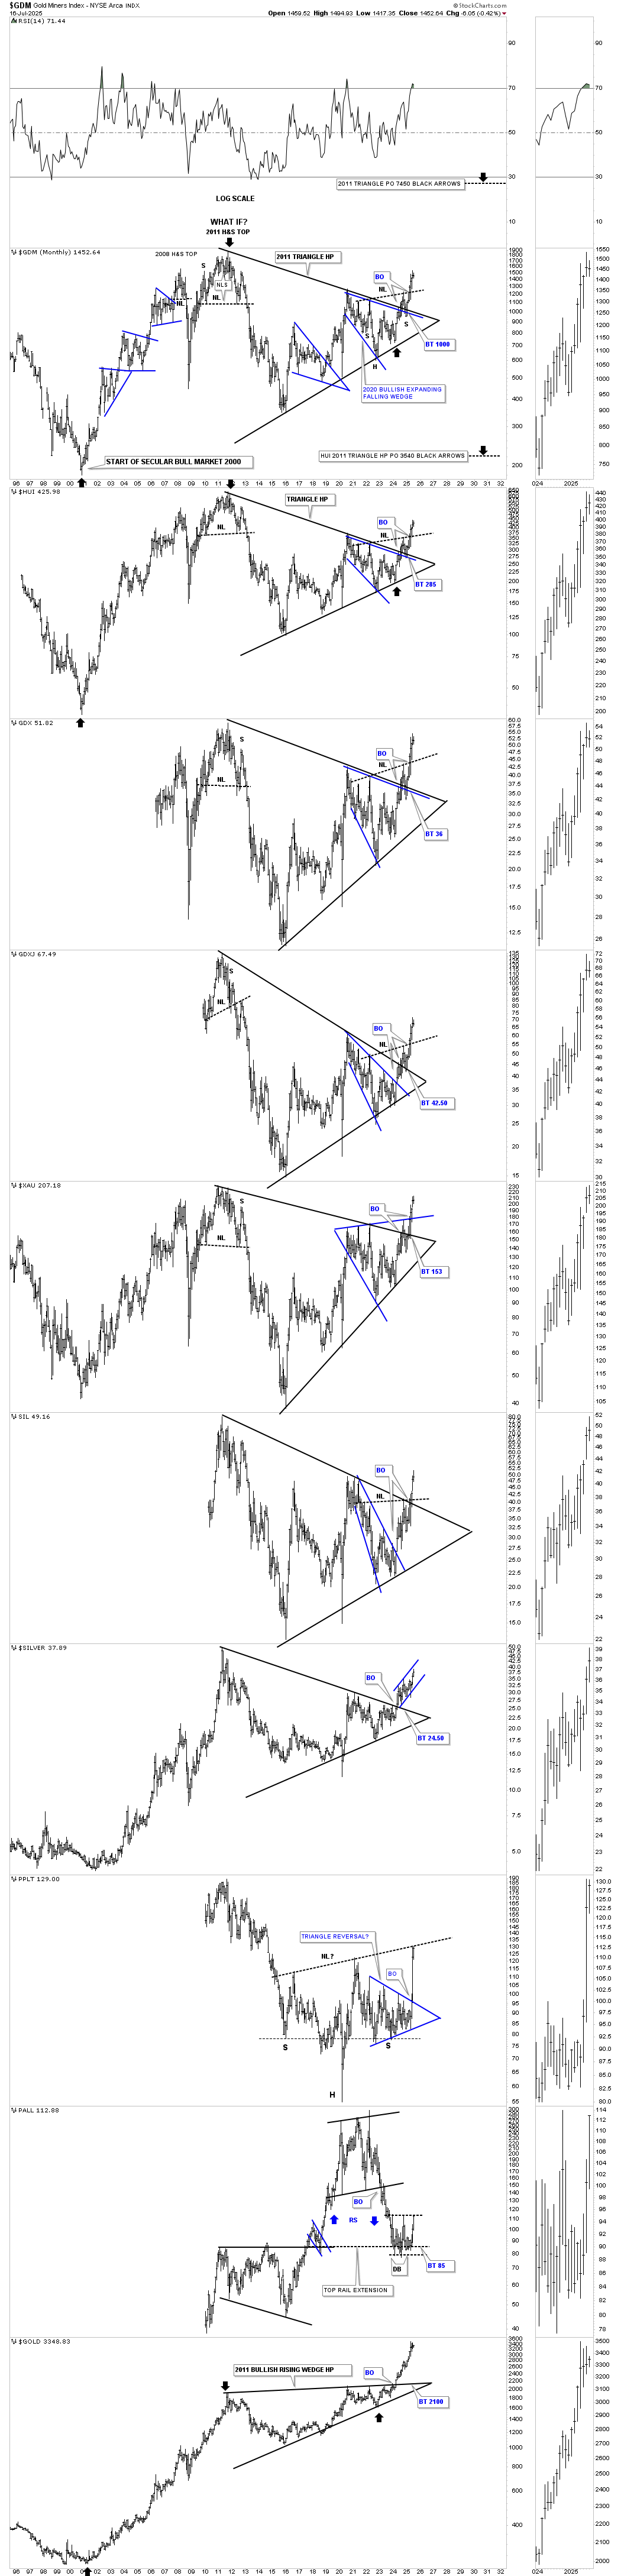
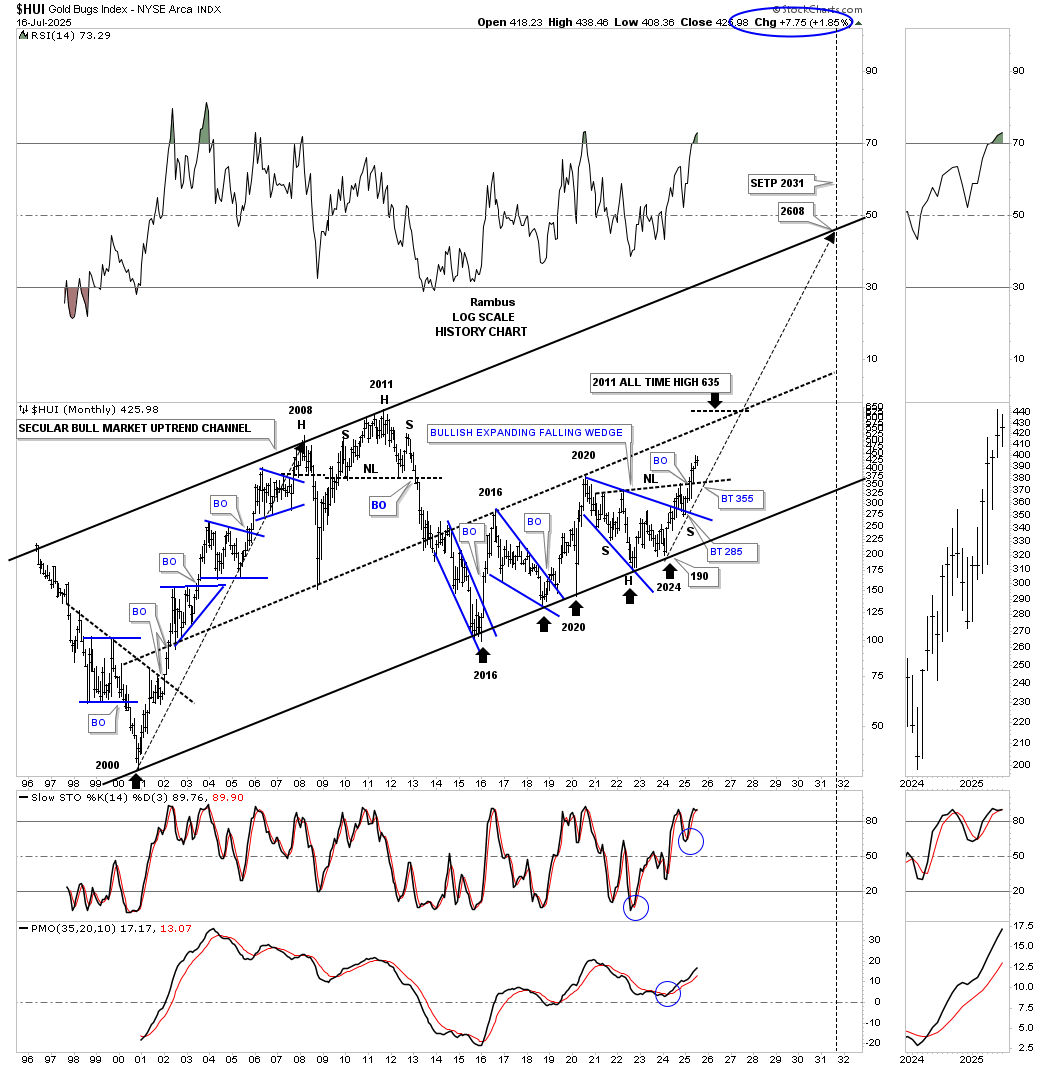
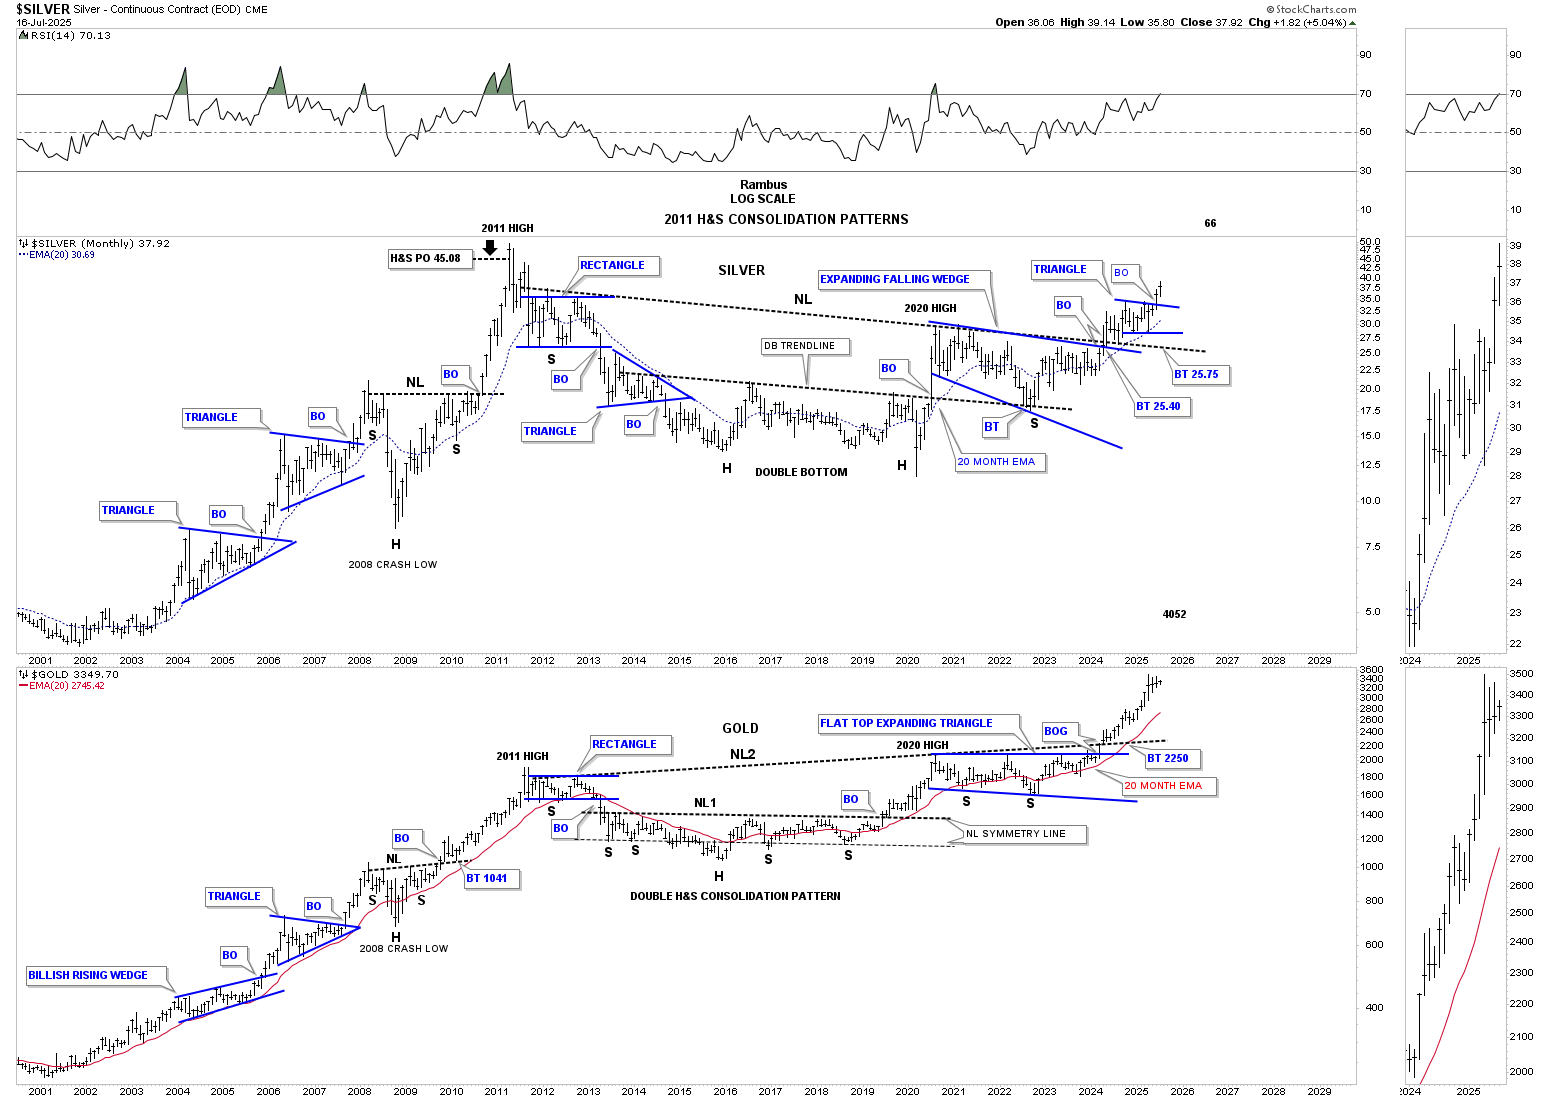
Putting all the pieces of the puzzle together, this next long-term monthly chart shows the 2011 symmetrical triangle consolidation pattern, which I’m also calling a halfway pattern, as shown by the black arrows on the HUI. In any consolidation pattern, you need to have an even number of reversal points – 4, 6, 8, or more. The 2011 H&S top would be reversal point #1, with the 2016 low being reversal point #2, reversal point #3 would be the 2020 high, and reversal point #4 would be the 2022 low.
You can now see how the 2023 H&S consolidation pattern and the 2020 blue bullish expanding falling wedge fit into the apex of the 2011 triangle. Note how the price action broke out of the blue 2020 bullish expanding falling wedge, which is also the top rail of the 2011 triangle, with a completed backtest before taking out the neckline of the 2023 H&S consolidation pattern. That backtest to the top rail of the blue 2020 bullish expanding falling wedge and the top rail of the 2011 triangle ended up forming the right shoulder low of the 2023 H&S consolidation pattern, beautiful Chartology.
At this point in time, the only thing I can’t say with 100% confidence is whether we’ll see a backtest to the neckline before the really big impulse move to the upside gets underway. If we don’t see a backtest to the neckline, then the impulse move to the upside is already in progress. We’ll get our answer from the shorter-term daily charts.
To understand the potential bullishness of this 2011 triangle, just look at the bottom of this combo chart where gold completed its 2011 bullish rising wedge and has been impulsing higher, leading the PM complex.
This next chart is a monthly history chart for the HUI, which we’ve been following for many years, showing its secular bull market parallel uptrend channel and all the trading ranges it has created during its existence. What is interesting is how similar the 2011 H&S top and the 2023 H&S bottom look in time and price. Are we about to see an inverse move to the upside similar to the breakout from the 2011 H&S top?
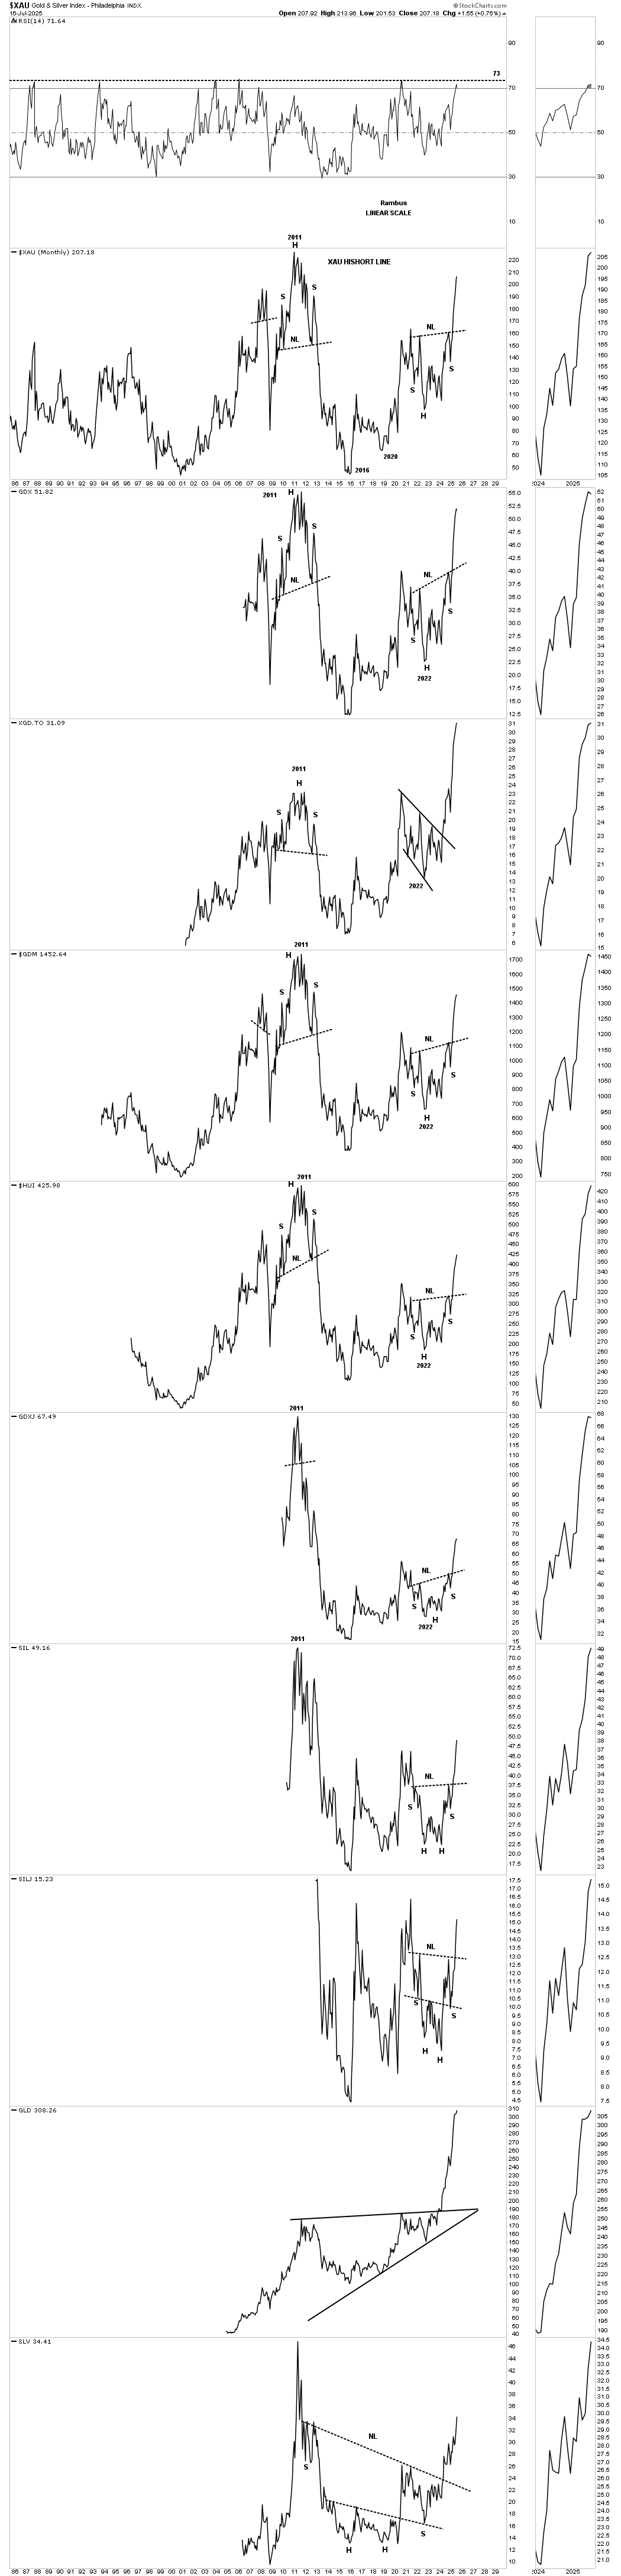
Below is a monthly line chart in linear scale, which shows the 2011 H&S top and the recent 2023 H&S consolidation pattern and how similar they look and the impulse move that followed the breakout of the H&S necklines.
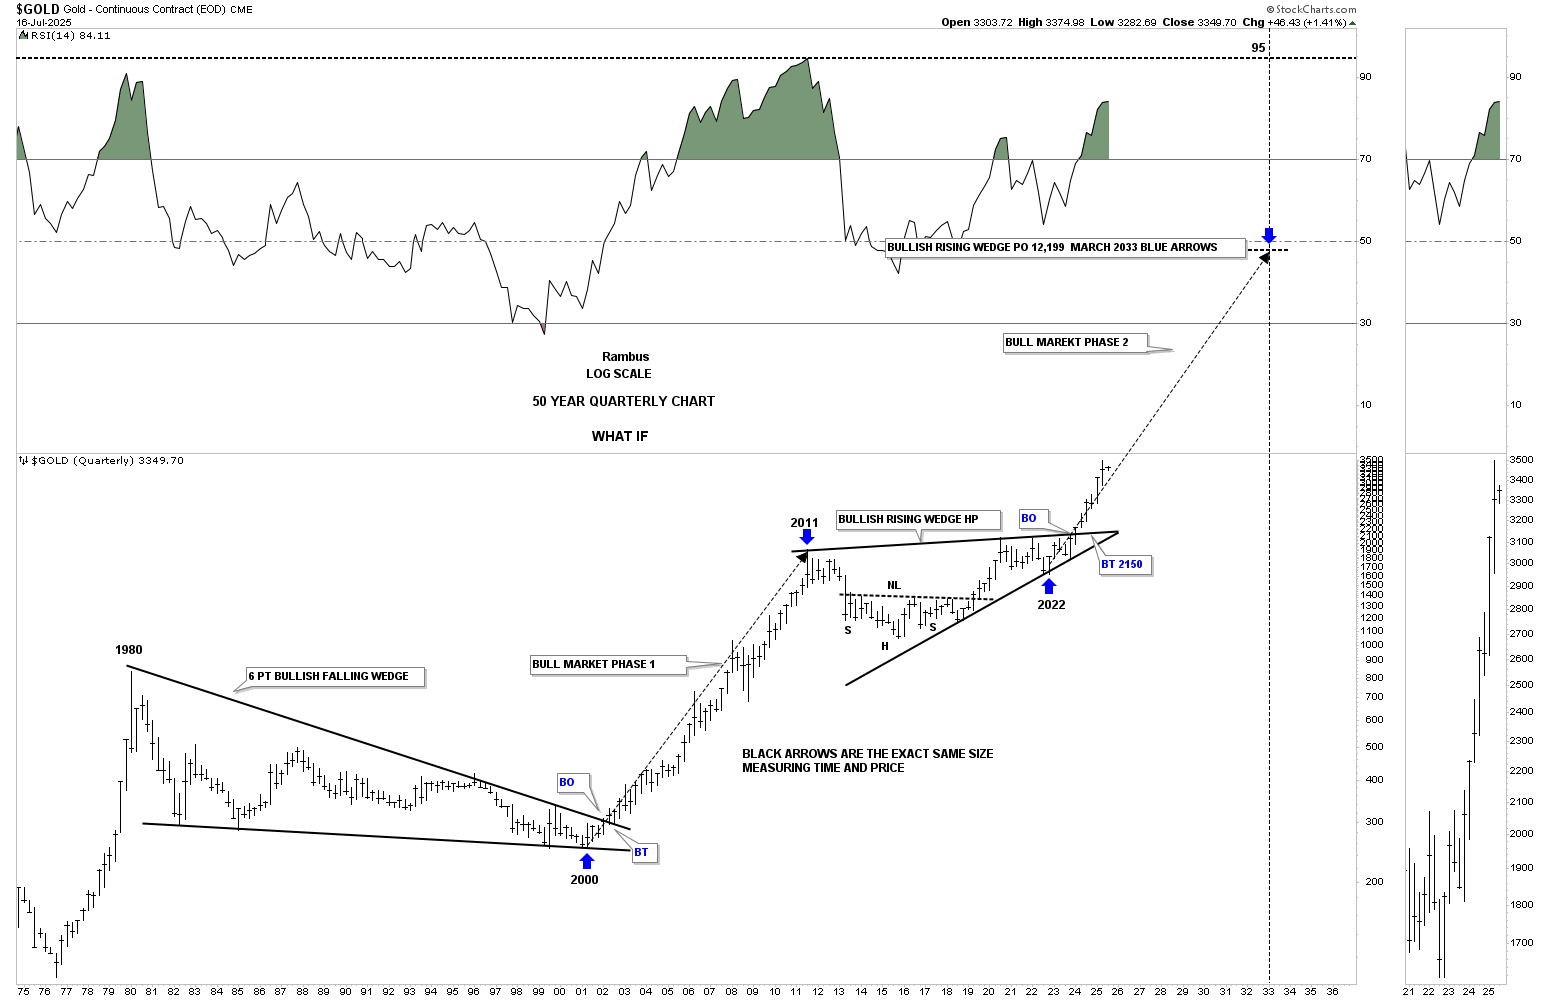
Next is a long-term quarterly chart for gold going back to its 1980 high, which shows the 20-year bear market that followed. During those bear market years, gold formed a massive 20-year bullish falling wedge. At this point, I always add, how do we know it was a 20-year bullish falling wedge? The answer is easy – just look at the bull market that followed the breakout.
Since the 2011 high, gold formed its 2011 bullish rising wedge, which I’m calling a halfway pattern to the upside. Since the last reversal point in the 2011 bullish rising wedge, the angle of the bull market is the same as the 2000 to 2011 bull market rally, long black arrows. Keep in mind, we’ve been following the breakout move while the price action was still trading inside of the 2011 bullish rising wedge, so again, the Chartology is playing out beautifully.
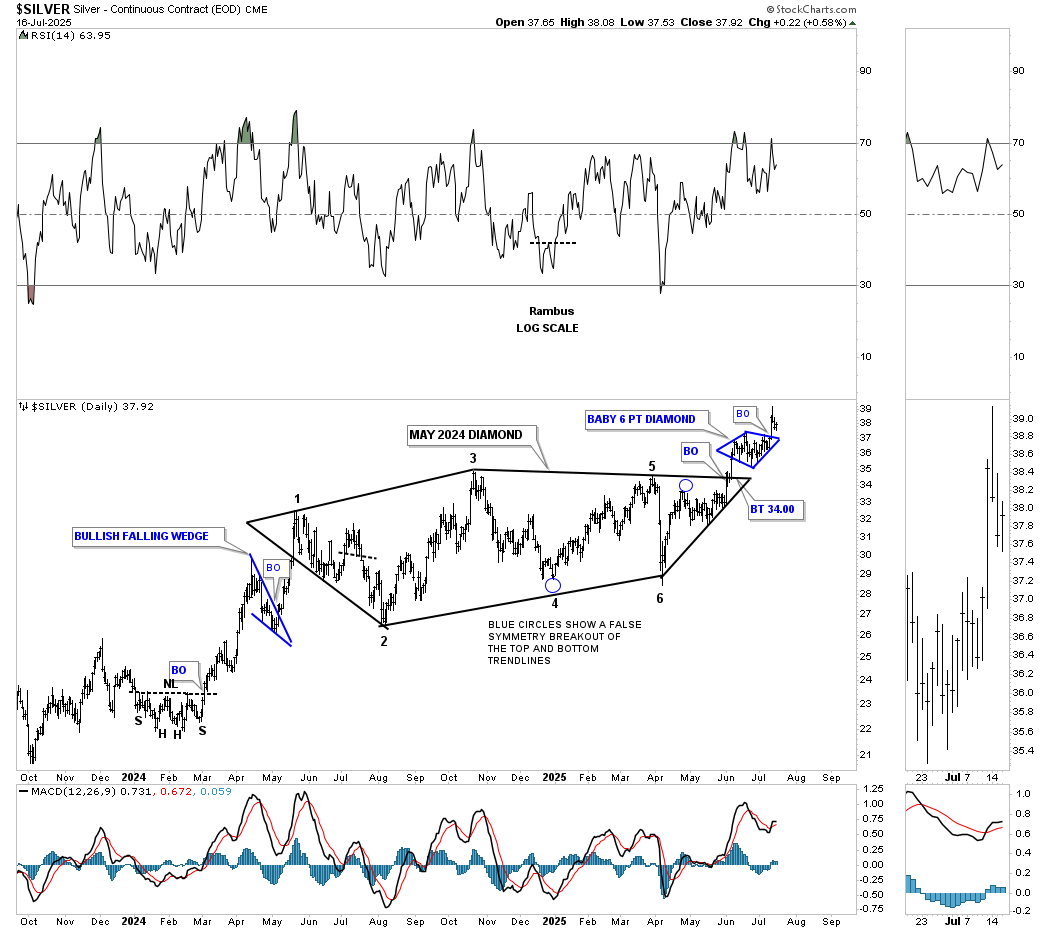
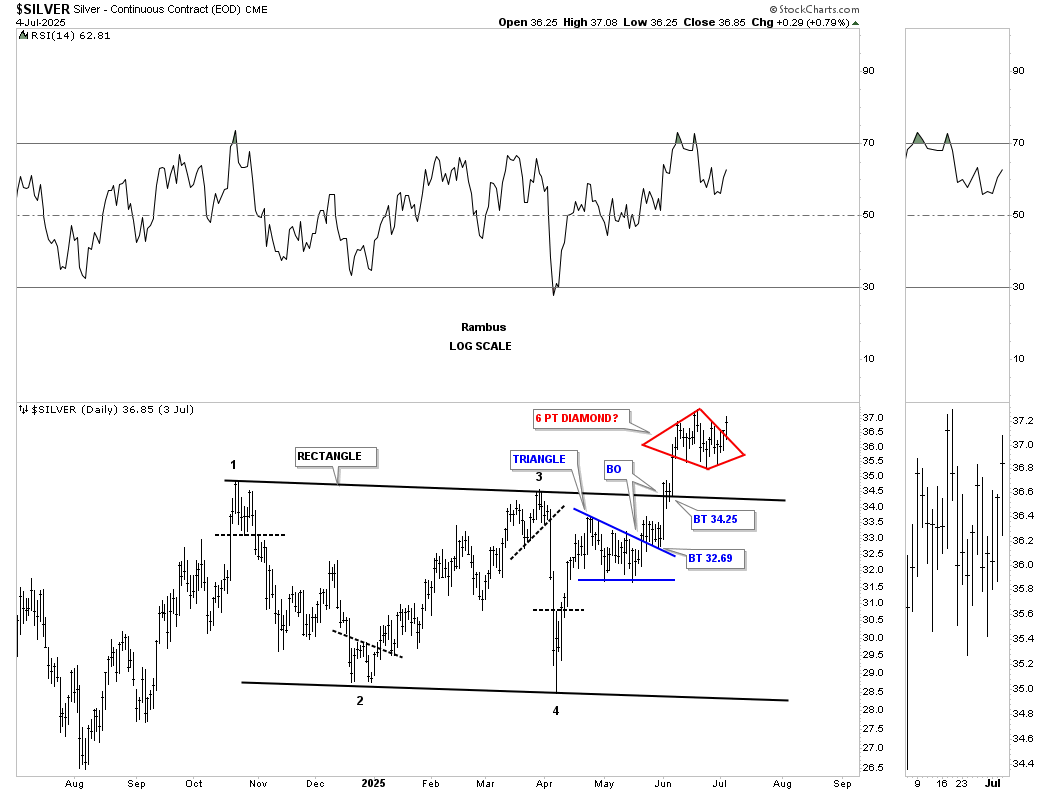
Just a quick update on the short term daily chart for silver showing the baby diamond breakout.
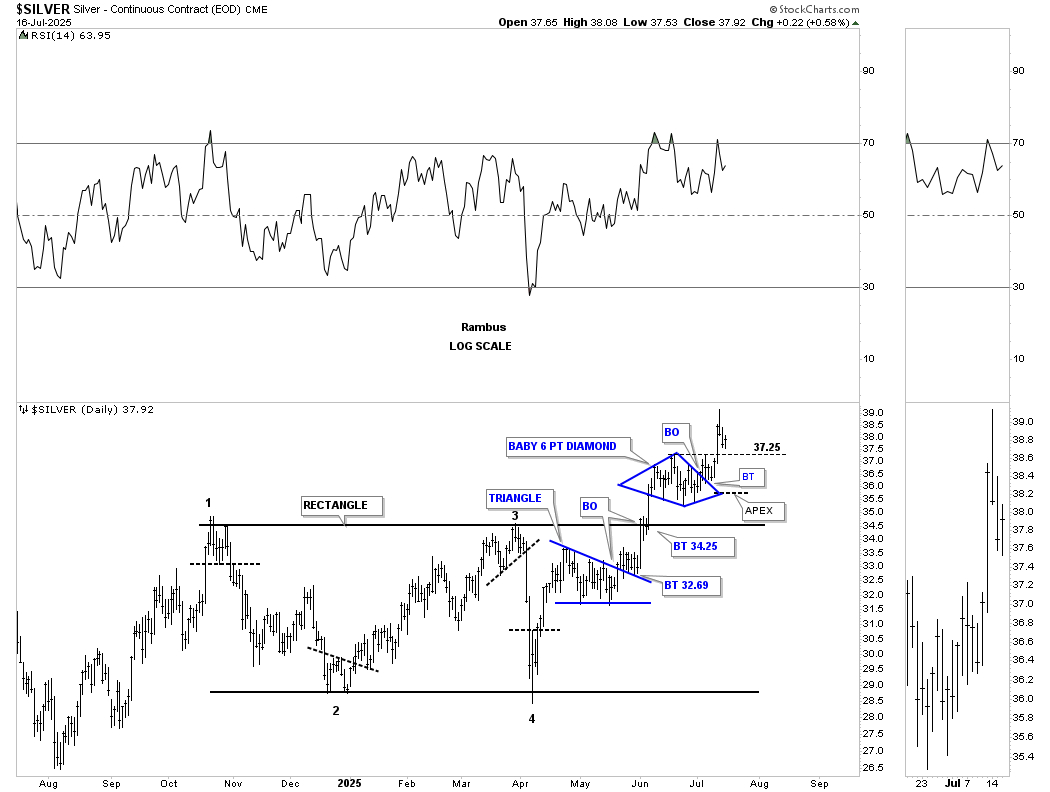
The larger black diamond with the baby blue diamond trading above it.
Both silver and gold have also formed a 2011 massive H&S consolidation pattern, which we’ve been following since the right shoulder low. After lagging gold, silver is picking up the pace and is now leading on a short-term relative basis, as it just made a new higher high, while gold is still in its sideways trading range.
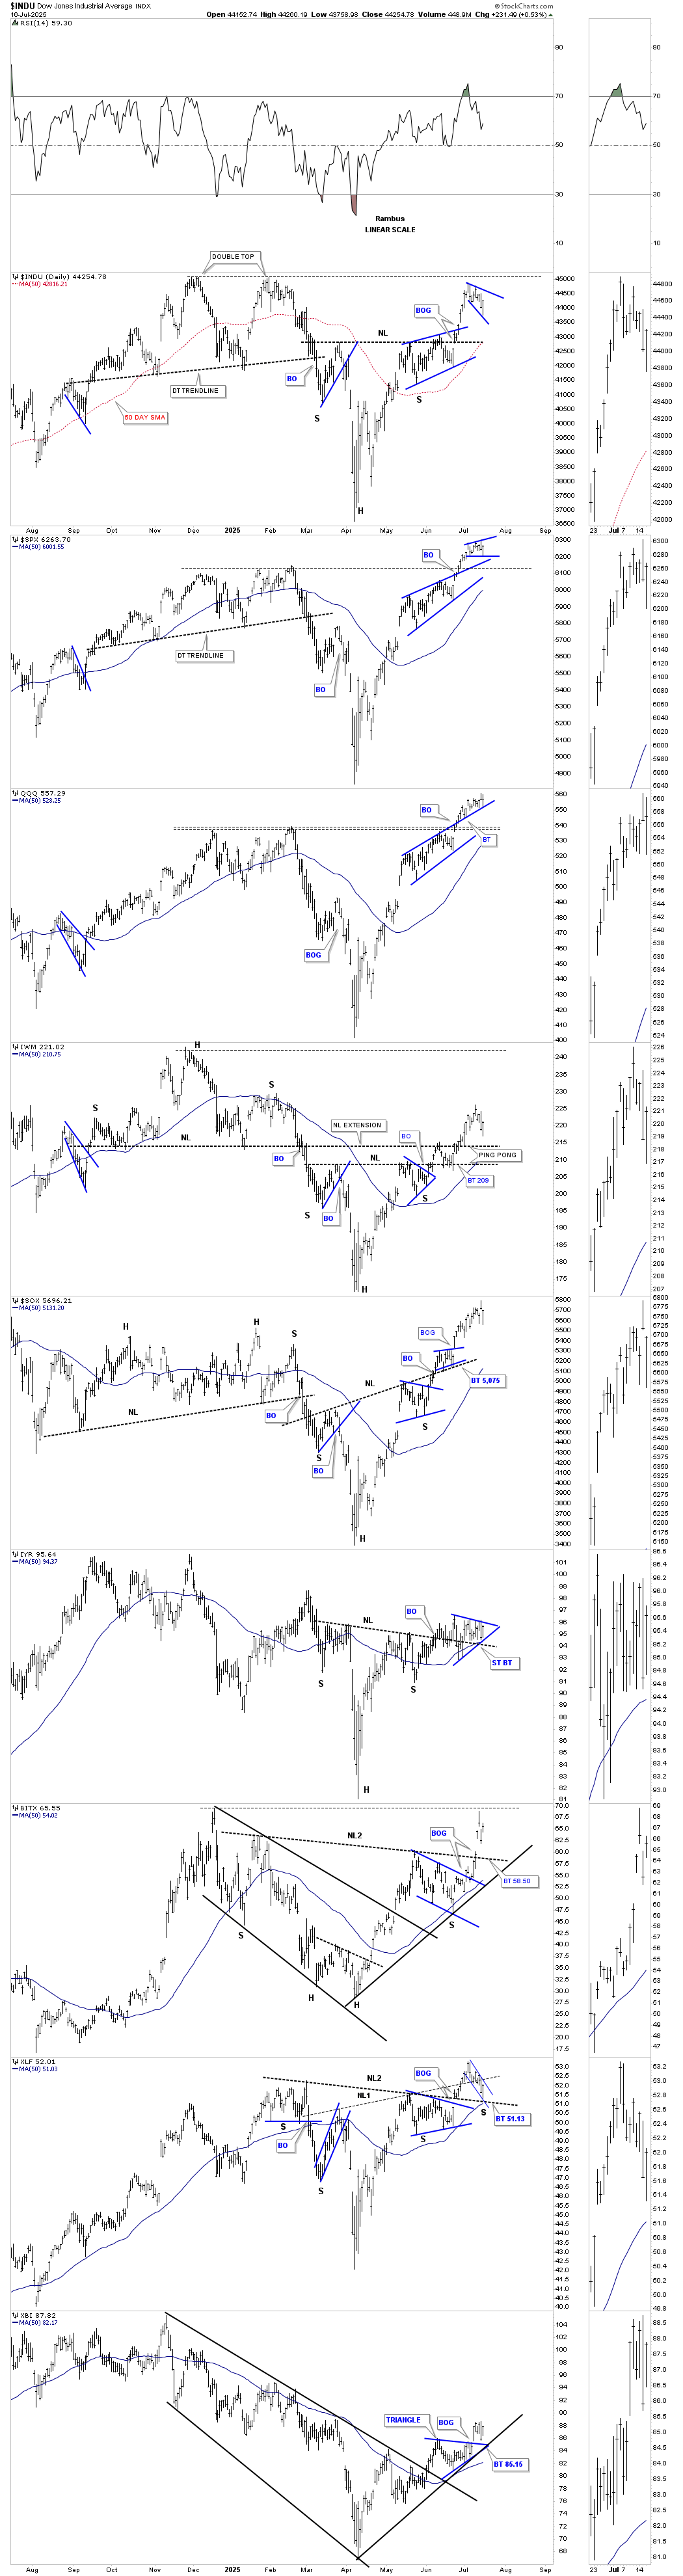
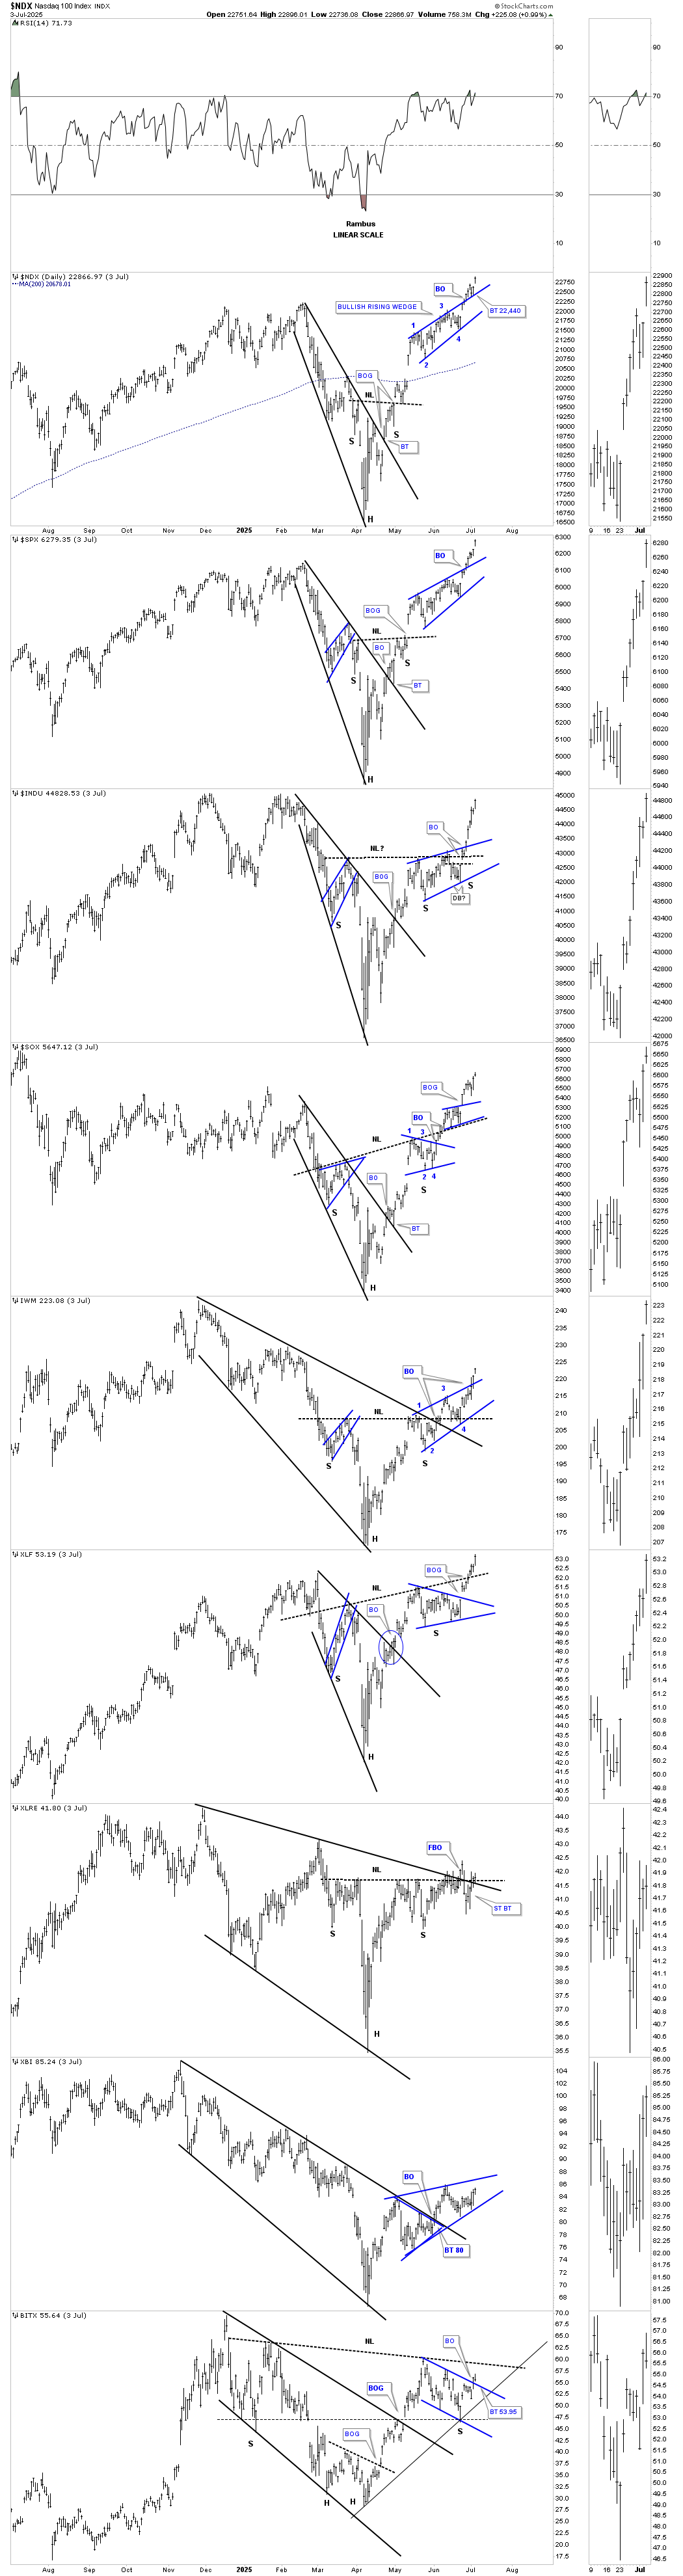
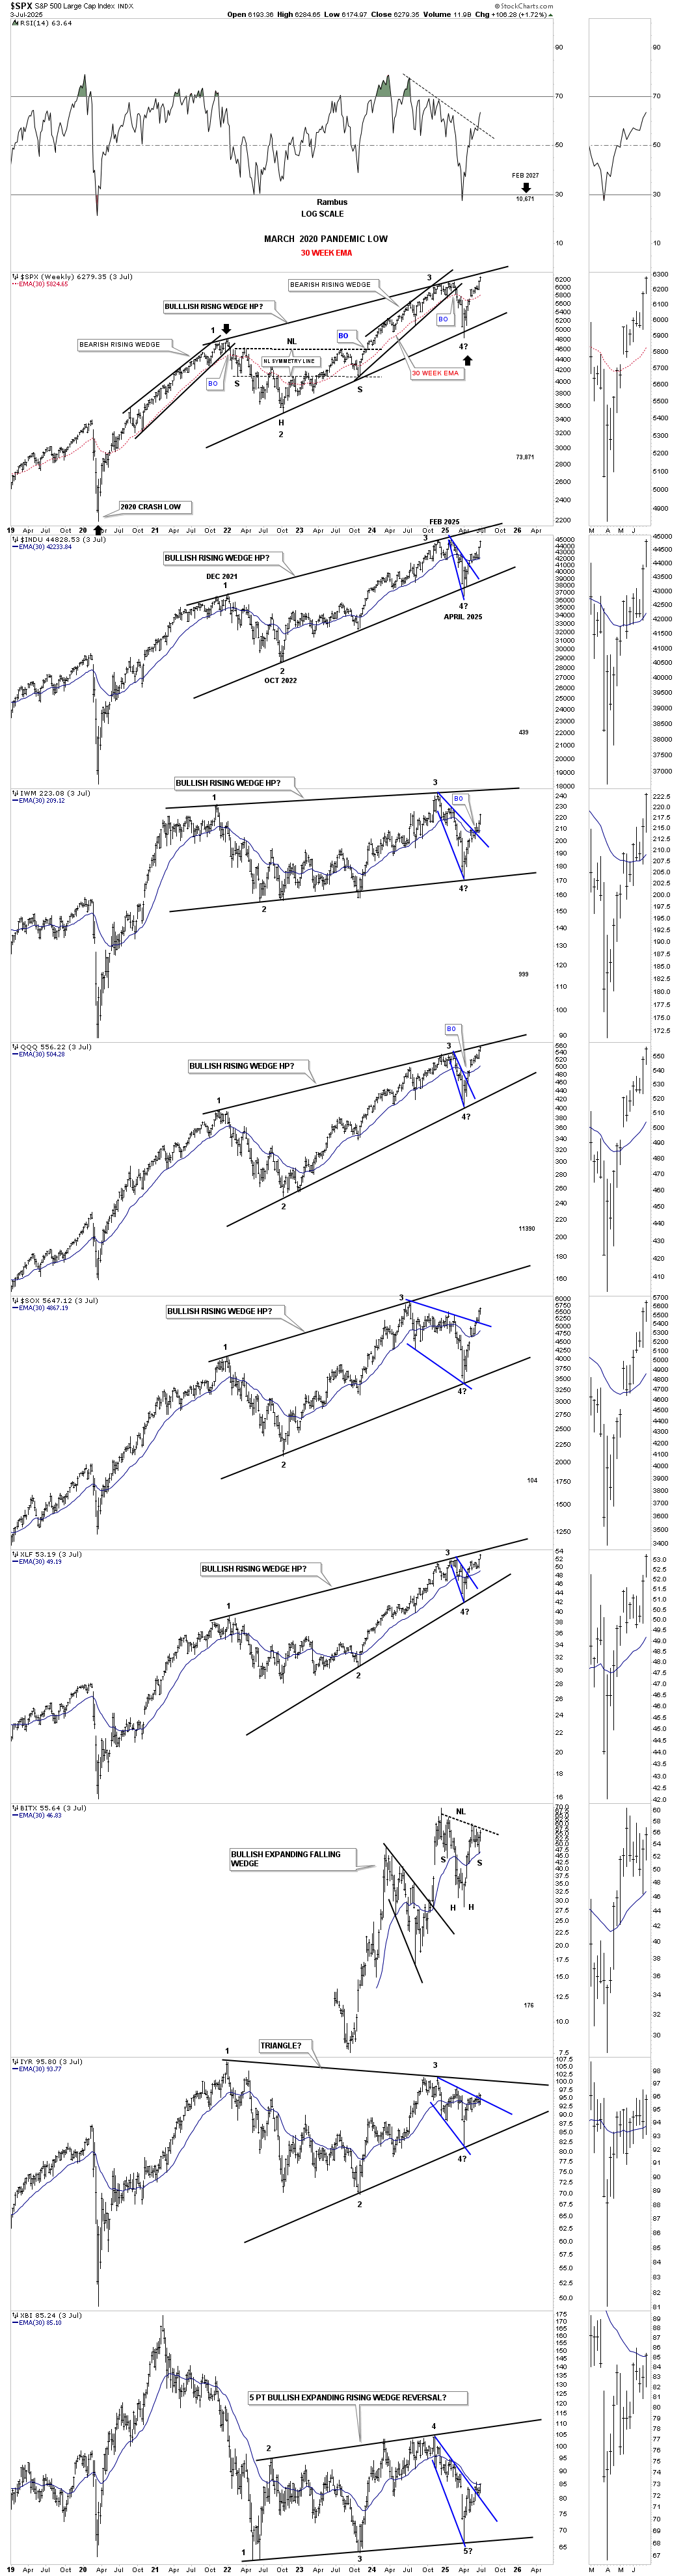
This last chart for tonight is just a quick update on the US stock markets. After breaking out from their H&S bottom in most cases and forming a bullish rising wedge in other cases, the price action has been consolidating over the last several weeks, with a possible new small consolidation pattern forming, which is putting in the possible 4th reversal point low.
So, do big chart patterns lead to big moves, and do big chart patterns lead to even bigger chart patterns, which lead to an even bigger move? Stay tuned, and all the best… Rambus.
Secular Bull Market Rally or Melt-Up Phase: Decoding the Current US Stock Market Trend
Before we look at tonight’s charts, I would like to discuss one important adage that I learned through the years, and that is, “WE ARE PLAYING A GAME OF PSYCHOLOGICAL WARFARE MORE THAN ANYTHING ELSE.”
As investors in the markets, every day we are bombarded by countless news stories, which can be both positive or negative, that subconsciously play a key role in how we view the markets. It’s easy to say the news doesn’t affect me, but after a period of time, it becomes harder and harder to separate oneself from what is true from what is just noise, which can make it hard to draw an objective opinion.
Many investors will seek out news stories and analysts that only agree with what they think is true, thereby they have a biased perspective instead of an open mind. I know for a fact that most PM investors believe the stock markets have to crash and burn in order for the PM complex to have a bull market. If that is a fact, then why are both gold and the SPX trading close to their all-time highs at the same time, with most of the PM stock indexes trading at a 13-year high?
The US stock markets are another perfect example of how negative news stories can close one’s mind to what is reality. They call it, “THE WALL OF WORRY.” The more one reads on how bad things are and are going to get, the more entrenched they become in their negative view of the stock market, not seeing the forest for the trees. The markets are forward-looking by six to ten months, so while most investors are focused on the present, what the markets are seeing six to ten months out could be totally different from the present. This is the reason why everything you read at an important low is bearish and bullish at market tops, “PSYCHOLOGICAL WARFARE.”
Since we’ve been covering the PM complex pretty exclusively, I would like to take a slight detour this week and look at the stock markets, where there are many bullish patterns under construction, which can be just as lucrative as the PM complex if one can keep an open mind.
Before we do, I would like to update silver and its potential bullish diamond consolidation patterns.
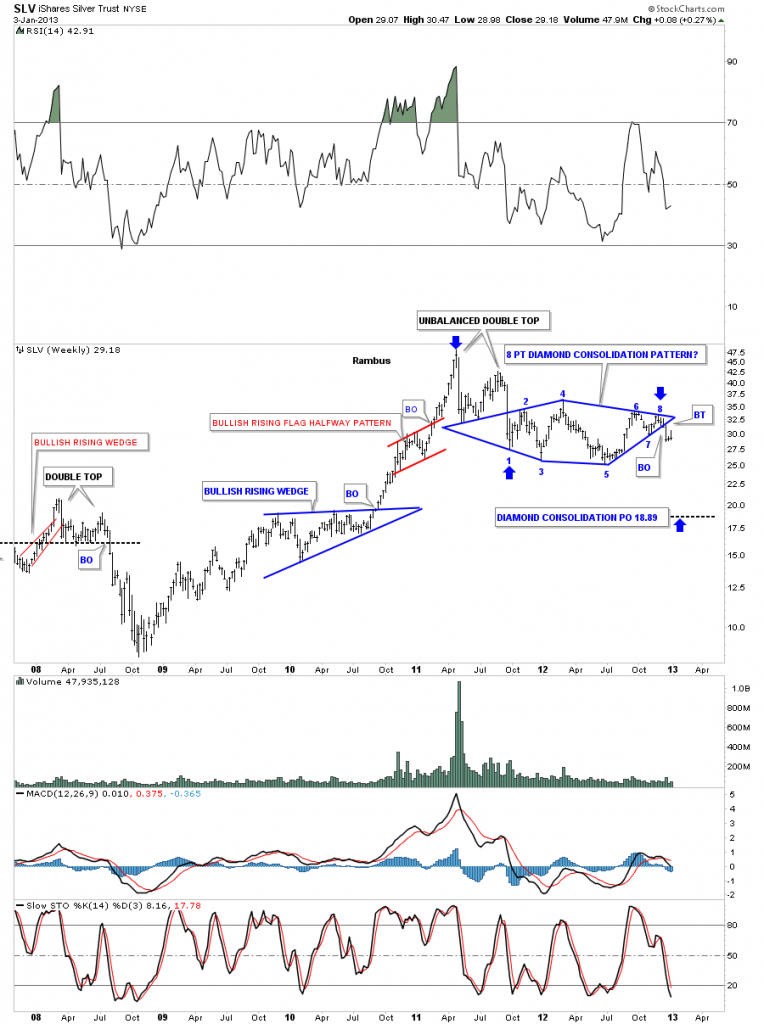
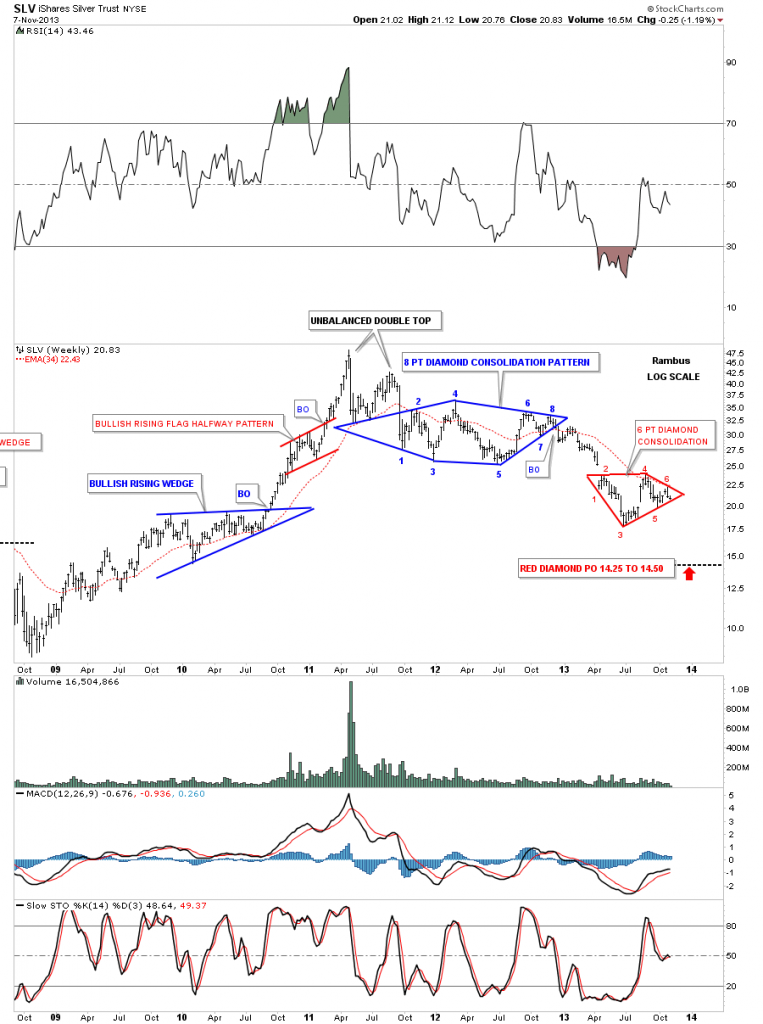
Silver is no stranger when it comes to building diamond consolidation patterns. Shortly after the 2011 bull market top, SLV formed a very diamond consolidation pattern, which completed with eight reversal points.
Back in the early days of Rambus Chartology, Fullgoldcrown used to be my editor and would take interesting charts and highlight them. Below is a weekly chart for SLV, which shows the final bull market rally into the 2011 top. What formed as the first consolidation pattern in the new bear market was the very symmetrical 8-point diamond consolidation pattern. Fullgoldcrown comments on January 3, 2013.
Editor’s Notes:
There is a history of diamonds and silver at Rambus Chartology that needs to be seen here.
Here is a call on silver (via SLV) that I couldn’t believe at the time: “SLV BLUE DIAMOND.”
Next is the November 7, 2013 update showing a second red diamond.
Followed soon after by “SLV RED DIAMOND.”
See that Price Objective (PO) of the Red Diamond? Prediction made November 2013 for 14.50… Which is very close to where SLV bottomed (14.64) in November 2014. (The ultimate bottom was lower at 13).
Today, July 6, 2025:
I changed the color of the blue diamond to red to match the red diamond on the 2013 chart above.
Last week, after finally recognizing the red diamond, last Friday’s price action shows a breakout of the top trendline.
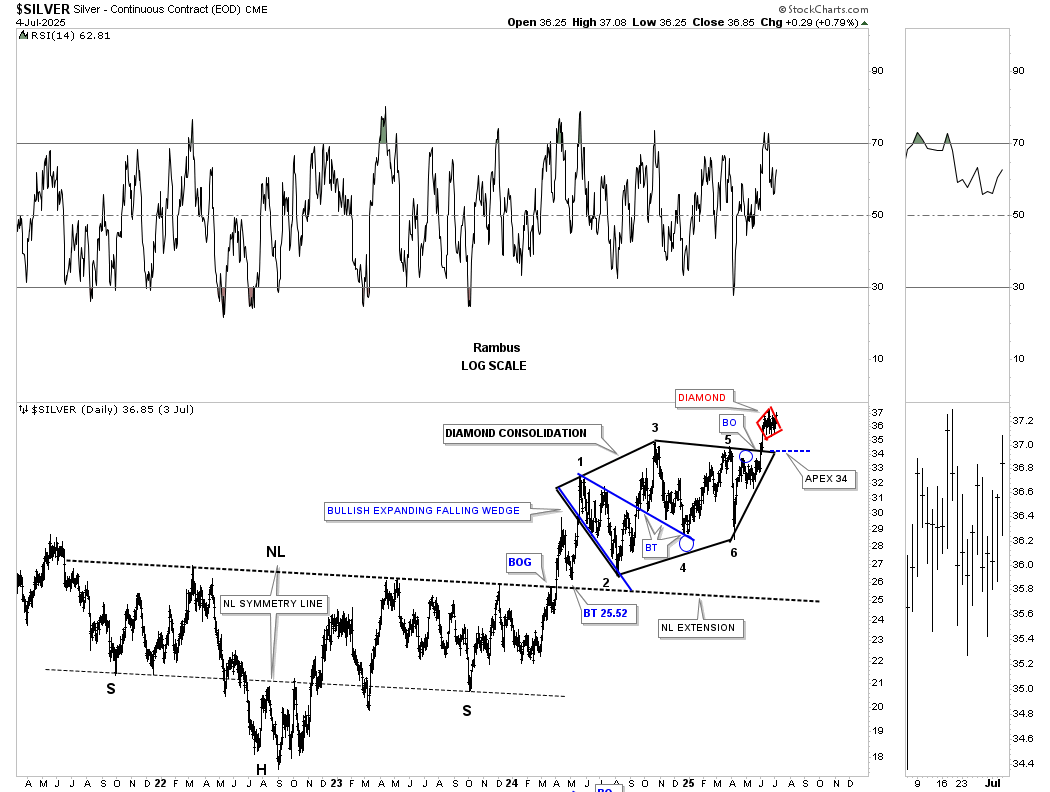
And if you recall, there was the much bigger 6-point diamond consolidation pattern that was made up of the blue bullish expanding falling wedge and the symmetrical triangle that began forming at the 3rd reversal point.
If you go back and look at that 2013 SLV diamond, with the smaller red diamond just below it, we currently have an inverse look taking place this time, with the smaller red diamond forming above the larger black diamond.
Now I would like to move on to the psychological warfare part of this Weekend Report by looking at some world and US stock markets.
First, let’s get our bearings by looking at the short-term daily combo chart we’ve been following very closely, showing the February to April bullish expanding falling wedge with the H&S bottom, with many of the right shoulders forming the blue bullish rising wedge. So far, the NDX, SPX, and XLF are trading at a new all-time high, with the INDU not too far behind now.
Since I had a little extra time this 4th of July weekend, I built a new weekly combo chart for the US stock markets. I touched on the potential 2021 bullish rising wedge in the end-of-month Monthly Update in the Leveraged Trade portfolio.
I’m out of annotations, but the first chart is close to being properly annotated. This combo chart starts at the 2020 crash low and shows the very strong rally into the December 2021 all-time high back then, which was followed by the nearly two-year correction where the very symmetrical H&S consolidation pattern formed.
The rally out of the H&S consolidation pattern also formed another bearish rising wedge, but this one was much shorter in time and price, lasting just two months from the February high to the April low, forming the potential 4th reversal point in the bullish rising wedge, which is yet to be confirmed but is getting close.
You can also see the negative divergence on the RSI, which is a hallmark of a bullish rising wedge or flag. Note how high the RSI was during the topping process compared to where it’s today. Many will question my positive view of this negative divergence and call for much lower prices to come. I, on the other hand, see the SPX trading at a new all-time high while the RSI has quite a ways to move higher before becoming oversold once again.
The other important feature of the 2021 rising wedge is that I’m viewing it as a halfway pattern to the upside, as shown by the black arrows, which I know sounds a bit ridiculous with all the negative news from tariffs, war in Ukraine, and war between Israel and Iran, and a softening economy. This is the psychological warfare and wall of worry that needs to be climbed in order to keep most investors off the bull market until the top is in sight.
If you think the rest of the world is in dire shape, some of these long-term monthly charts will show you a completely different picture. I also added some US stock markets to the mix so as not to show any favoritism. I’ll run through these next charts fairly quickly, as they are pretty self-explanatory.
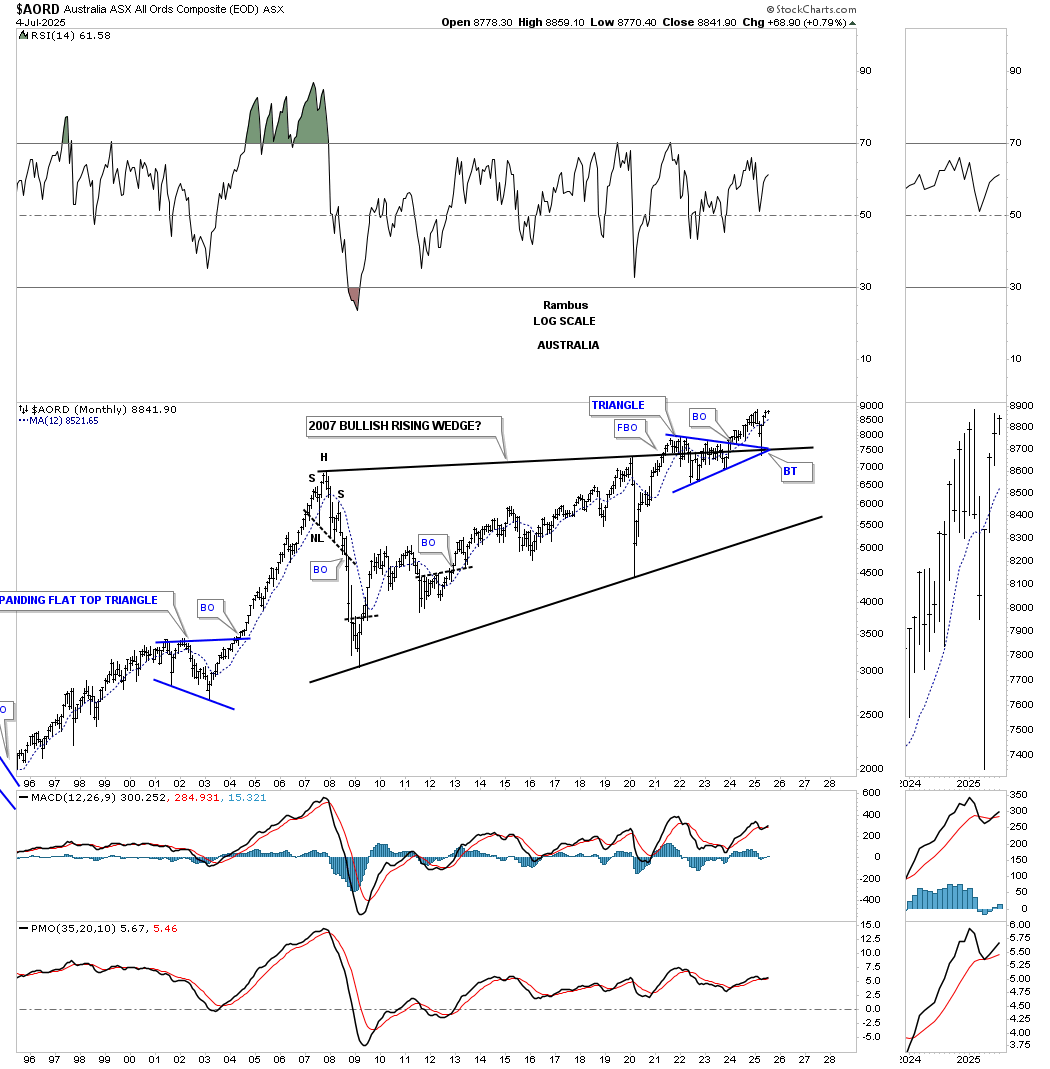
The AORD shows a massive 2007 bullish rising wedge, with the blue triangle forming right in the middle of the top trendline, which we know can be a very bullish setup. After backtesting the top rail of the 2007 bullish rising wedge and the apex of the blue triangle, the price action is currently trading very close to a new all-time high.
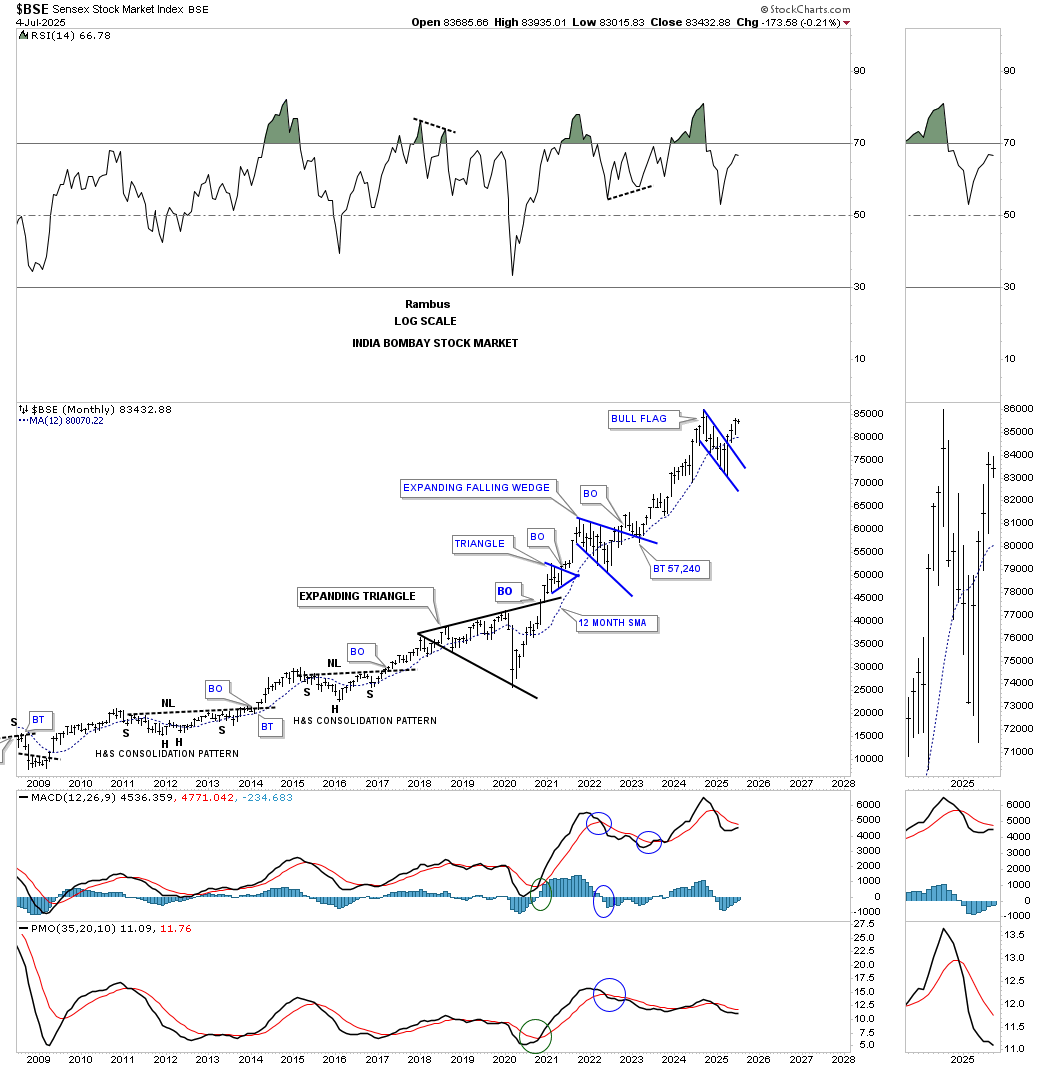
The BSE, India’s Bombay stock market, has just been one of the stronger stock markets in the world and has recently broken out from a bull flag and is approaching its all-time highs once again.
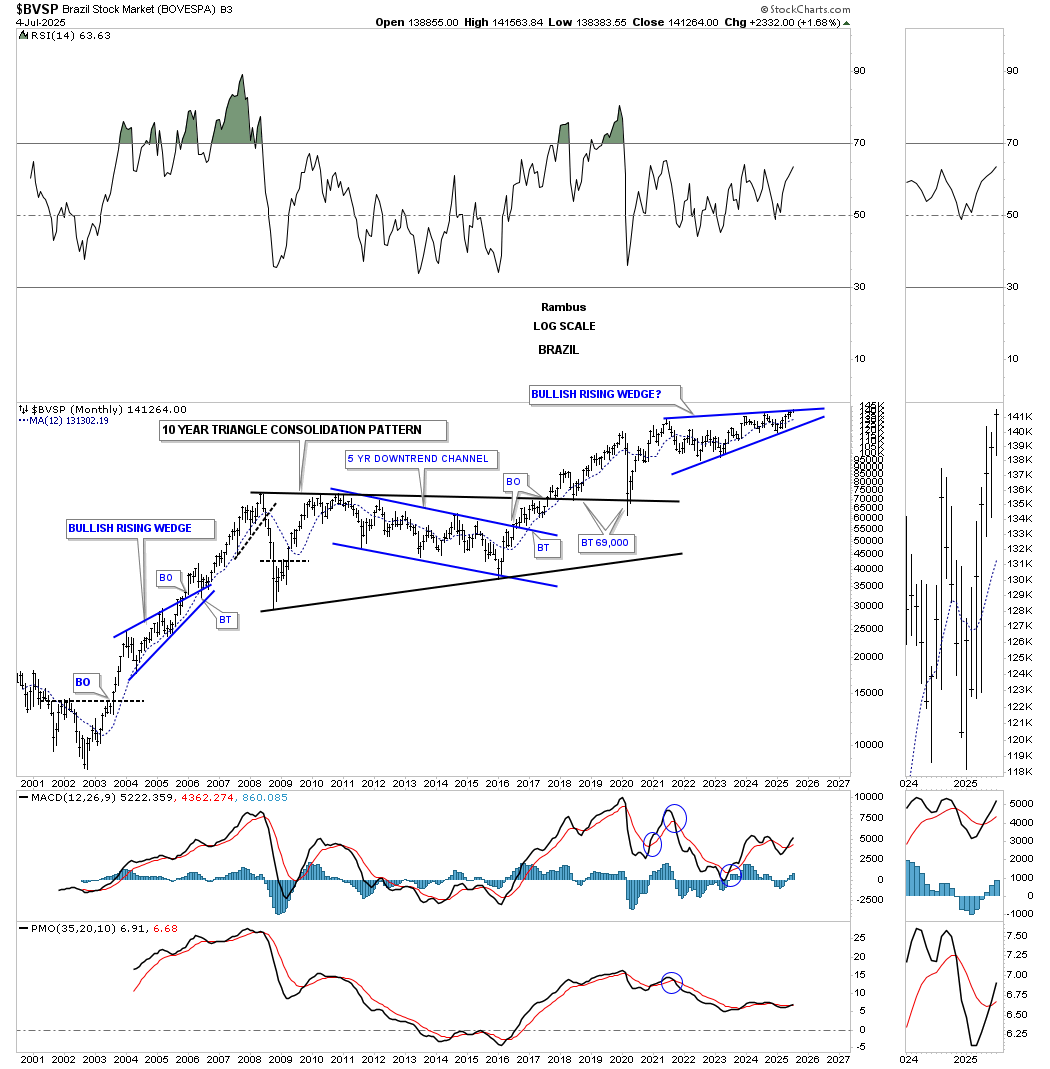
The BVSP, Brazil stock market, has been building a bullish rising wedge and is currently trading at a new all-time high.
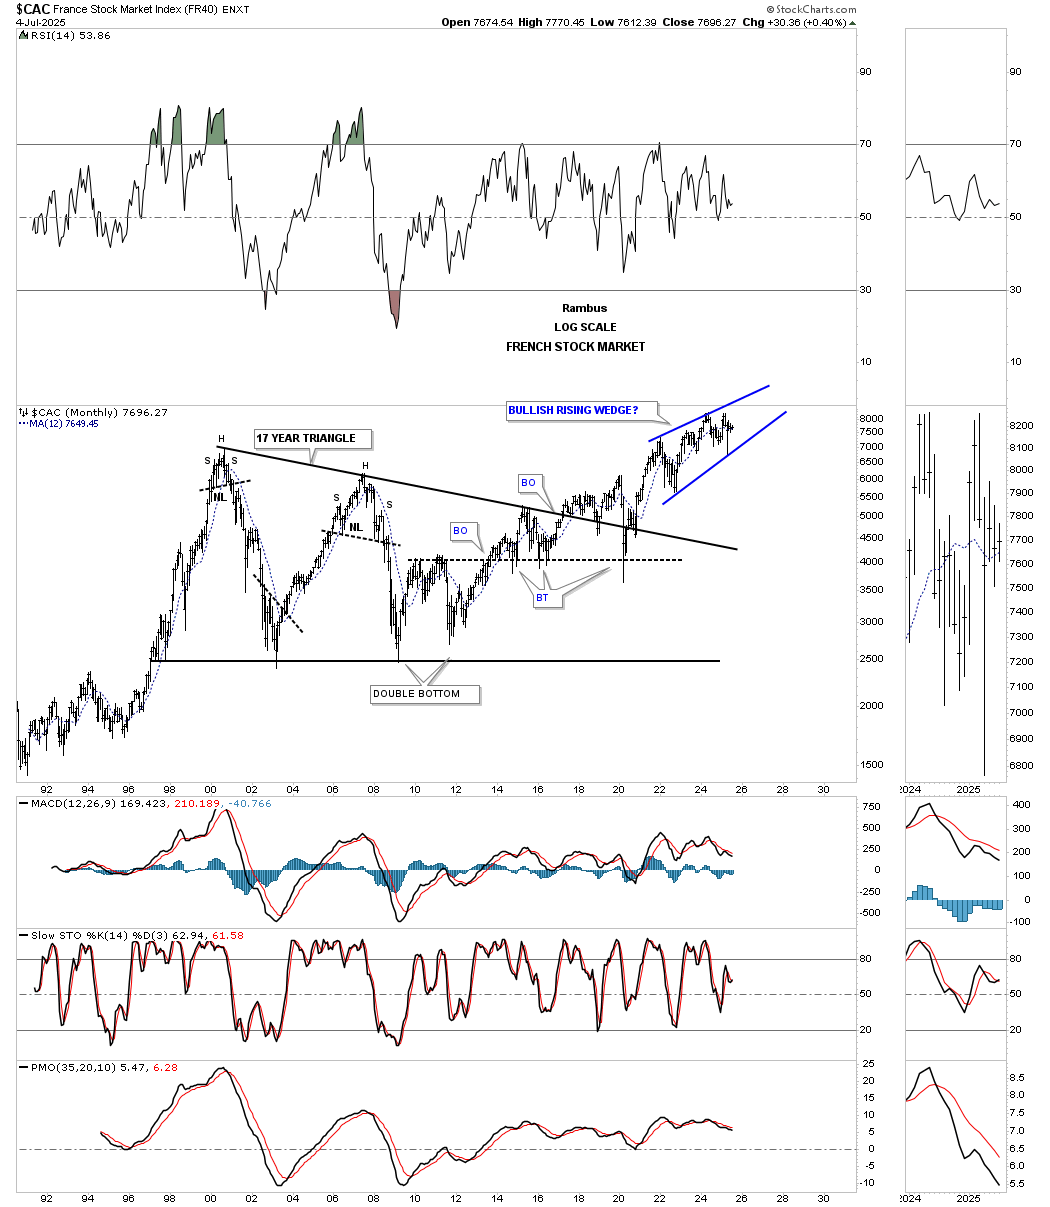
The CAC, French stock market, formed a massive triangle consolidation pattern and has been forming the blue rising wedge and is not that far away from new all-time highs.
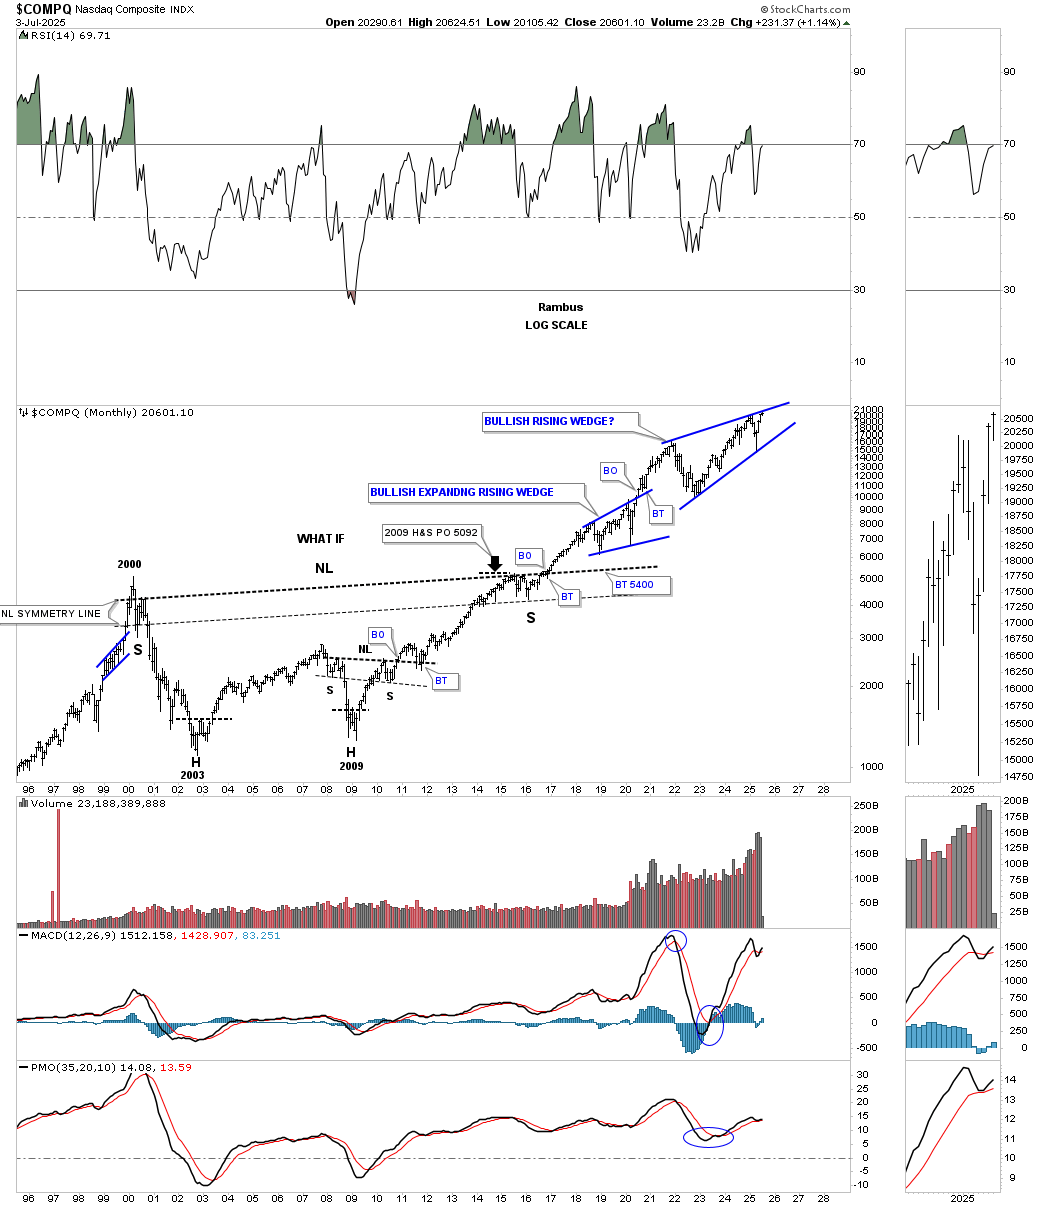
After forming the massive H&S bottom, the COMPQ is trading at a new all-time high and is on the verge of breaking out of the blue rising wedge.
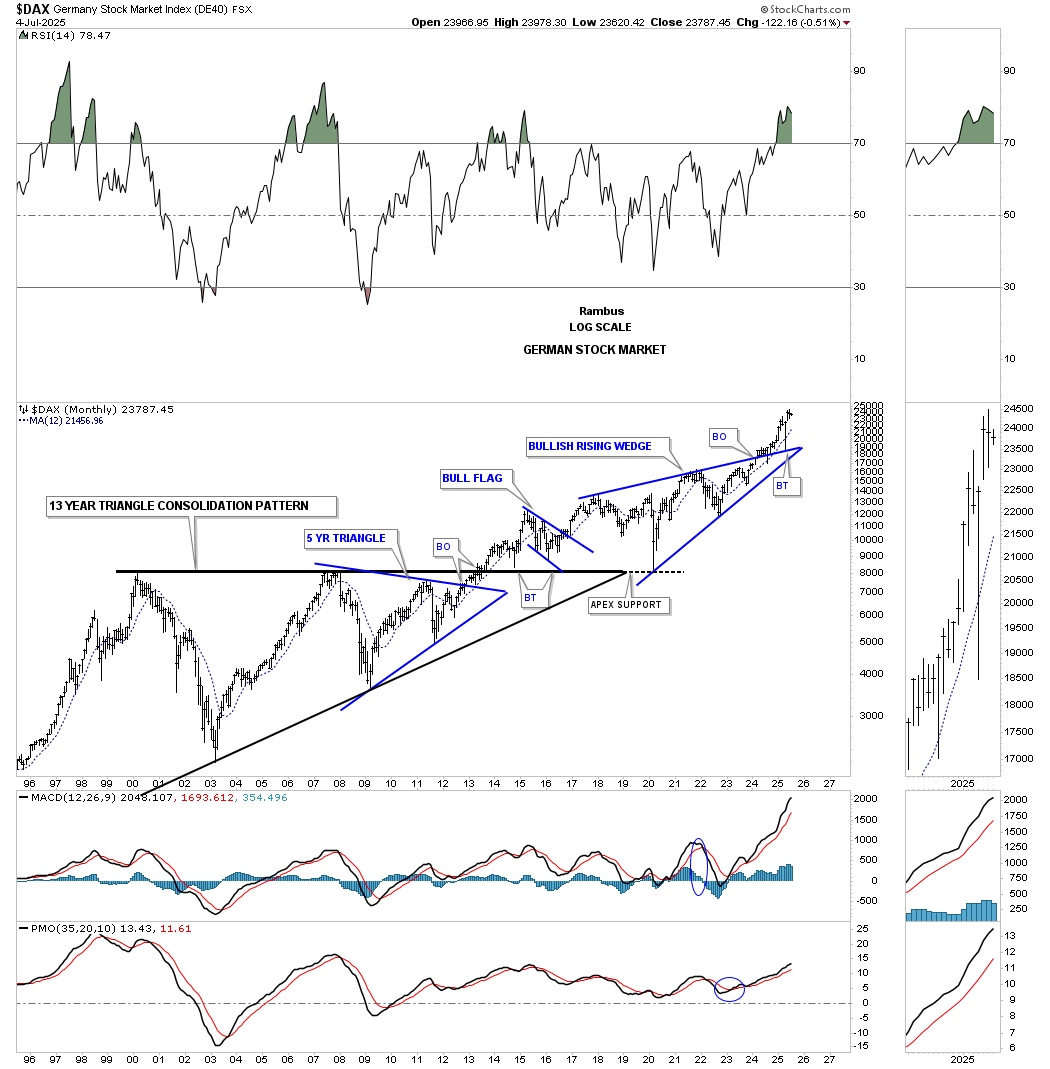
The DAX looked very similar to the US stock market indexes from the 2000 high to the breakout point of the 13-year black flat-top triangle consolidation pattern, and has recently broken out and backtested the top rail of the 2018 bullish rising wedge.
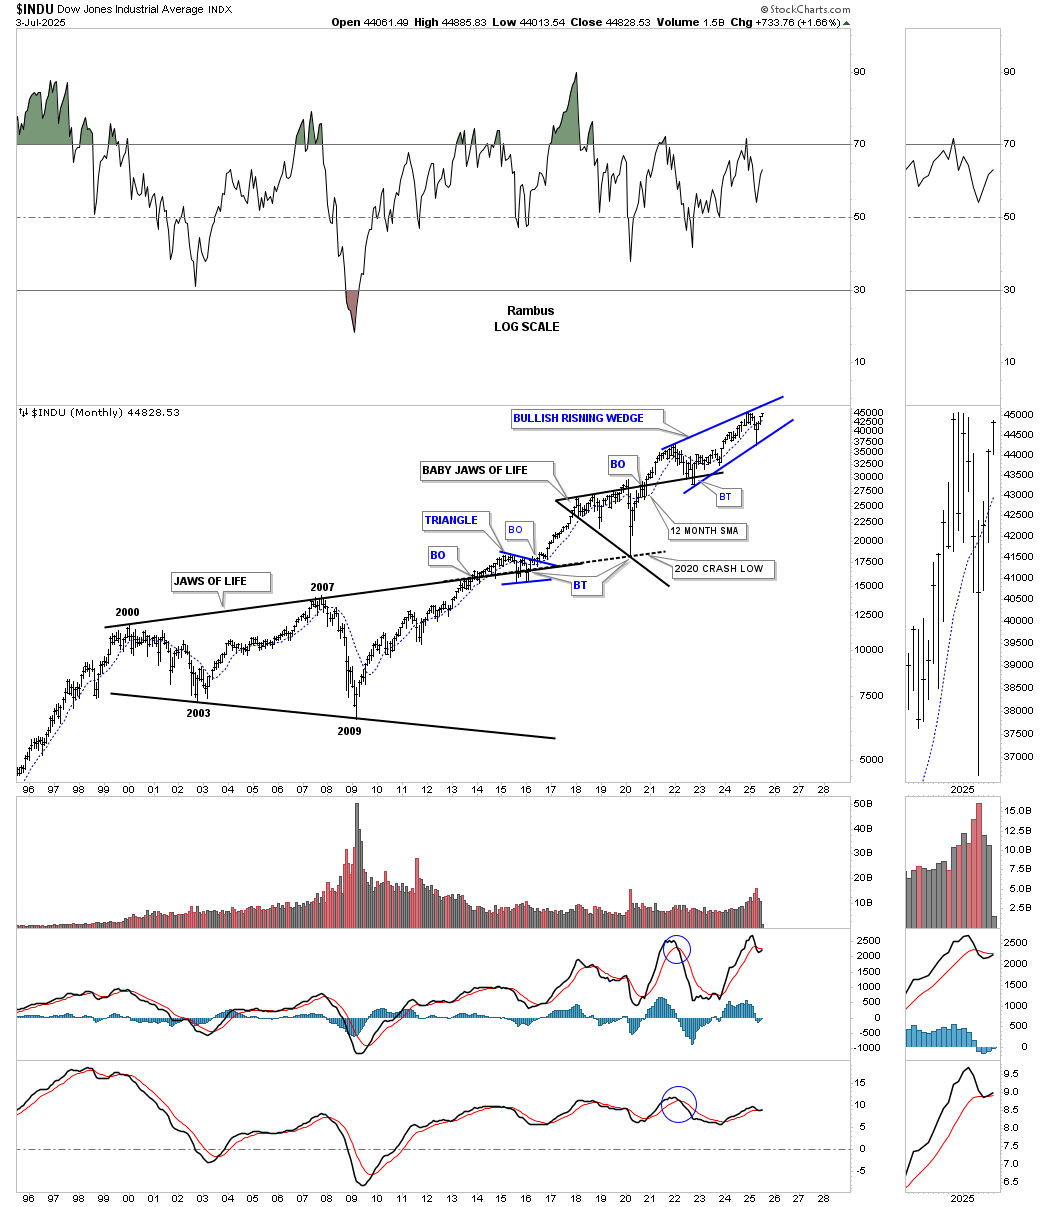
Next is the INDU, which shows its very large 2000 Jaws of Life consolidation pattern with the baby Jaws of Life forming the backtest. It too is getting close to new all-time highs with a breakout of its bullish rising wedge.
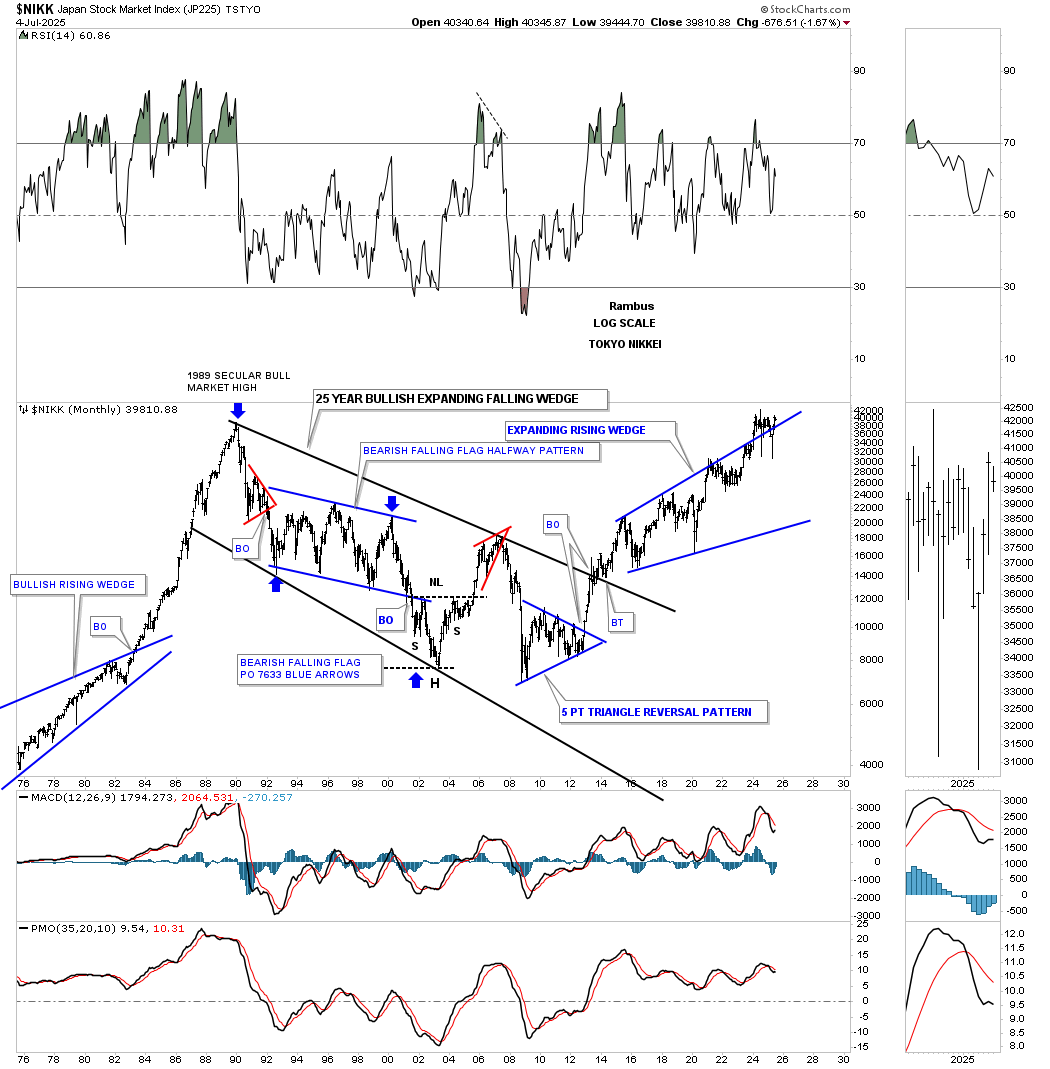
The NIKK, Japan stock market, has been building a massive expanding rising wedge which experienced a breakout with a sloppy backtest so far, but is currently trading close to its all-time highs going all the way back to 1989. That bull run that started in the early 1980s shows you how a bull market comes to an end and what happens after such a strong parabolic move. It has taken about 35 years to get back to its 1989 all time high.
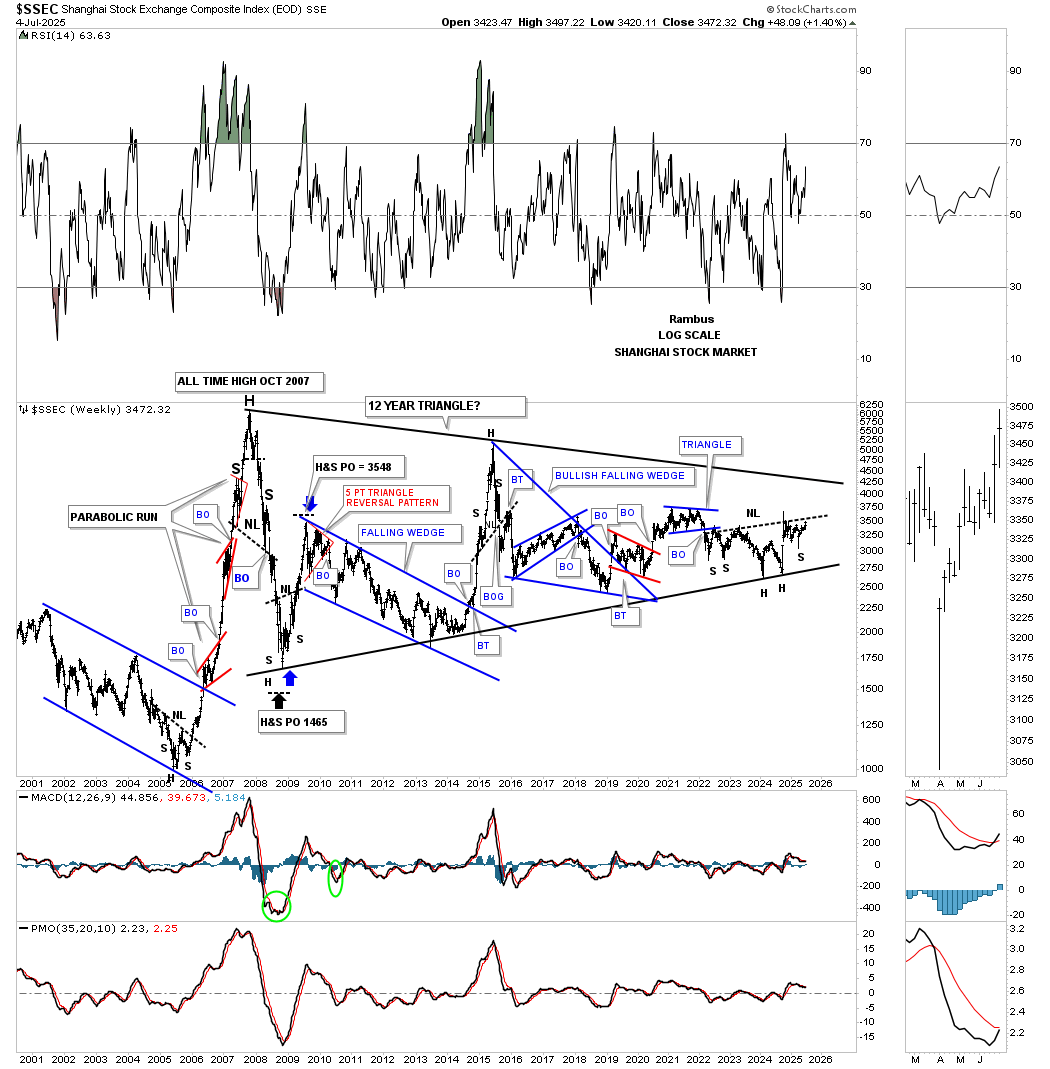
Next is an old weekly chart for the SSEC, which shows you how its secular bull market came to an end in 2007 after its parabolic rise. Almost 20 years later, the SSEC is nowhere close to its all-time high made in 2007. I still remember charting those three small red consolidation patterns that formed the parabolic rally and asking the question, “What will it mean for the rest of the world’s stock markets?” We got our answer during the 2007 and 2008 crash during the real estate and banking crisis.
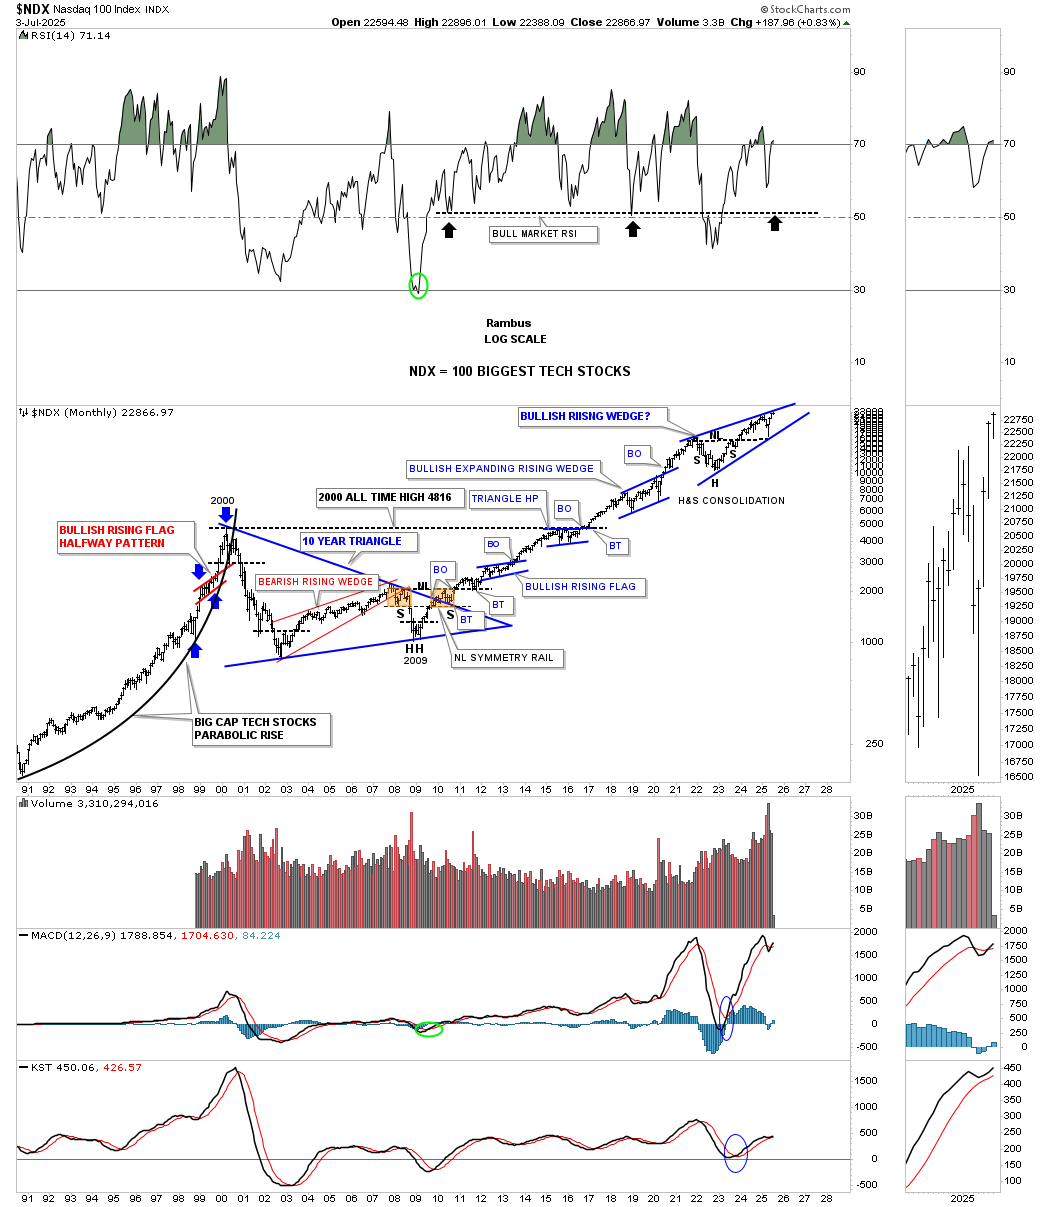
This is still one of my favorite charts from the tech bubble era in the 1990s, with the small red bullish rising flag forming a halfway pattern as shown by the blue arrows. I can assure you, few saw that red consolidation pattern as the mania phase was in full swing with no end in sight in the bull market. Currently, you can see the 2021 bullish rising wedge with the H&S consolidation pattern forming the lower part of the pattern.
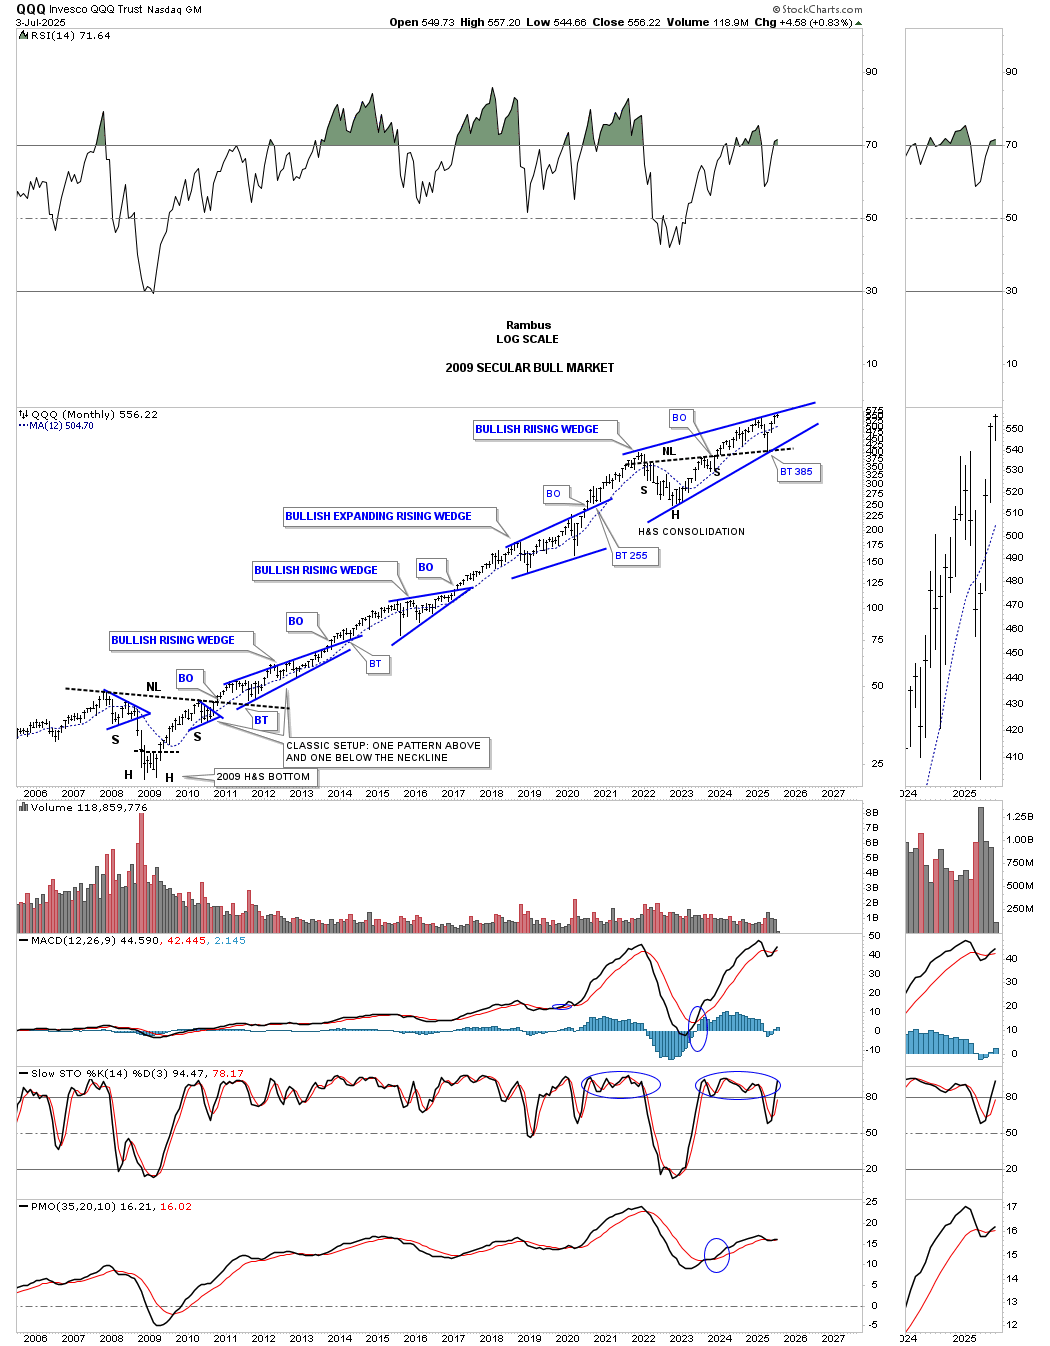
The QQQ 2009 secular bull market with beautiful Chartology. Note how every blue consolidation pattern is slopping up into the uptrend which is a sign of strength not weakness.
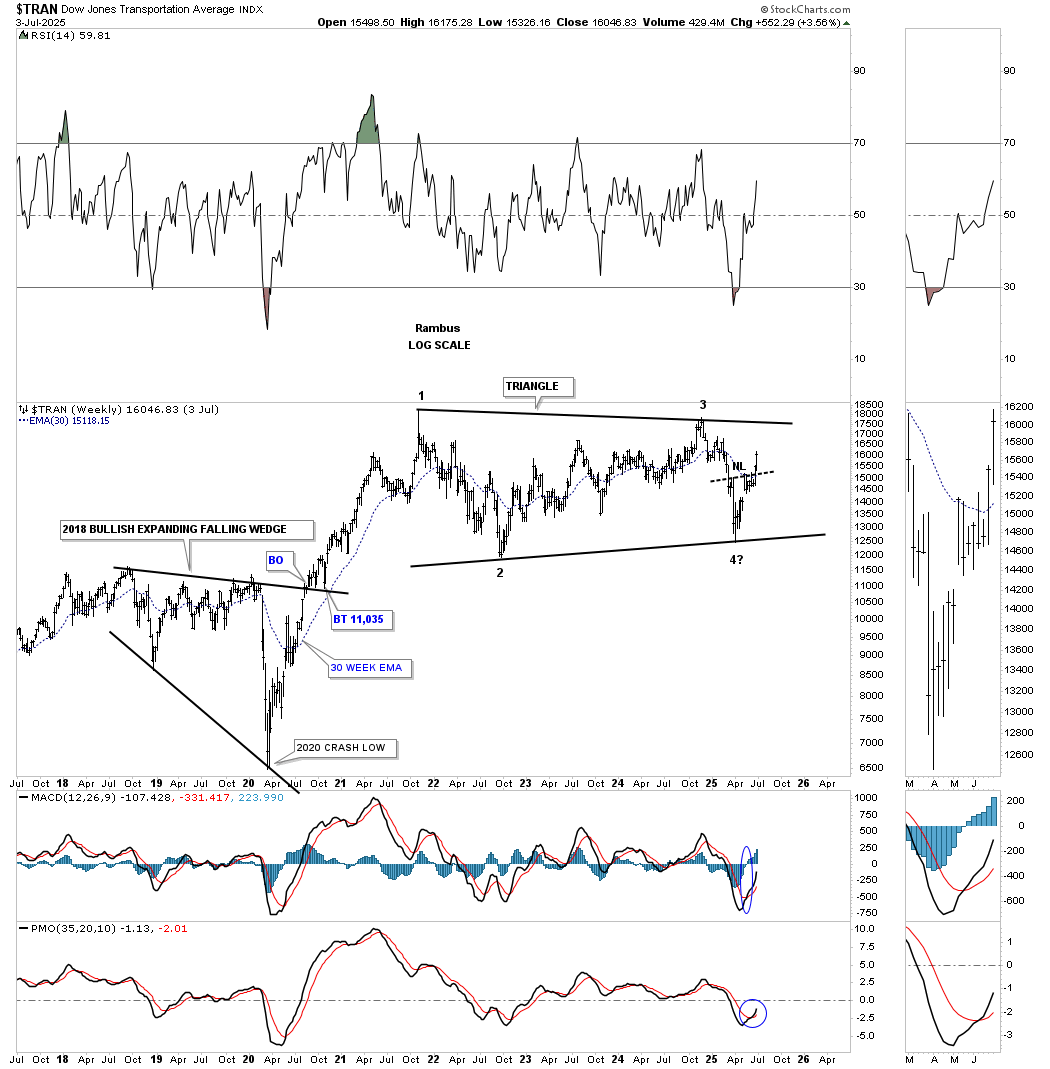
Next, let’s look at the Transportation Average, which is essential for the US stock markets to sustain a bull market. The daily combo chart shows the Transportation Average on top with the INDU below. Notably, both charts look similar, with the INDU showing more strength than the Transportation Average. However, since they’re both set up similarly, it wouldn’t be surprising if the Transportation Average outperforms the INDU in the coming months.
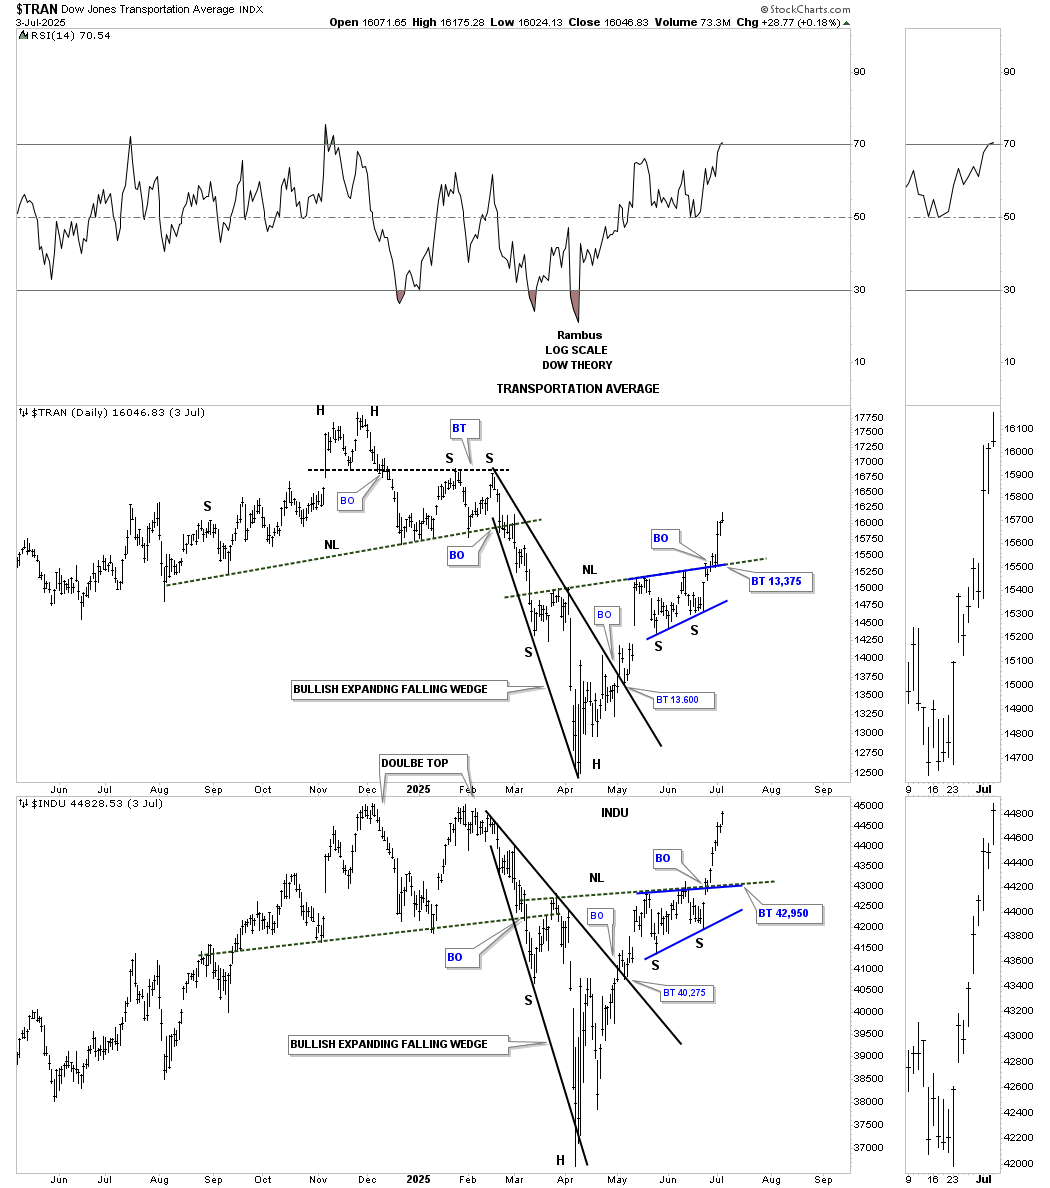
From the 2014 high to the 2020 crash low, the Transportation Average formed a bullish expanding falling wedge, which led to the first reversal point in its 2021 triangle consolidation pattern. With the recent breakout from the small inverse H&S bottom at the 4th reversal point, we should expect to see the Transportation Average reach the top rail of the 2021 triangle at a minimum. The triangle is likely a halfway pattern, measured from the 2020 crash low to the first reversal point high added to the 4th reversal point low to get a price objective.
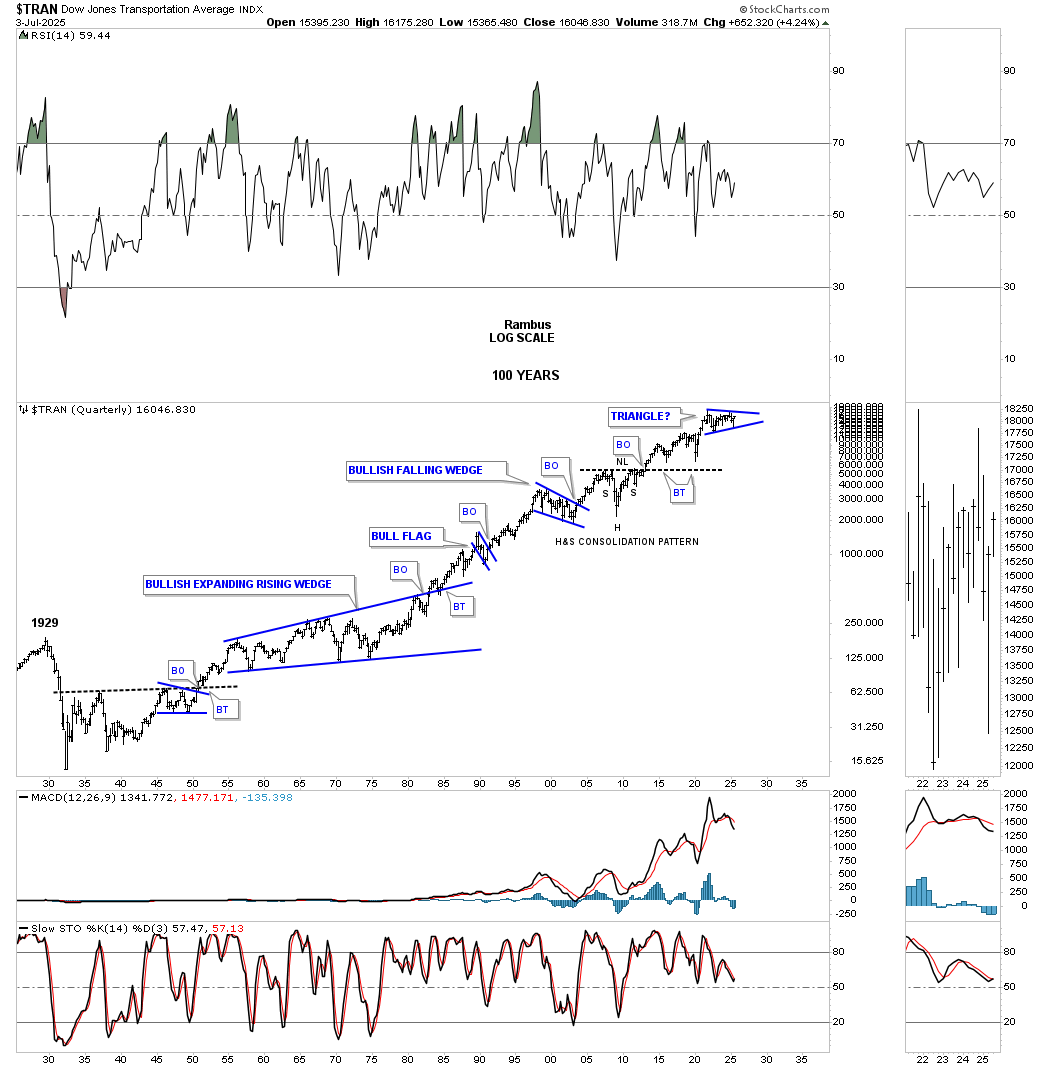
To put that 2021 black triangle into perspective, below is a 100-year quarterly chart for the Transportation Average, showing how the triangle on the weekly chart above fits into the big picture as just the next consolidation pattern in the 100-year bull market.
What’s really fascinating about this 100-year chart is the series of higher highs and higher lows made over the past 100 years of trading. There is a small blue flag and a small bullish falling wedge that formed a slightly lower high and lower low, but that was about it.
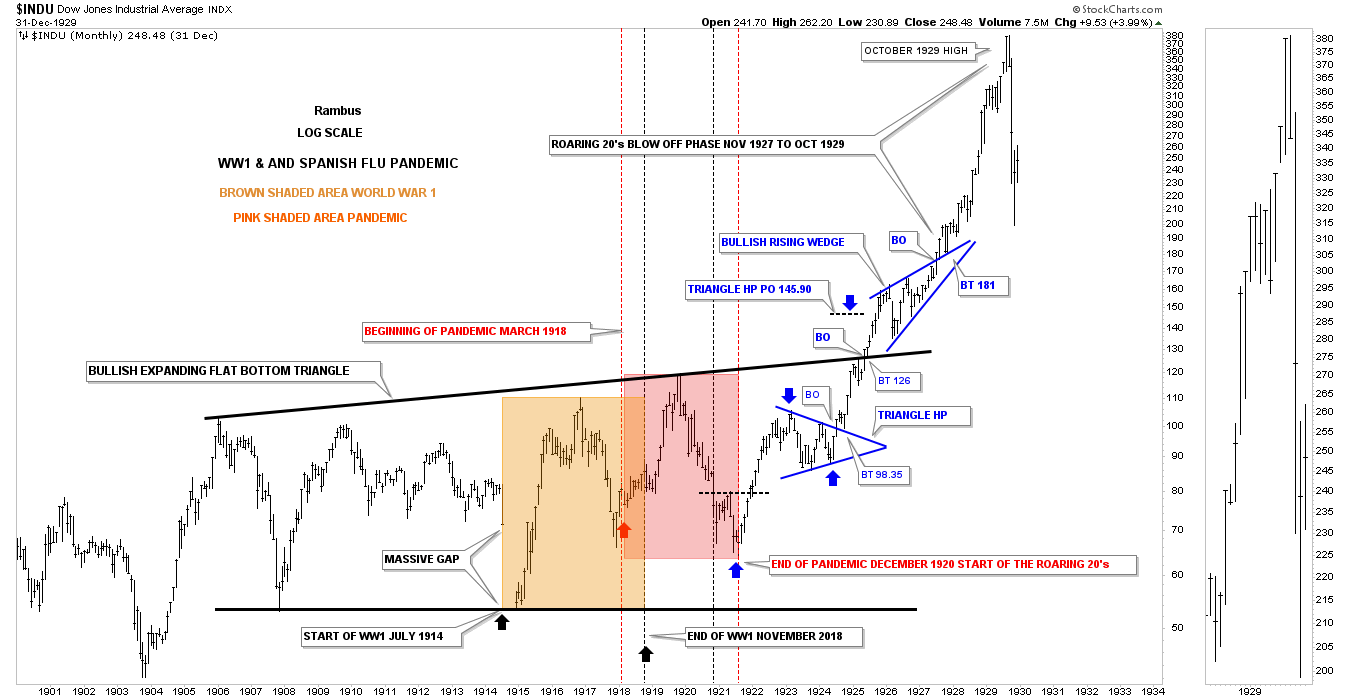
These next set of charts I originally built shortly after the 2020 pandemic crash low was made. I made these charts after I studied the 1918 Spanish Flu pandemic to see if we would see any comparisons to the 2020 Covid-19 pandemic. It was uncanny how similar these two pandemics were. In 1918, people were trying all kinds of ways to keep from getting the flu, similar to the 2020 scenario. Some cities mandated that you wear a mask, and other cities said you didn’t have to.
Inflation went through the roof in 1918, similar to the 2020 episode, as people were afraid to go outside and go to work, so everything became scarce and hard to find, driving up inflation.
What I found to be even more intriguing is what took place after the 1918 pandemic came to an end, which is paralleling today’s stock markets.
This first chart for the INDU starts back in 1901 and ends shortly after the 1929 bull market top. If you want to see Psychological Warfare, take a good hard look at this chart below. People were freaking out during the 2020 pandemic, blaming each other for wearing a mask or not wearing a mask, getting a flu shot or not getting a flu shot, and countless other small things that pitted people against each other.
Could you imagine if we were in the middle of World War III in 2020 during the pandemic? We got off easy and didn’t even know it. The brown shaded area shows the years World War I was taking place, and the pink shaded area shows when the 1918 pandemic occurred, with an overlap of about a year in 1918/1919. I can only imagine what those people were going through back then.
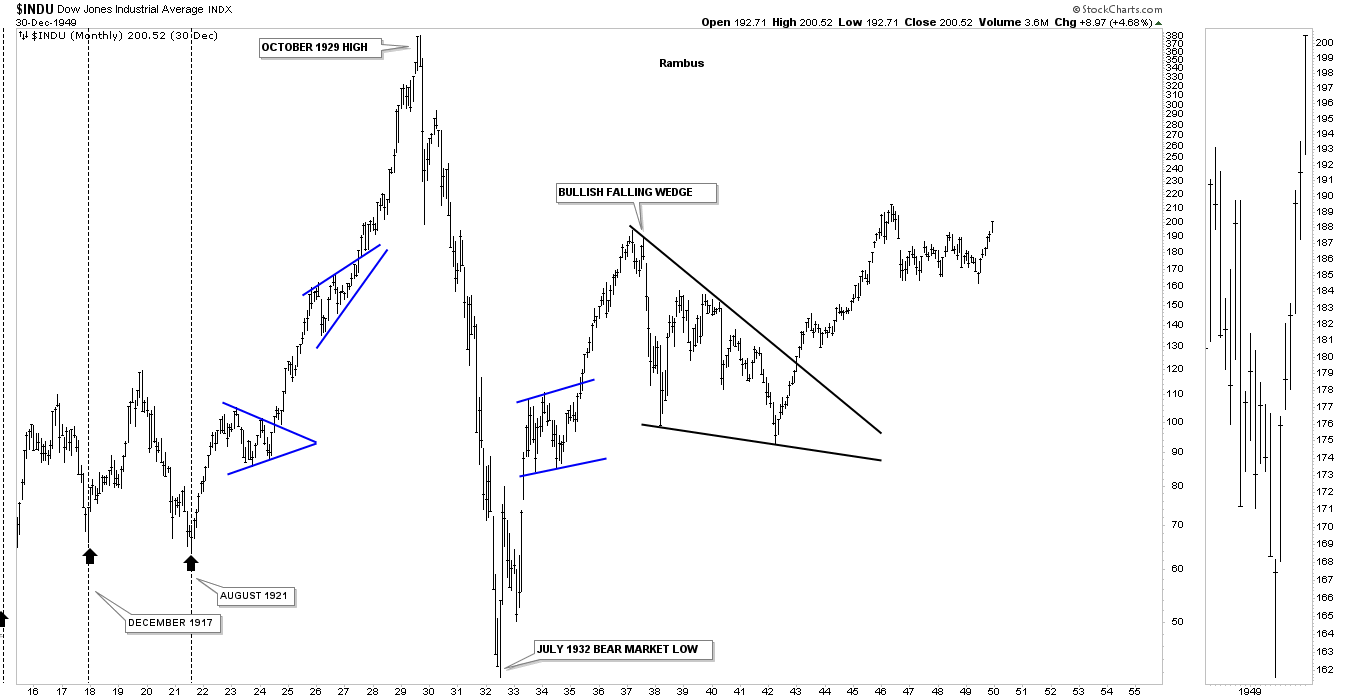
But as night turned into day, the end came for both the 1918 pandemic and World War I in late 1918, leading to one of the most famous bull markets of all time, the “Roaring 20s.” After all that pain and suffering endured by so many during those fateful years, the human spirit kicked in, and a decade of innovations and good times followed. By contrast, we are only in year five since the 2020 pandemic crushed everyone’s spirits. Are we witnessing something similar to the Roaring Twenties one hundred years later, beginning in 2020?
This weekly chart shows the Roaring Twenties, starting from around 1924, with two bullish rising blue consolidation patterns. The last consolidation pattern is an expanding triangle, which preceded the market’s crash after a the small H&S top formed.
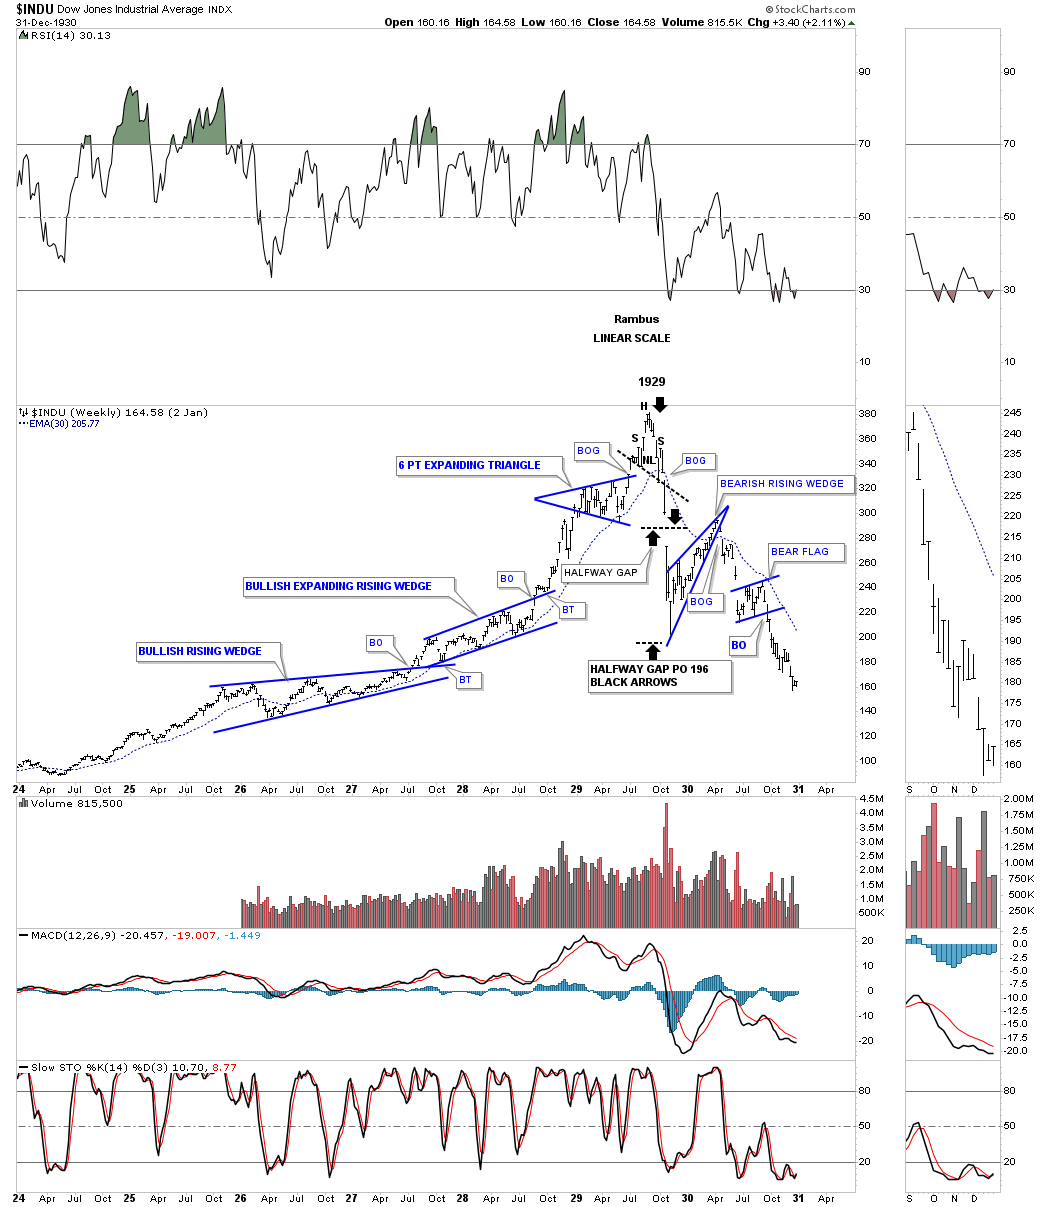
This chart shows the largest crash in US stock market history for the INDU. The fact that Chartology worked back then and seems to be working again highlights that human nature, and thus market behavior, tends to repeat itself over time.
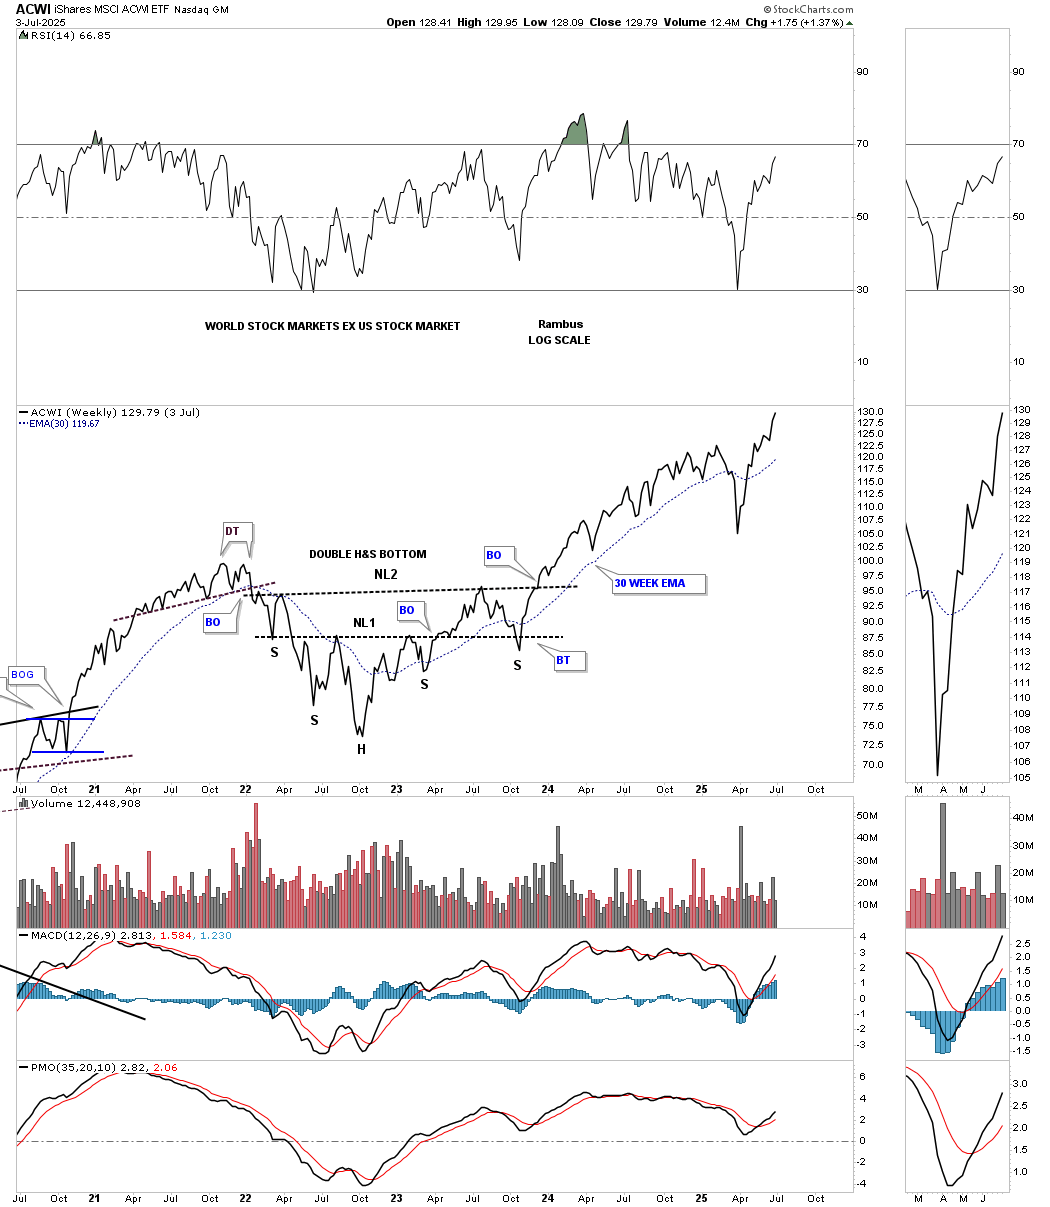
This next chart is a weekly look at the ACWI, world stock markets ex the US. It appears the rest of the world’s stock markets are not doing too badly, as this ETF is trading at a new all-time high.
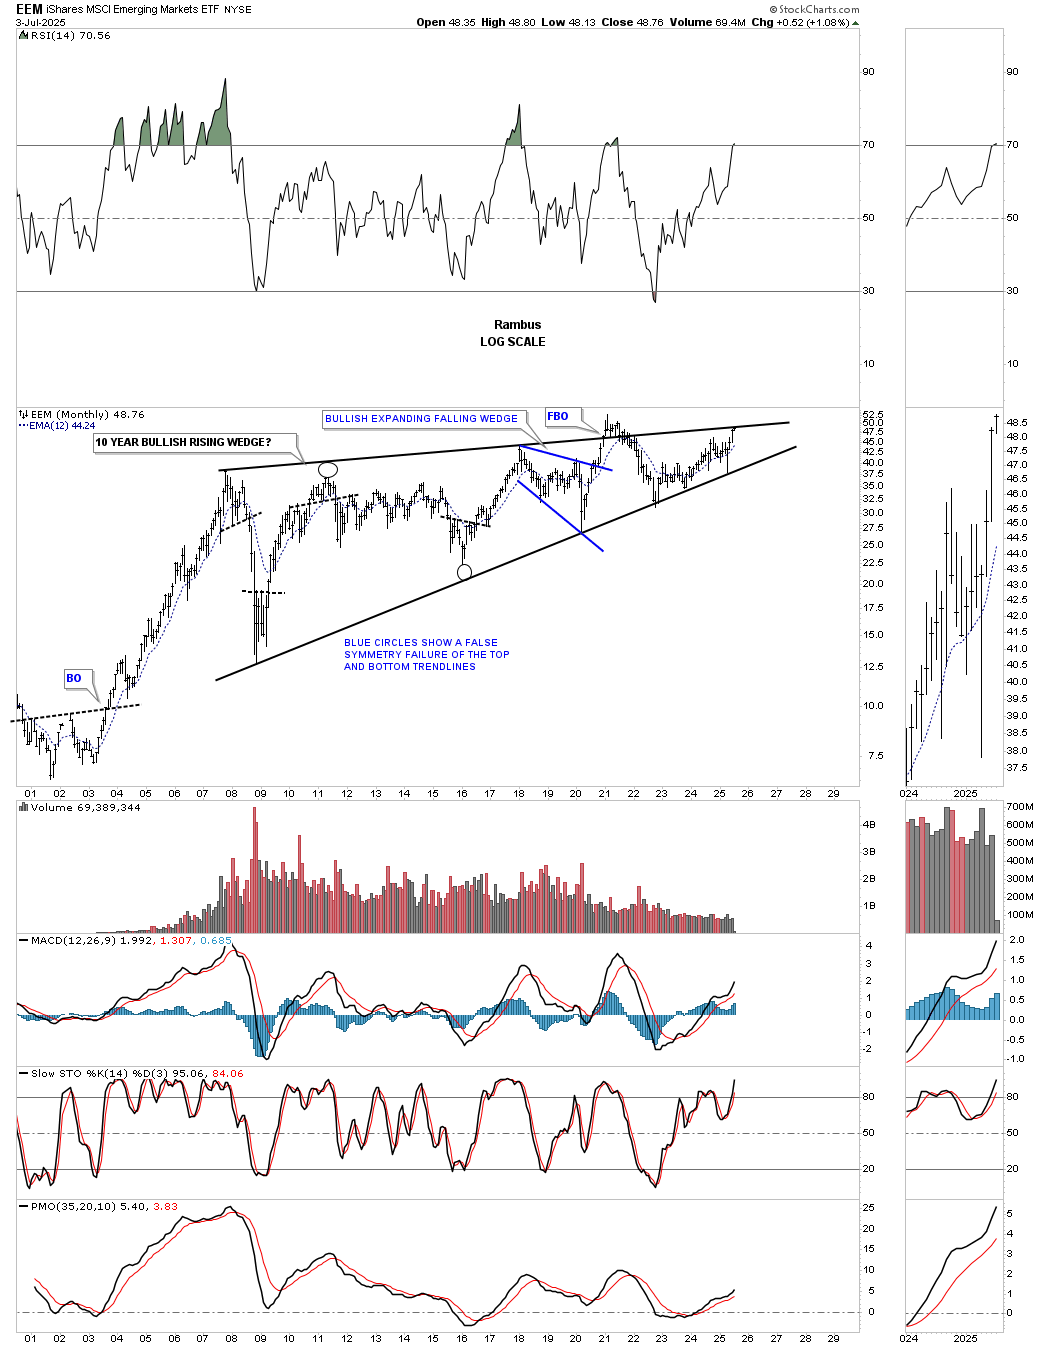
The EEM, an Emerging Markets ETF, is once again testing the top rail of its 2007 rising wedge, getting closer to making new all-time highs.
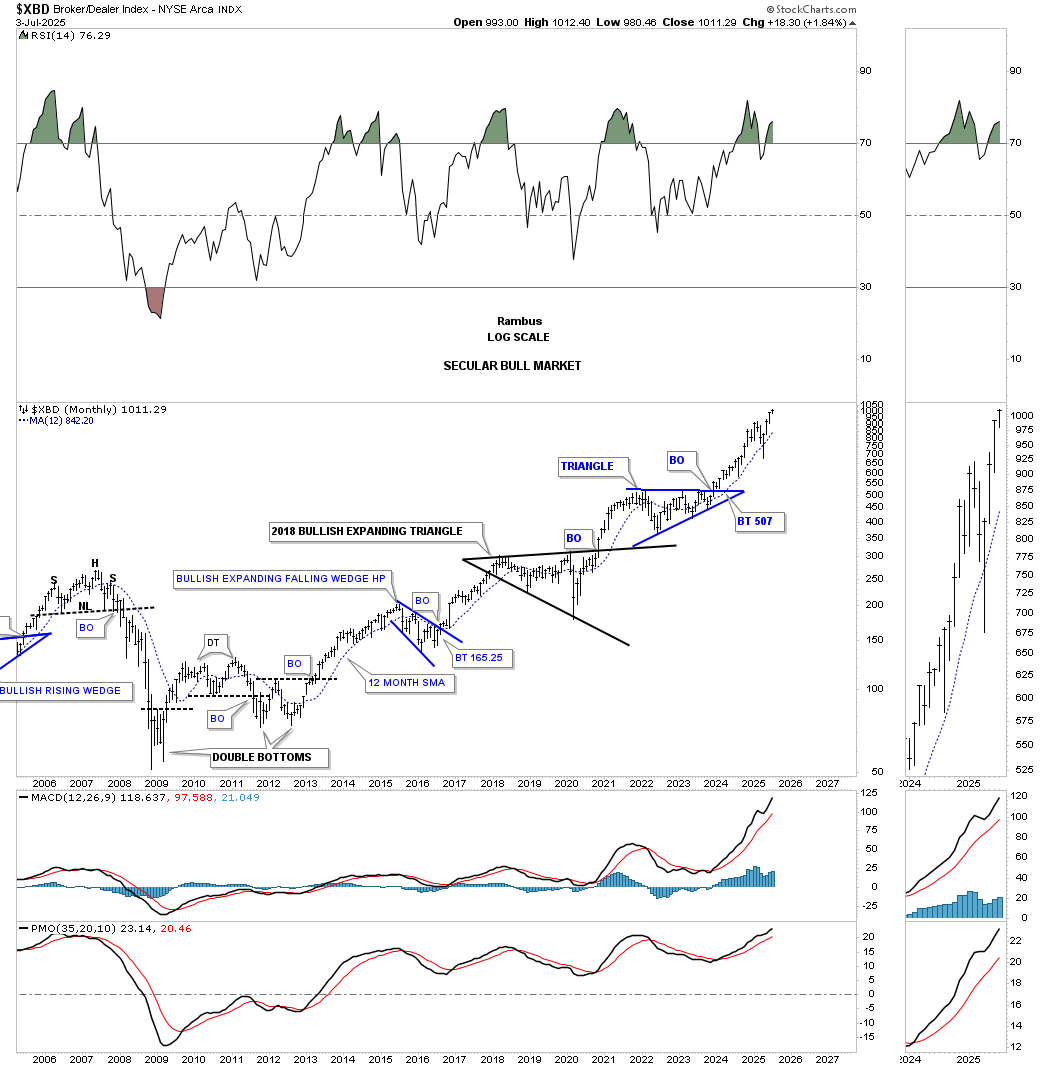
If the US stock markets are entering a potential melt-up phase or just another leg up in its 2009 secular bull market, then we should see many sectors doing well also. In the financial area, the XBD, Brokers and Dealers Index, is trading at a new all-time high.
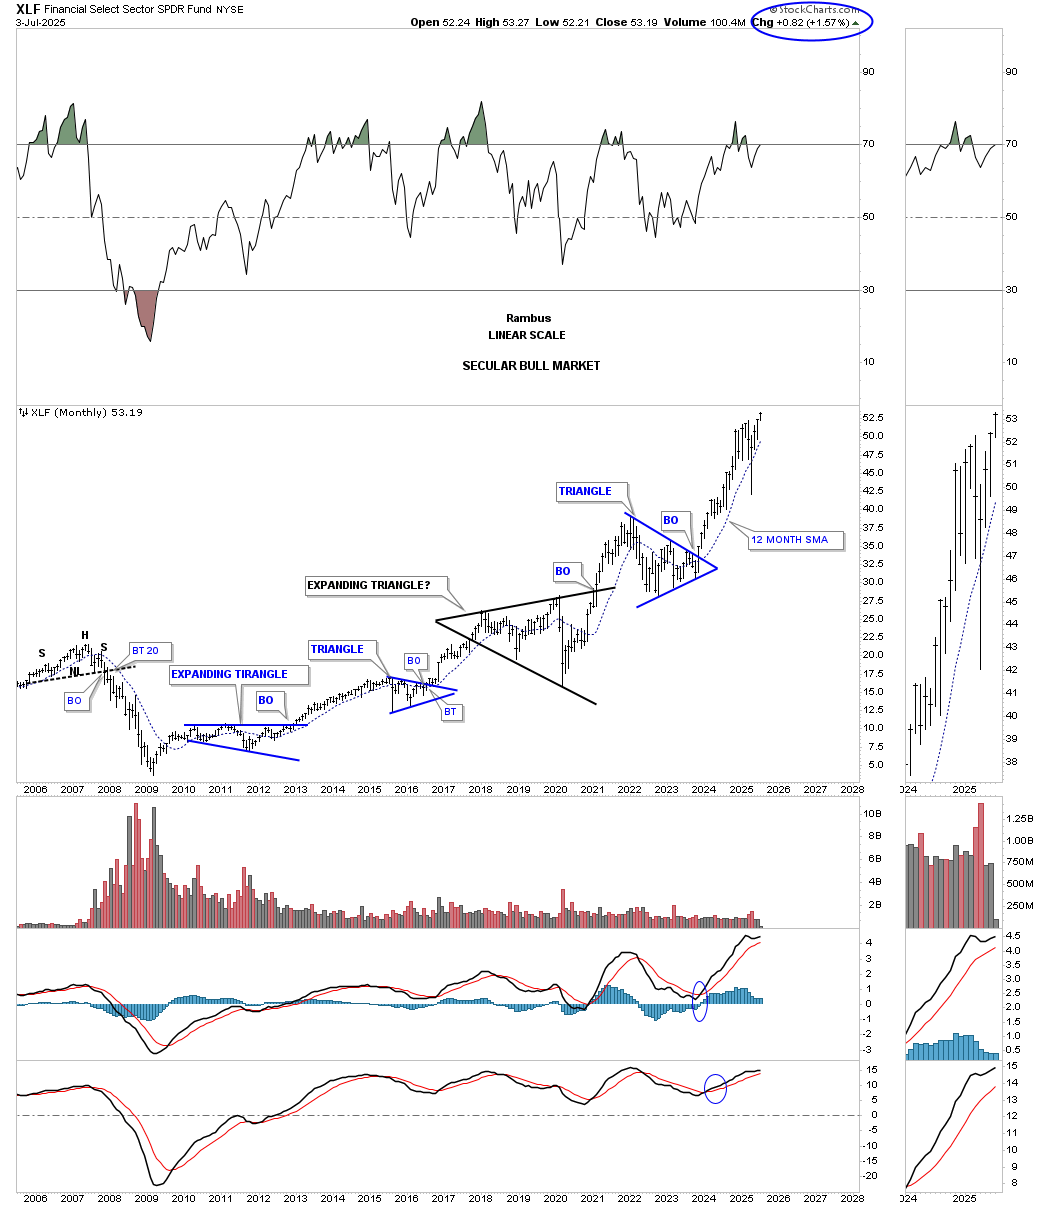
The XLF, Financial Fund is also trading at a new all time high since its 2009 bear market low.
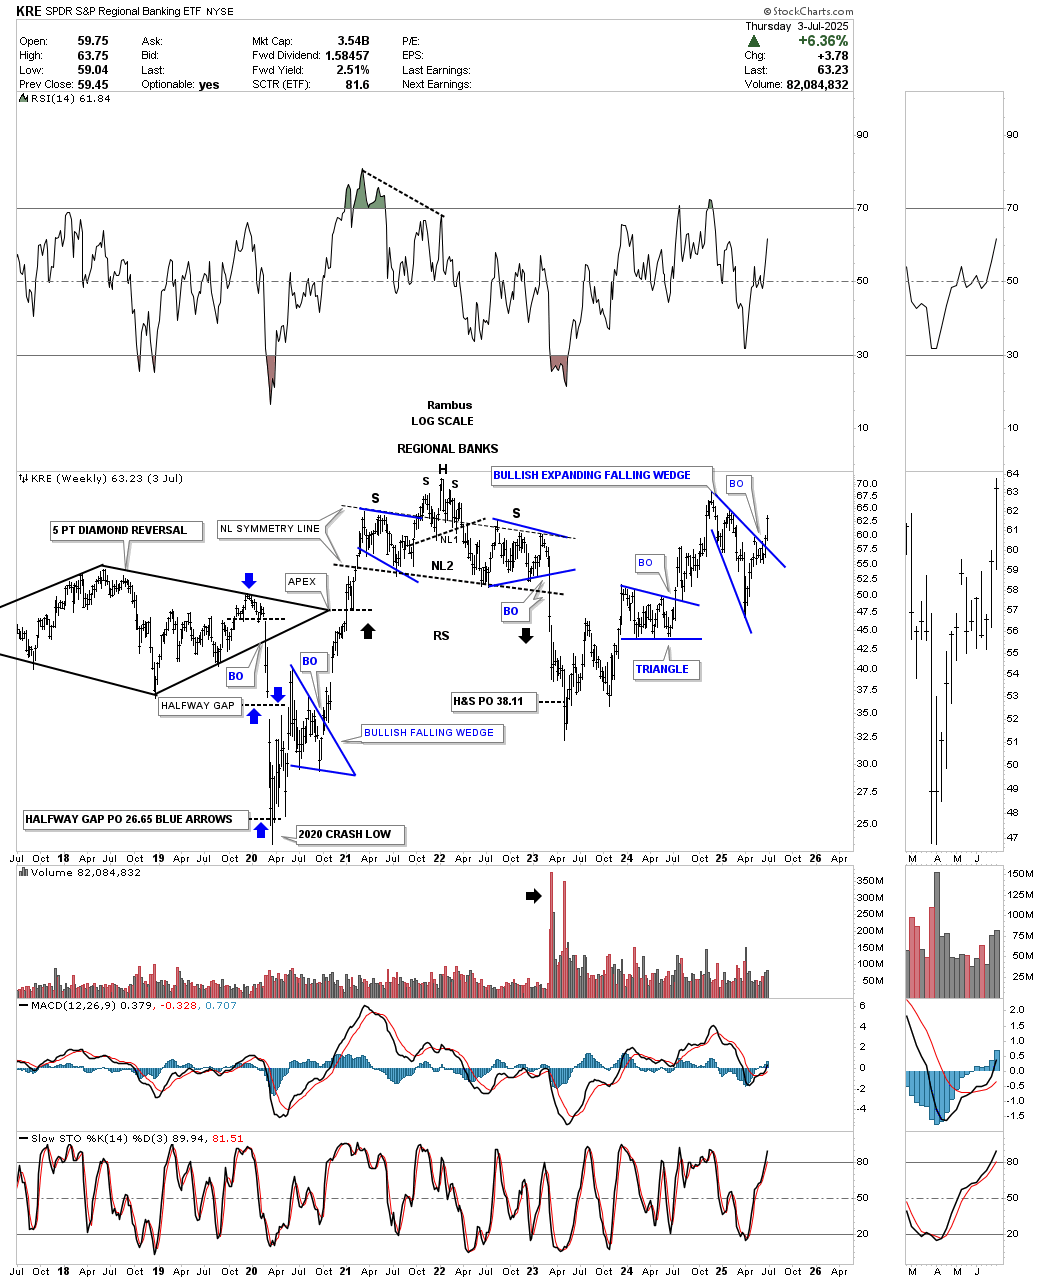
The KRE, Regional Bank ETF, was a key factor in the 2022/2023 correction, but it has just broken out from a bullish expanding falling wedge, which should support a move to new all-time highs.
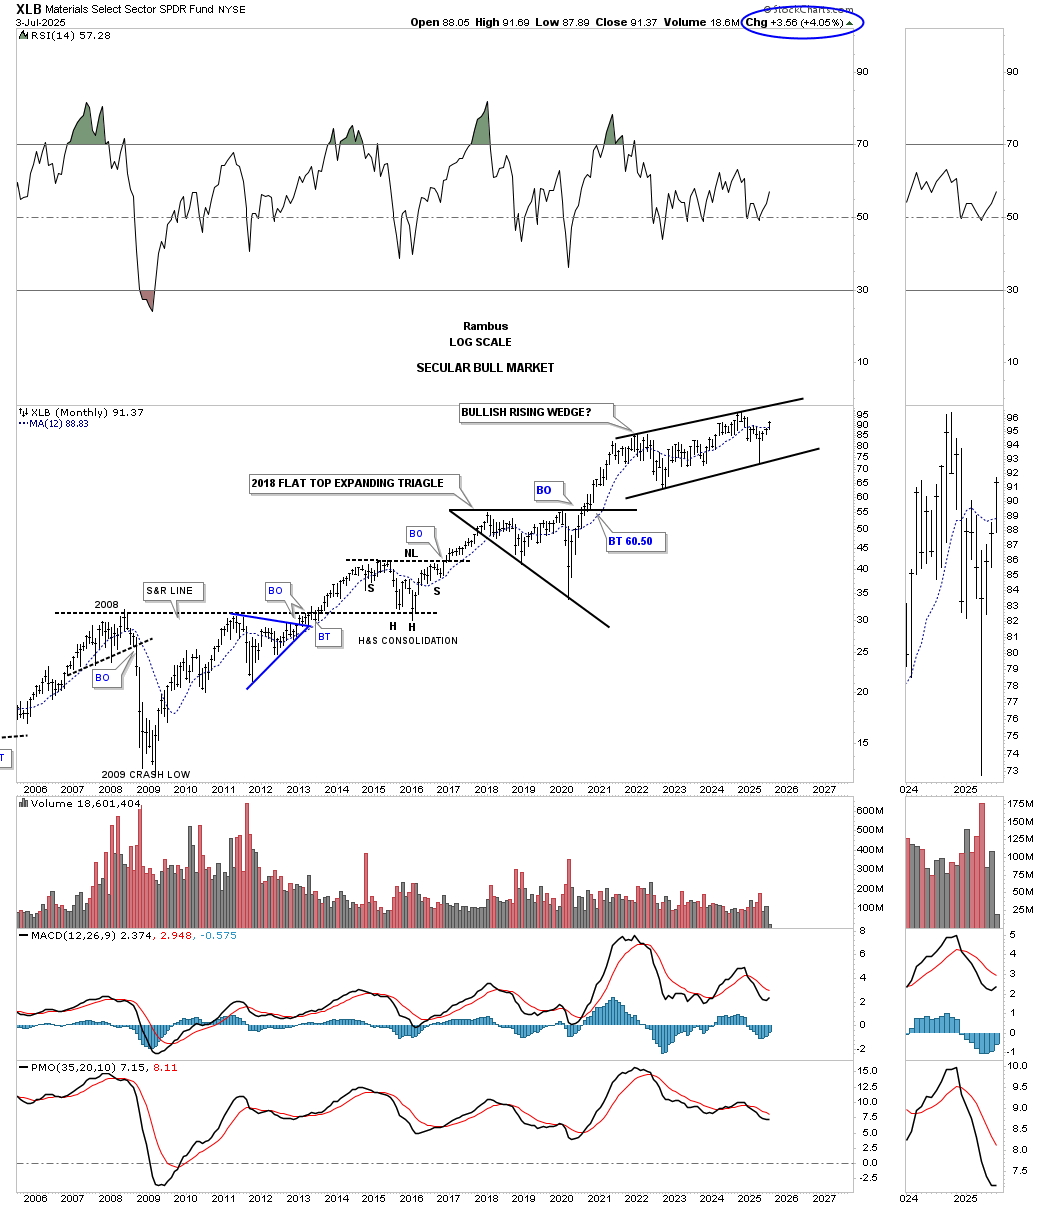
The XLB, Materials sector ETF, has been forming a bullish rising wedge since its 2021 high and is starting to get close again to its all-time highs.
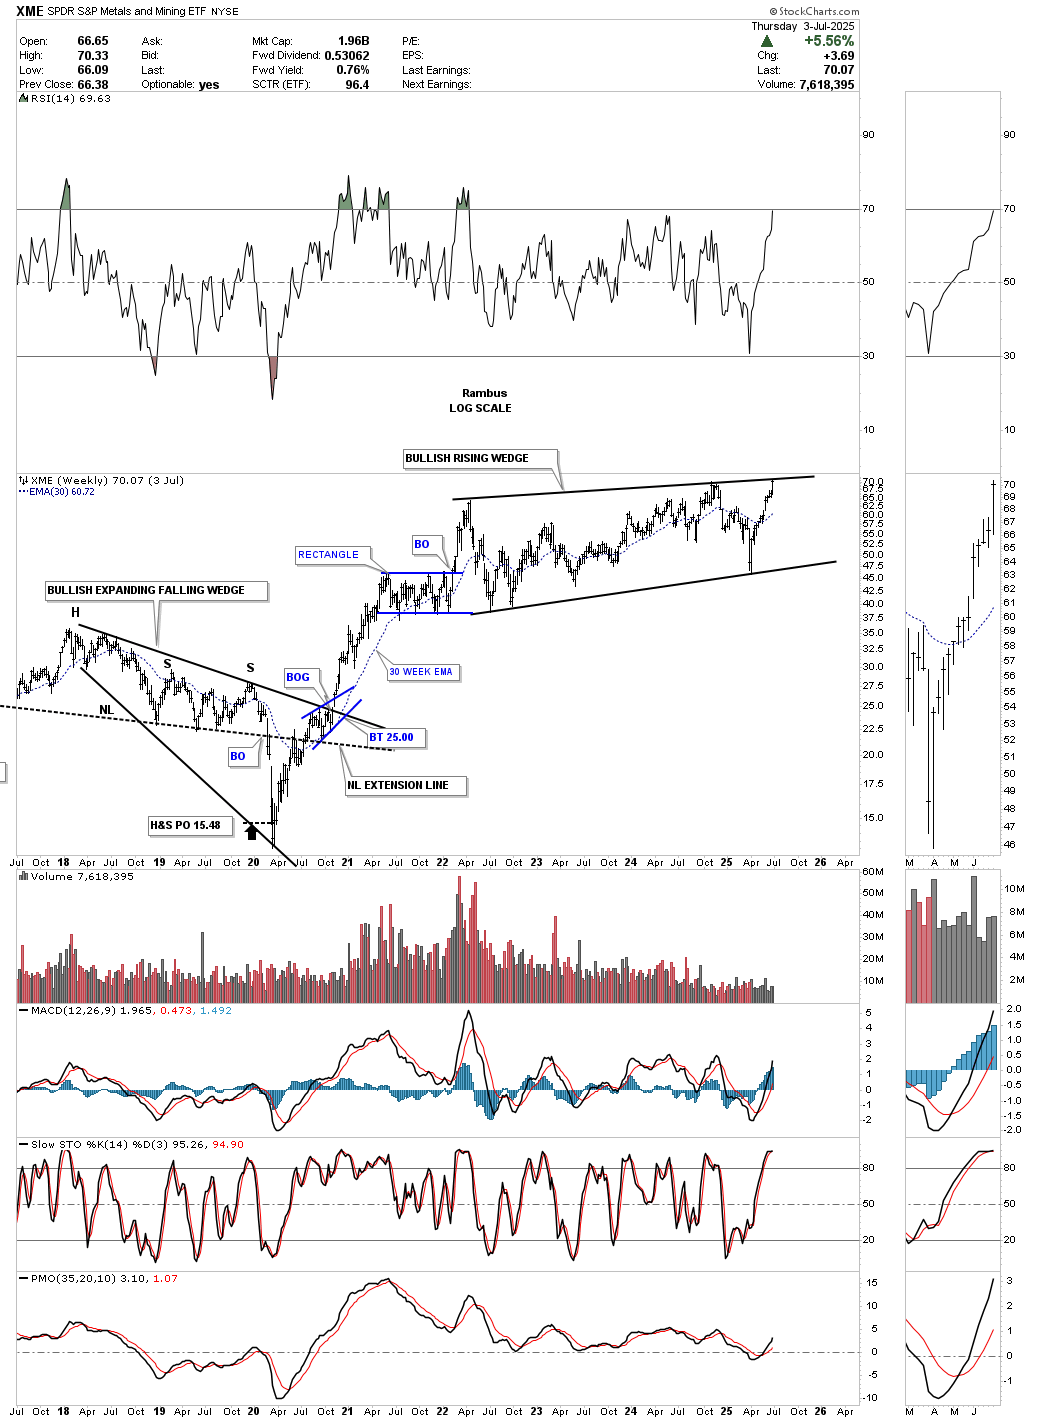
The XME, Metals and Mining ETF, is currently testing the top rail of the black bullish rising wedge on its long-term weekly chart. Notably, the ETF formed a bullish expanding falling wedge from 2016 to the 2020 pandemic low, which preceded a two-year rally high into the December 2021 high.
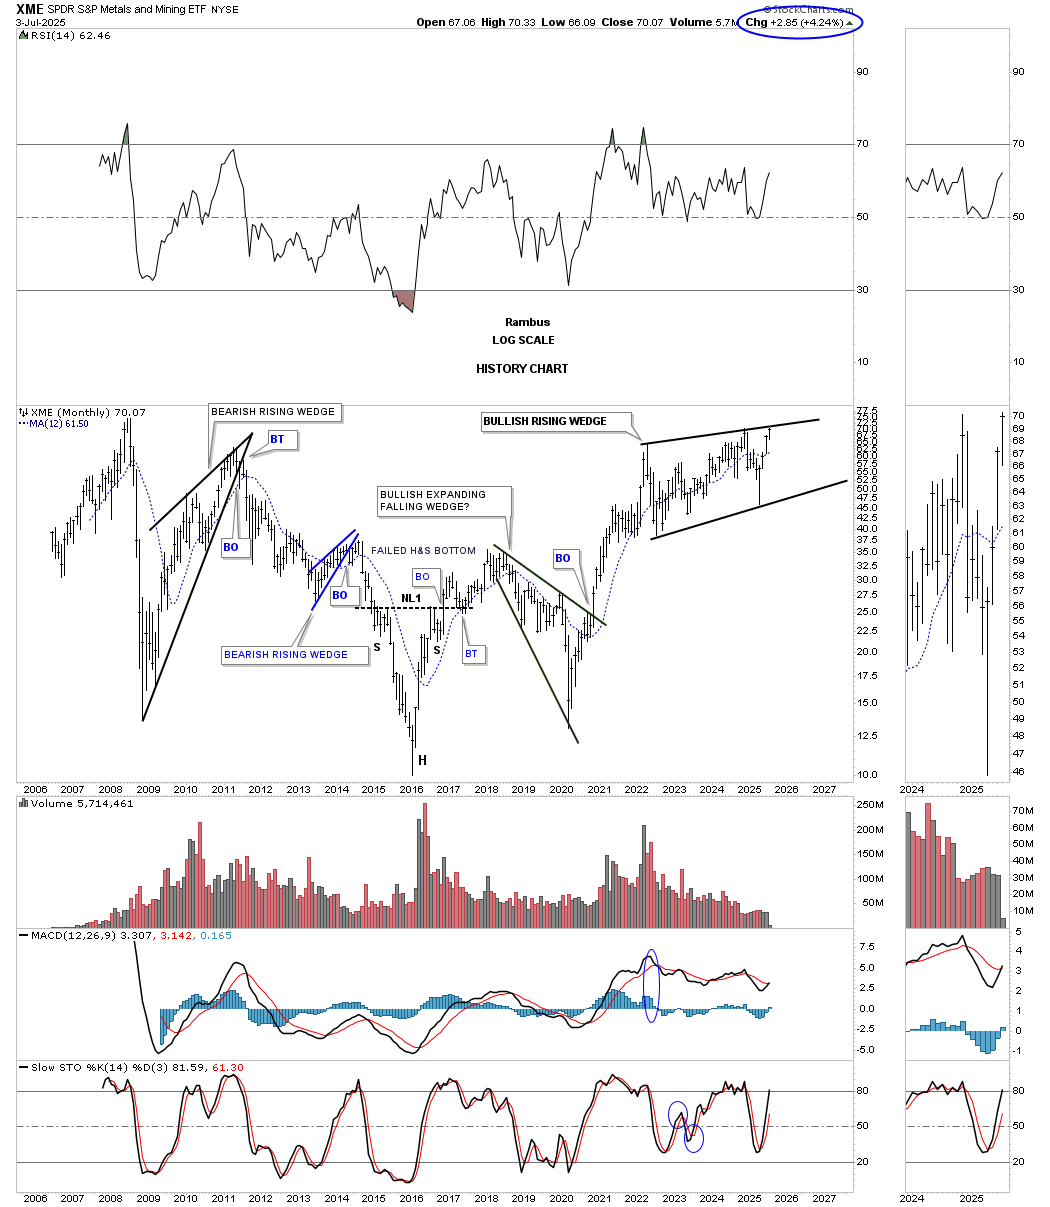
The monthly history chart for the XME.
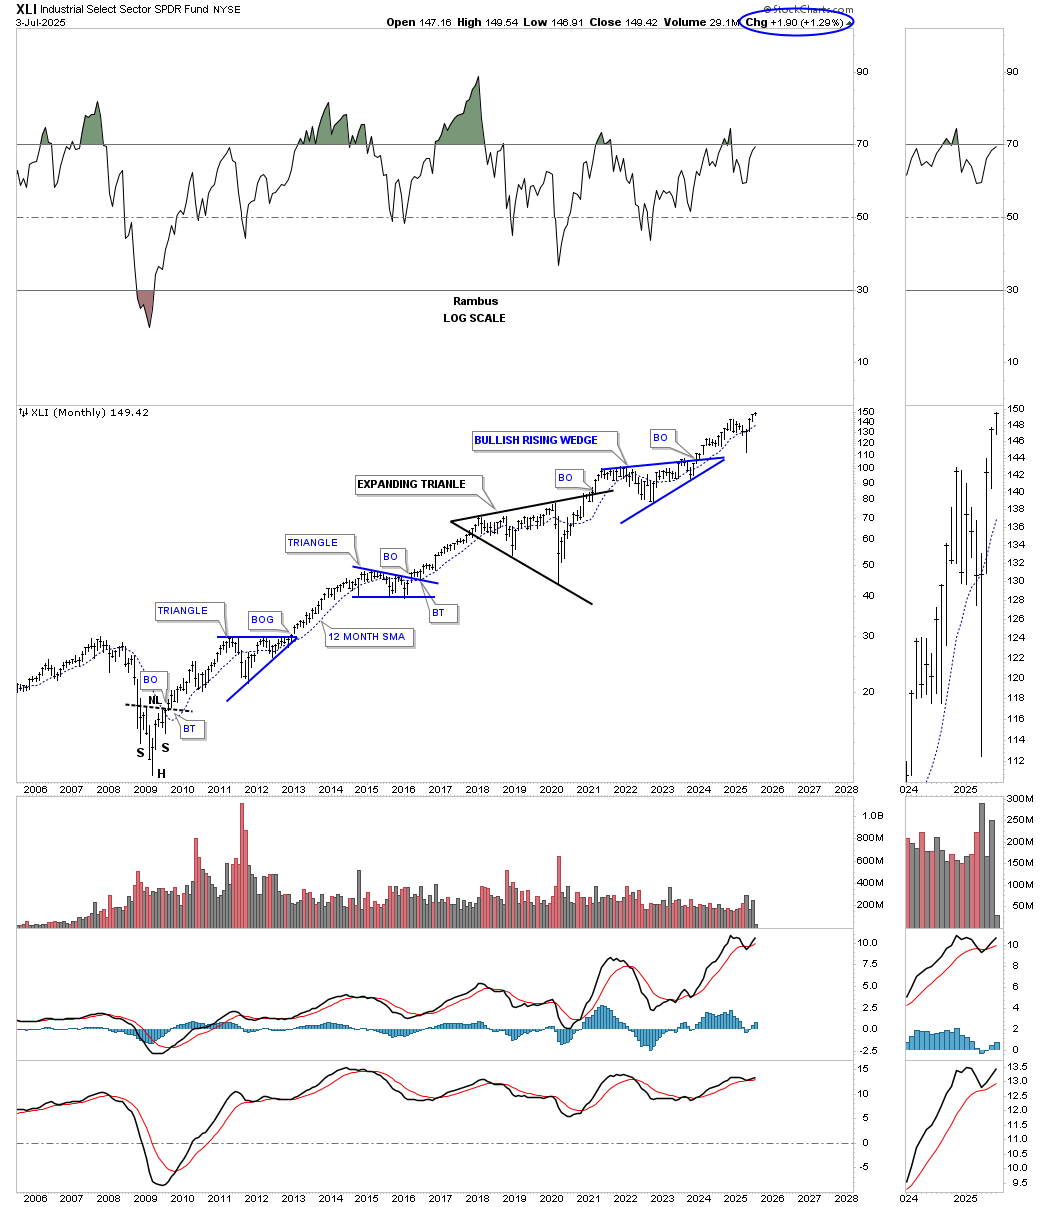
The XLI, Industrial Sector ETF, is indeed making a new all-time high, which is a key indicator of a healthy bull market, as industrials play a significant role in the overall economy.
If it’s risk on then BTCUSD should enjoy a strong bull run.
The right shoulder in the head-and-shoulders pattern appears slightly unbalanced, but a smaller right shoulder can sometimes indicate a rapid move higher. Volume has decreased significantly, which may be worth monitoring for further insights.
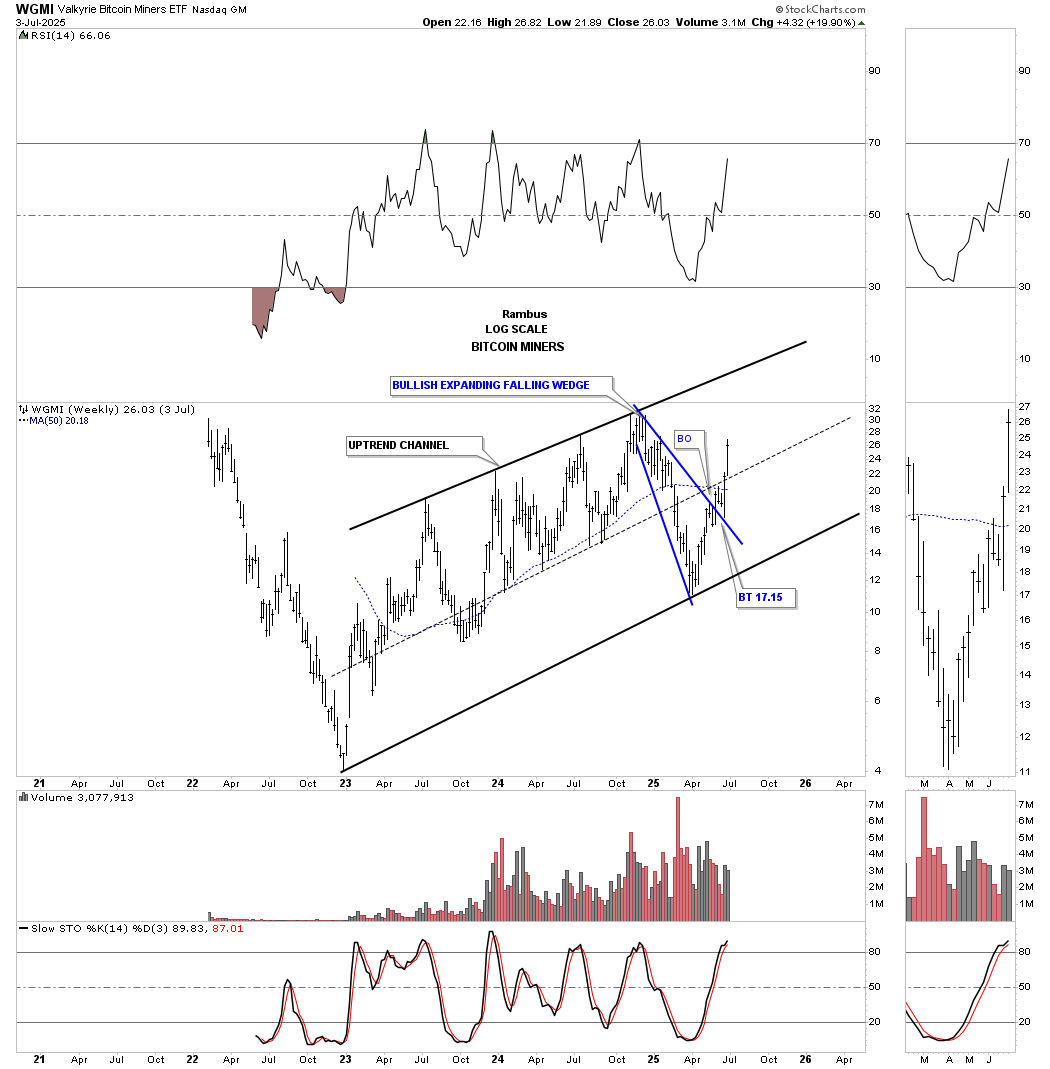
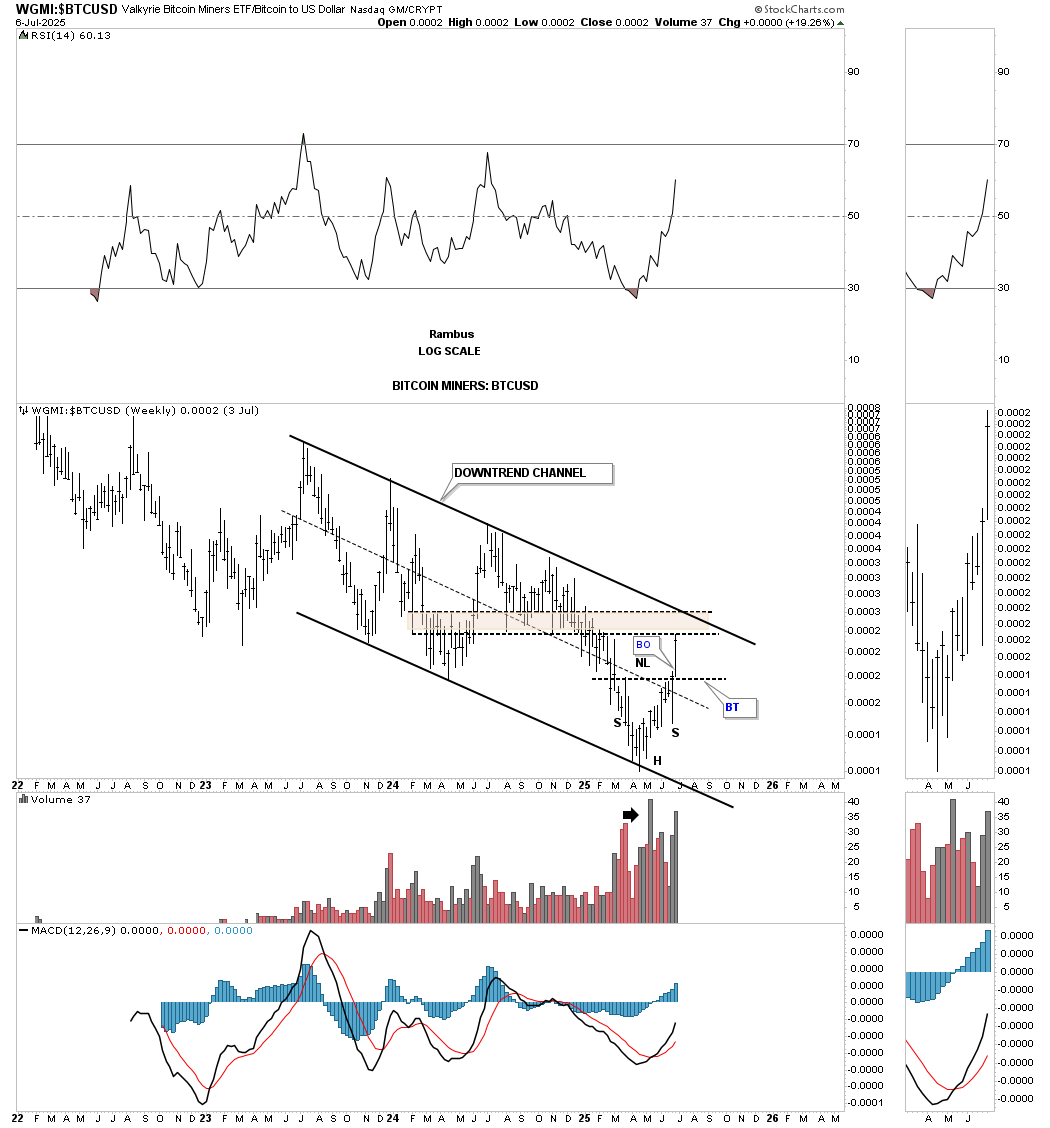
After a hard beat down, the WGMI, BITUSD Miners ETF, is coming back to life after breaking out and backtesting the top rail of the blue bullish expanding falling wedge.
This weekly ratio chart compares the WGMI:BTCUSD ,which has just recently broken out from an inverse H&S bottom after underperforming BTCUSD for much of its history.
This last chart for tonight is the old, “HISTORY CHART FOR THE END OF THE WORLD,” which I may post once a year or so depending on market conditions. This history chart for the COMPQ is a satirical look at all the important lows which felt like the end of the world if you were trading in real time when they occurred.
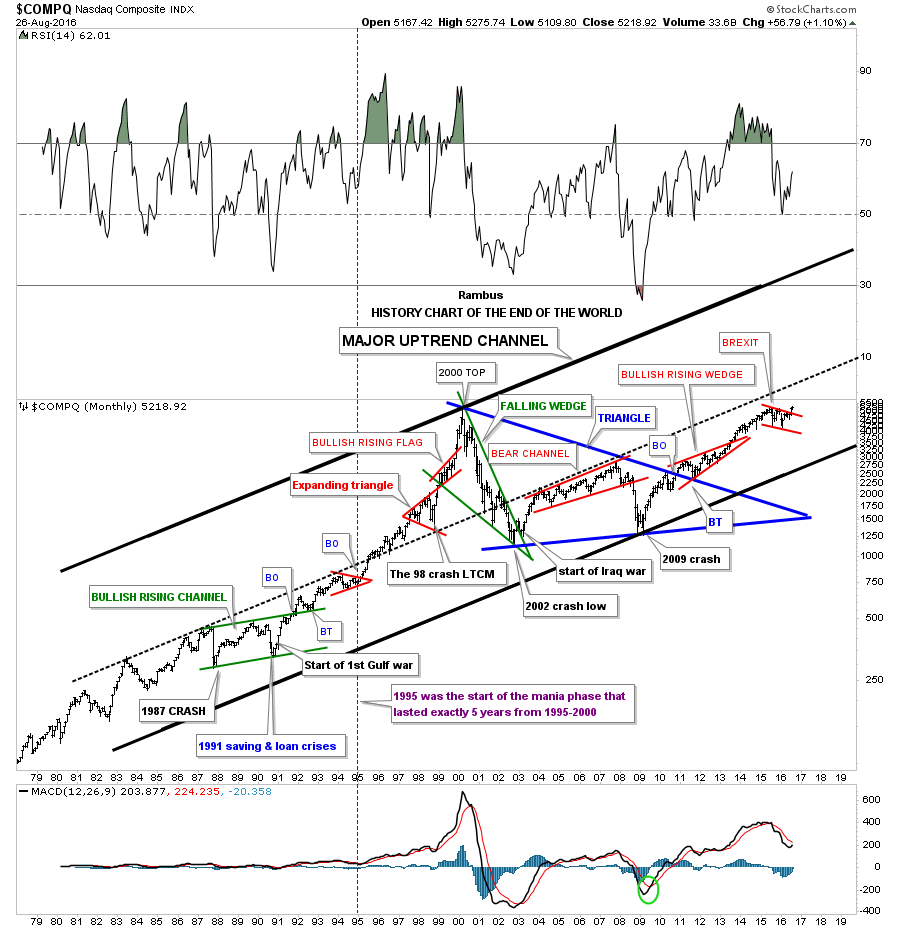
This is the, “HISTORY CHART FOR THE END OF THE WORLD,” as it looked back in August of 2016 with BREXIT being the main topic of the day.
Snippet from August 2016:
The last consolidation pattern on this chart is the red bull flag which I labeled as the BREXIT pattern. This little shakeout was very mild compared to some from the past. Maybe this little red bull flag is going to finally be the pattern that is going to end the world as we know it, but from a Chartology perspective it looks just like another consolidation pattern in the ongoing major bull market uptrend channel.
Maybe I’m being too optimistic but I don’t see the end of the world coming anytime soon, but just the opposite. I believe we’re entering into a new period of human ingenuity where technology is going to change the way we live from biotechnology, green energy, robotics, nano technology, artificial intelligence, super computers that will make today’s computers look like slide rulers from the past, space travel and exploration, and a host of other things that the best science fiction writers haven’t even thought of yet.
It was this post back in 2020 on election day when I added the presidential cycles to the History Chart for the End of the World.
This is what I wrote back then on November 3, 2020:
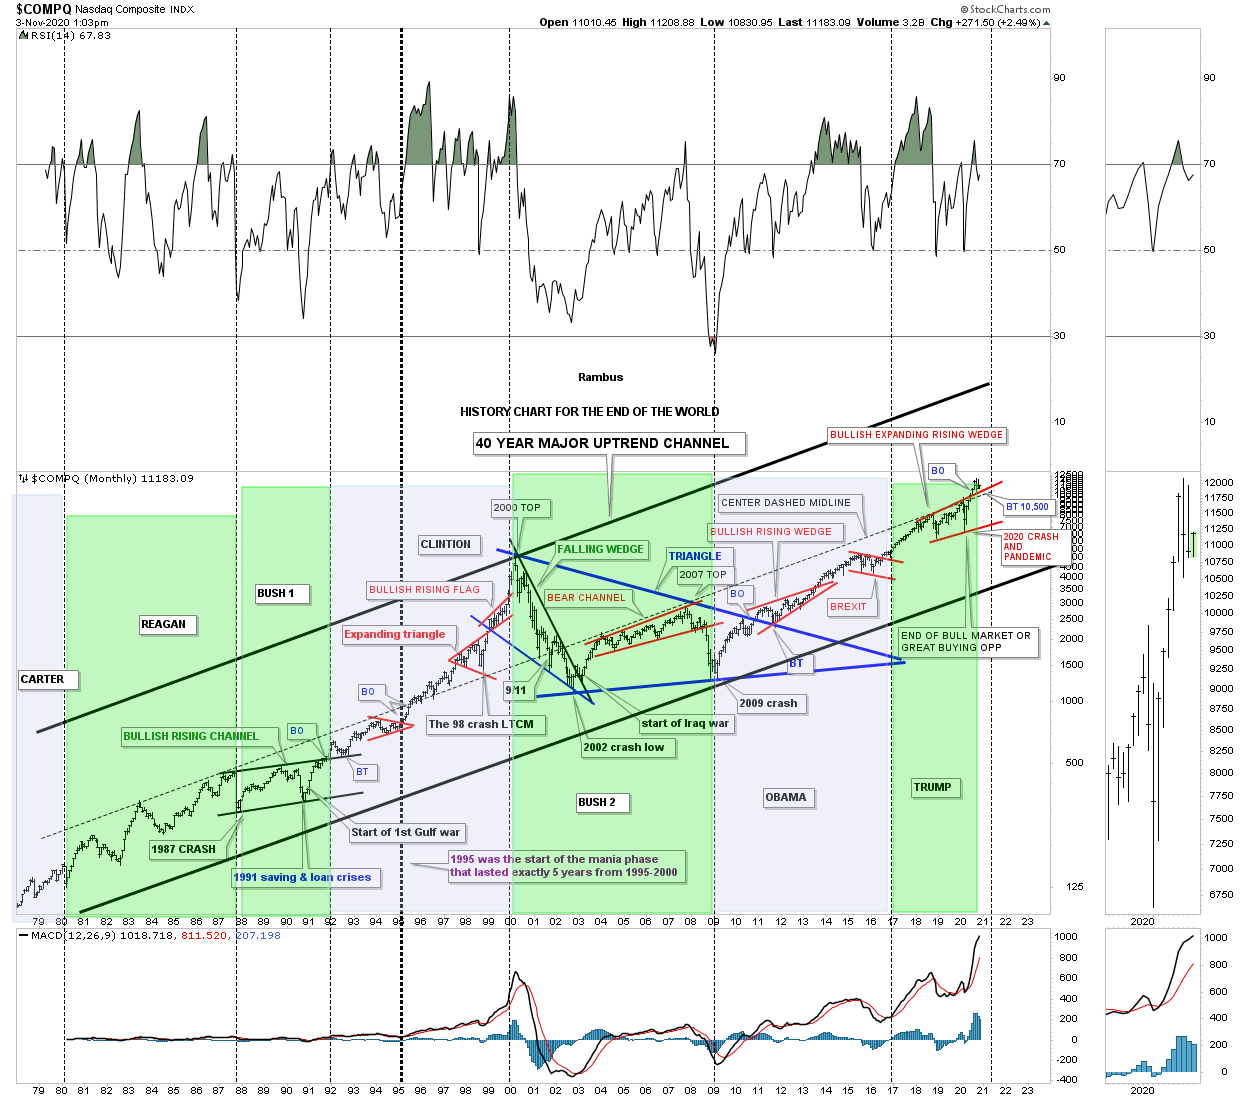
For those that have been with Rambus Chartology for a while know about this long-term monthly chart that goes all the way back to the late 1970s which I call, The End of the World History Chart. It is a satirical look at all the important lows that felt like the end of the world if you were trading in real time back then. Every time there is an end-of-the-world type of event I just add it to the chart to see what happens. The 2020 crash was the latest end-of-the-world event in which I stated, “end of the bull market or a great buying opportunity,” shortly after the low was in place.
The center dashed midline has been holding resistance for the last 20 years or so. I can’t tell you how long I’ve been waiting for the breakout above that 20-year center dashed midline which I believe could lead to a rally up to the top rail of the major uptrend channel similar to what we saw back in 1995. When the center dashed midline gave way back in 1995 that was the beginning of the parabolic rise into the 2000 secular bull market top which took five years to complete. It is simple: above the center dashed midline is bullish and below is bearish; everything else is noise.
I recently added the presidential cycles to this chart so you can see how the COMPQ responded to a Republican or Democratic president. I won’t go into detail as it is pretty self-explanatory. The green shaded areas show what the market did when a Republican was in office and the pink shaded areas show what the stock market did during a Democratic president.
I’m going on record right now with my prediction on what the stock market is going to do if a Republican or Democrat is elected. One year from today the stock market is going to be higher whether a Republican or Democrat is elected. We are not going to see the end of the world or the end of our Democracy regardless of who is elected.
My cup has been and still is half full regardless of all the conspiracy theories that are so widespread right now which probably seems pretty naive to many of you. We are entering into a technological revolution that is just being born that is going to change the world in ways we can’t even imagine yet, whether we like it or not. I’ve touched on it a time or two in the past and nothing has changed my outlook on what is about to take place over the next 5 to 10 years.
For those that want to fight the last battle and expect the world to come to an end, be my guest. I’m going to look to the future which is not going to be perfect by any stretch of the imagination, and welcome change which is the lifeblood of being a human being.
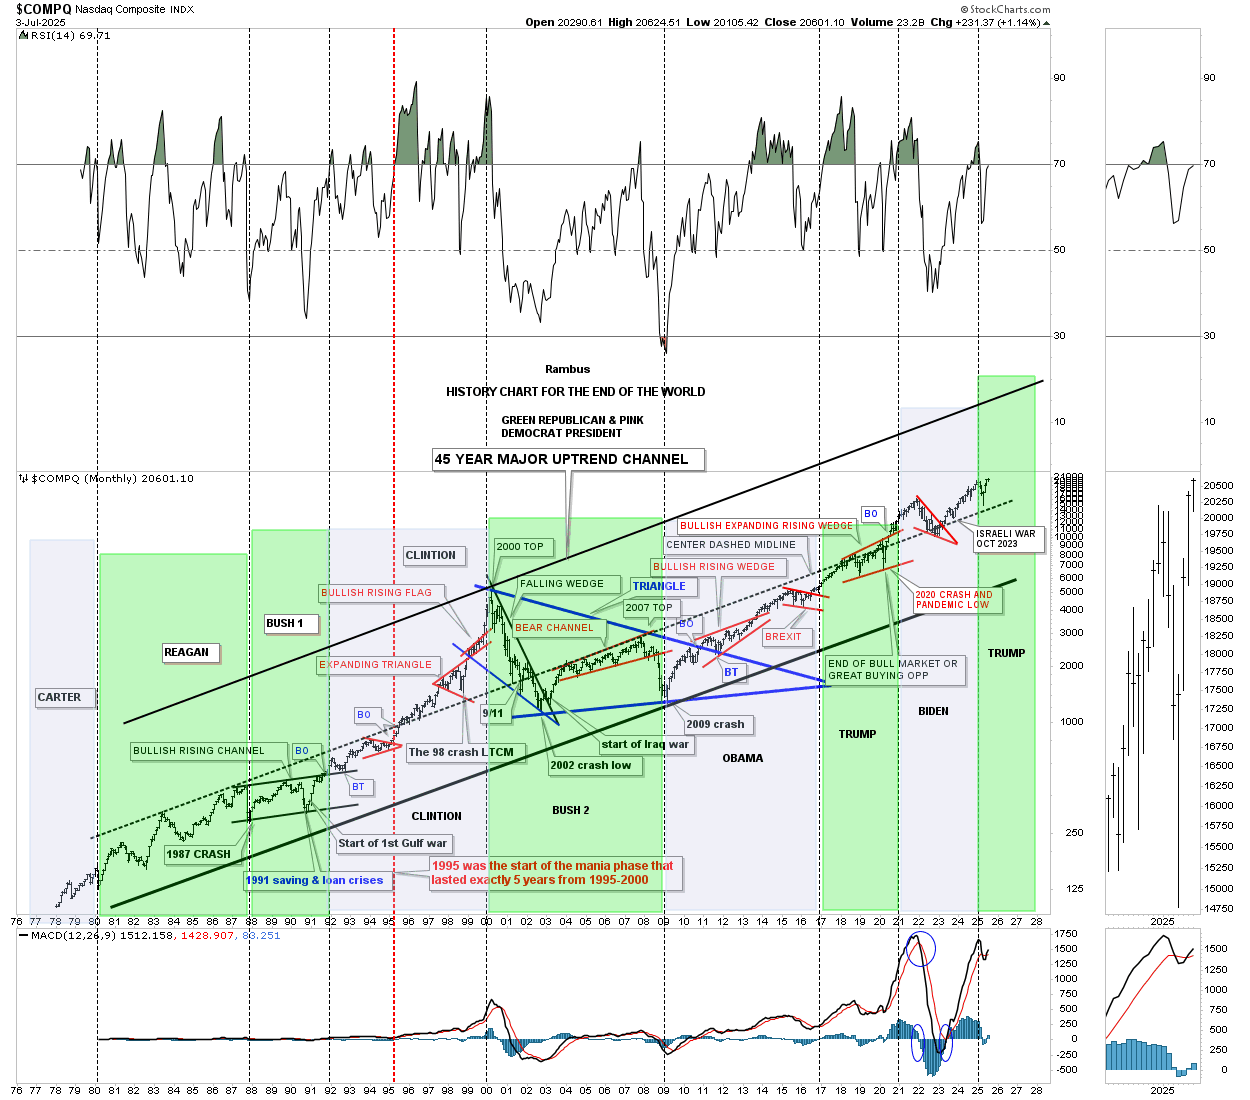
Today, July 6, 2025:
The COMPQ has just made another all-time high in the ongoing saga for the History Chart for the End of the World. I’ve pondered numerous times on whether we’ll ever see the top rail of this History chart. I’m out of annotations now, but the last entry was when Hamas attacked Israel and so far no end of the world yet.
Keep an open mind and all the best…Rambus.
Related Reading:
Rambus: Blockbuster Chartology – January, 2025
Rambus: Blockbuster Chartology – October, 2024
Rambus: Blockbuster Chartology – July, 2024
Rambus: Blockbuster Chartology – April, 2024
Rambus: Blockbuster Chartology – January, 2024
Rambus: Blockbuster Chartology – October, 2023
Rambus: Blockbuster Chartology – August, 2023
Rambus: Blockbuster Chartology – May, 2023
Rambus: Blockbuster Chartology – January, 2023
Rambus: Blockbuster Chartology – October, 2022
Rambus: Blockbuster Chartology – July, 2022
Rambus: Blockbuster Chartology – May, 2022
Rambus: Blockbuster Chartology – February, 2022
Rambus: Blockbuster Chartology – October, 2021
Rambus: Blockbuster Chartology – July, 2021
Rambus: Blockbuster Chartology – April, 2021
Rambus: Blockbuster Chartology – January, 2021
Rambus: Blockbuster Chartology – October, 2020
Rambus: Blockbuster Chartology – July, 2020
Rambus: Blockbuster Chartology – May, 2020
Rambus: Blockbuster Chartology – January, 2020
Rambus: Blockbuster Chartology – October, 2019
Rambus: Blockbuster Chartology – July, 2019
Rambus: Blockbuster Chartology – April, 2019
Rambus: Blockbuster Chartology – January, 2019
Rambus: Blockbuster Chartology – October, 2018
Rambus: Blockbuster Chartology – July, 2018
Rambus: Blockbuster Chartology – April, 2018
2017 Annual Wrap Up – Does Your Pension Fund Have A Deep State Drain? – January, 2018
1st Quarter Wrap Up 2018 Web Presentation
Blockbuster Chartology with Rambus – October, 2017
Blockbuster Chartology with Rambus – July, 2017
Blockbuster Chartology with Rambus – May, 2017
Blockbuster Chartology with Rambus – January, 2017
Blockbuster Chartology with Rambus – October 20, 2016
Blockbuster Chartology with Rambus – July 21, 2016
Blockbuster Chartology with Rambus – April 21, 2016
Rambus: Are We in a Deflationary Spiral? – January 28, 2016
The Dollar, Gold & the S&P 500 with Rambus – October 15, 2015
