

Mr Global in Your Street Rambus Blockbuster Chartology
Become a member: Subscribe



































NTS Headlines
Headlines by Category
Headlines by Year
- Money & Markets
- Weekly Solari Reports
- Cognitive Liberty
- Solari Builders
- Ask Catherine
- News Trends & Stories
- Equity Overview
- War For Bankocracy
- Digital Money, Digital Control
- State Leader Briefings
- Food
- Food for the Soul
- Future Science
- Health
- Metanoia
- Solutions
- Spiritual Science
- Wellness
- Building Wealth
- Via Europa














































Solari’s Building Wealth materials are organized to inspire and support your personal strategic and financial planning.




Building Wealth
This 6-pillar curriculum teaches the basic literacy we need to be personally and financially successful and to do so in a manner in which together we evolve a culture that supports the emergence of an advanced human civilization.



















Missing Money
Articles and video discussions of the $21 Trillion dollars missing from the U.S. government

Connect with the wider network of like-minded Solari subscribers using our in-house social media platform, Solari Connect.












No posts
Rambus Blockbuster Chartology

By Catherine Austin Fitts
My “go to” website for technical analysis of precious metals, the U.S. dollar, and the U.S. stock market is Rambus Chartology, where Rambus (that’s his handle—he’s the founding technical analyst) leads a discussion with extensive charts of what the markets are saying.
In January 2016, Rambus launched his quarterly Solari Report with a Blockbuster Chartology. You can find links to the entire series of quarterly and annual Blockbuster Chartologies at the end of this latest piece.
One of the reasons that Rambus is so good at his craft is that he focuses on “staying on the right side of the major trend.” The challenge of doing so at this time is that it is tempting to look for bottoms or to assume that the trend upwards in the U.S. dollar or stock market may be over. However, Rambus consistently brings us back to the discipline of the Chartology. What does price tell us? As he describes so aptly, we are dealing with psychological warfare.
Sitting back once each quarter to get this perspective offers invaluable insight. So, here we go for the 2026 1st Quarter Wrap Up Blockbuster Chartology!
Blockbuster Chartology Quarterly Report
By Rambus
~ 2026 1st Quarter Wrap Up ~
PM Complex in Focus: Unraveling the Next Big Move
H&S Bottom or Double Top Reversal Pattern?
The Chartology of Bull Markets
PM Complex in Focus: Unraveling the Next Big Move
Currently, the PM complex and the US stock markets are attempting to form a short-term low, which could lead to a counter-trend rally, which I’m still viewing as a short-term bounce. So far, the PM stock indexes have retraced about 50% of the decline from the all-time high made at the end of January of this year. If we see the current bounce take out the 61.8% Fib retrace off the most recent low, then the sideways trading range is back in play.
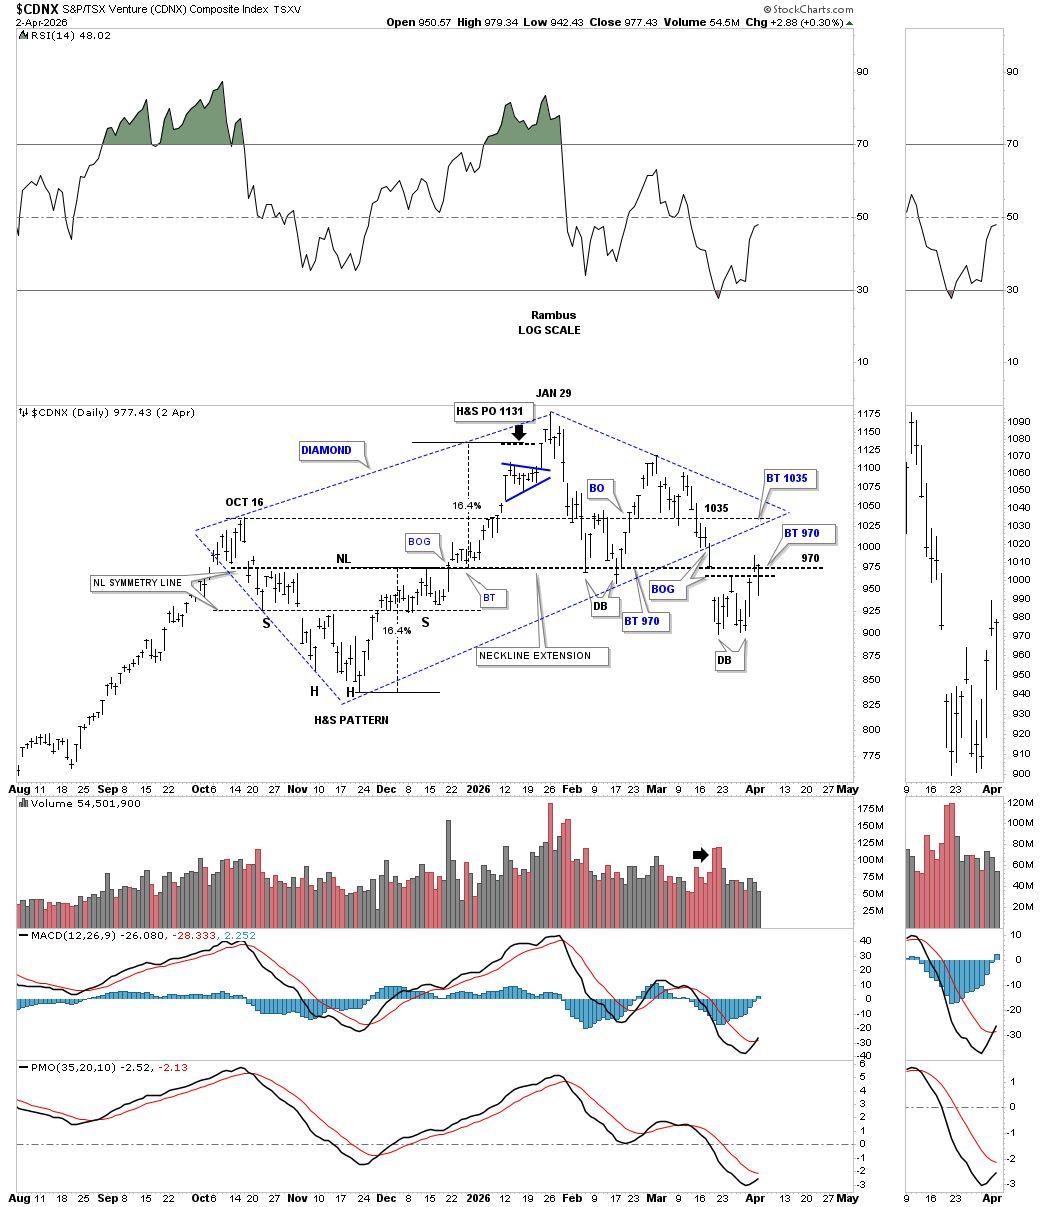
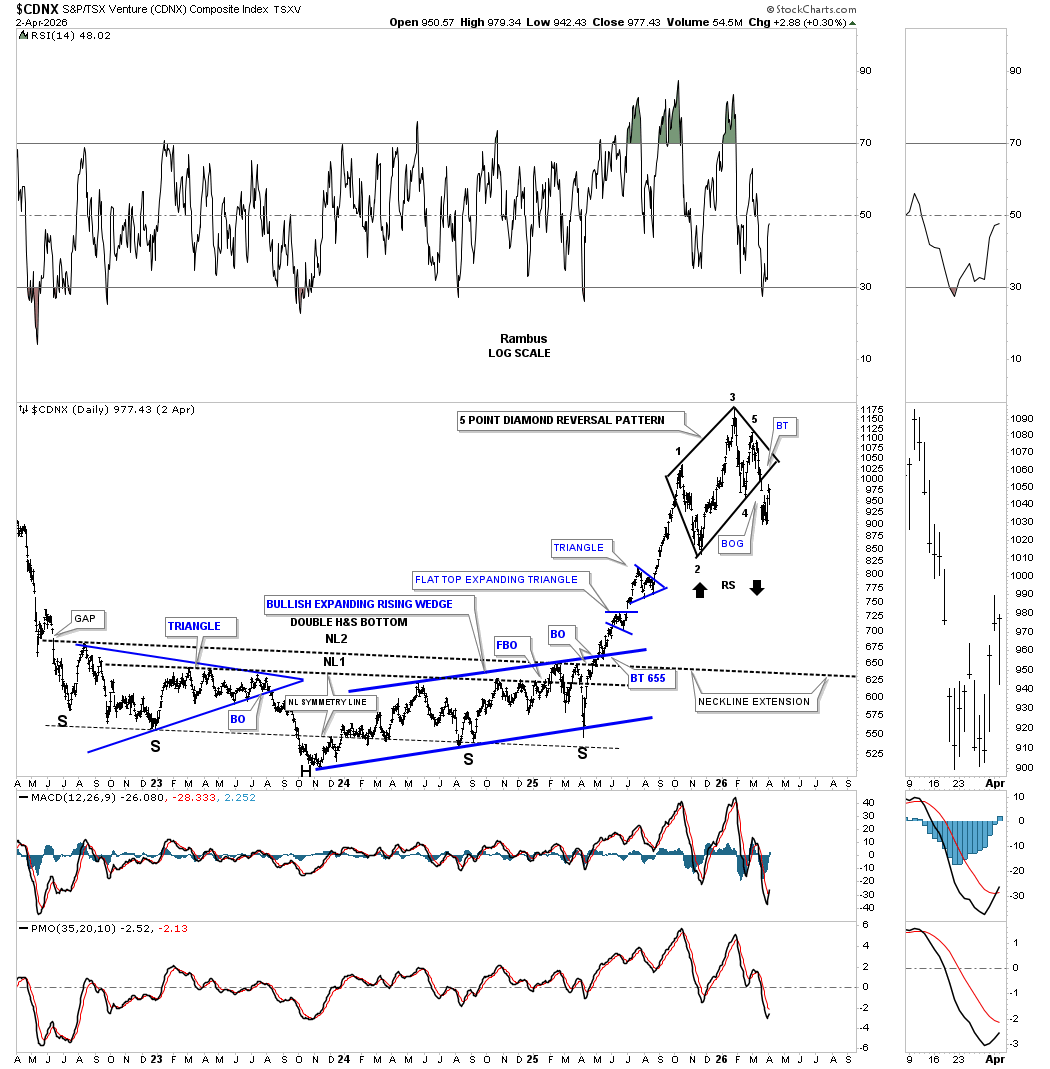
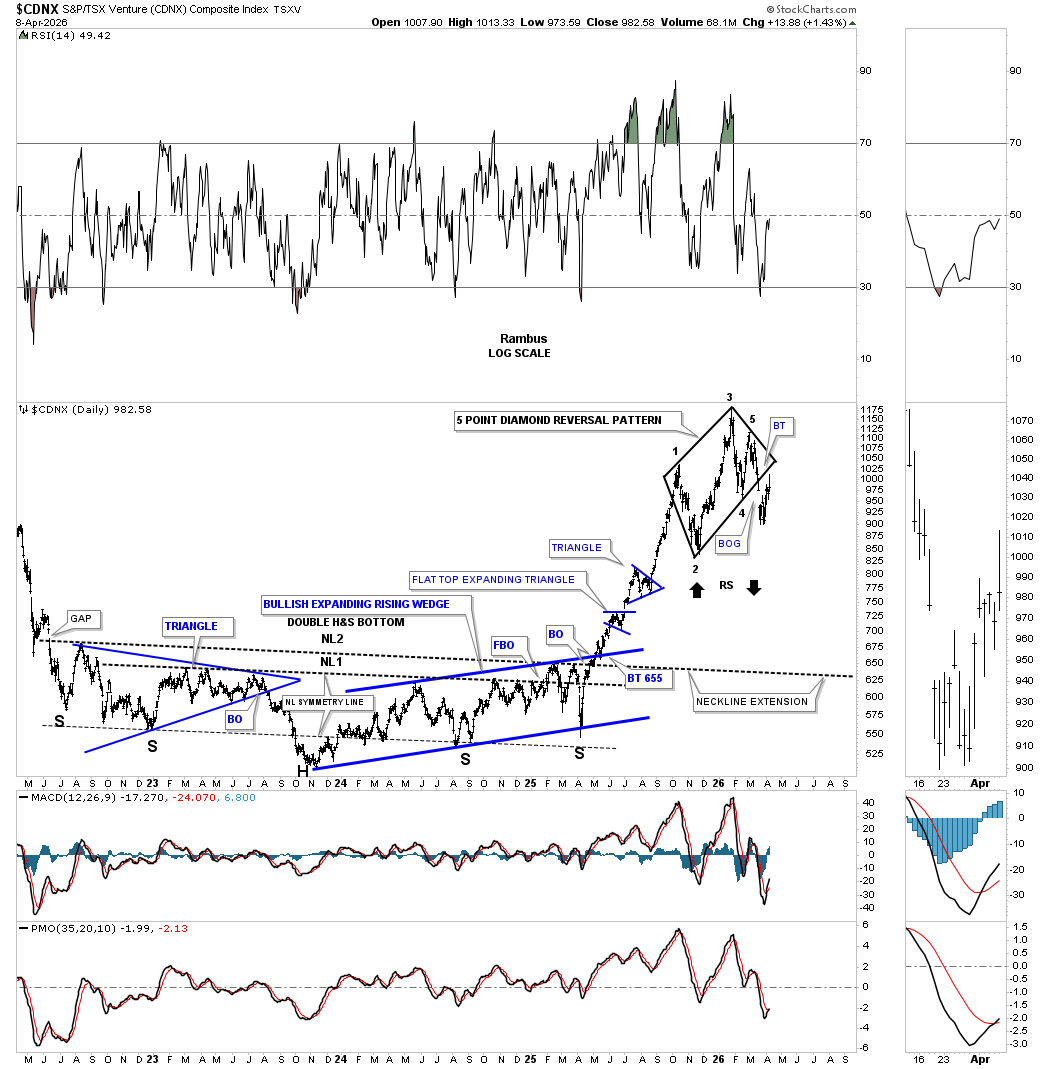
Last week, the CDNX got a nice rally off the double bottom low and is currently testing the neckline extension line taken from the H&S consolidation pattern made on the left side of the chart. If the CDNX can trade above the apex of the diamond reversal pattern, then the bulls will be back in charge.
Below is the cleaned-up version of the chart above, which I’ve been looking for a backtest up to the 1045 area. Note how the double bottom at reversal point #4 held initial resistance from the current double bottom low. A measured move for the current double bottom low would be up to the apex of the black diamond, which coincidentally is the double bottom trend line taken from the 4th reversal point double bottom low.
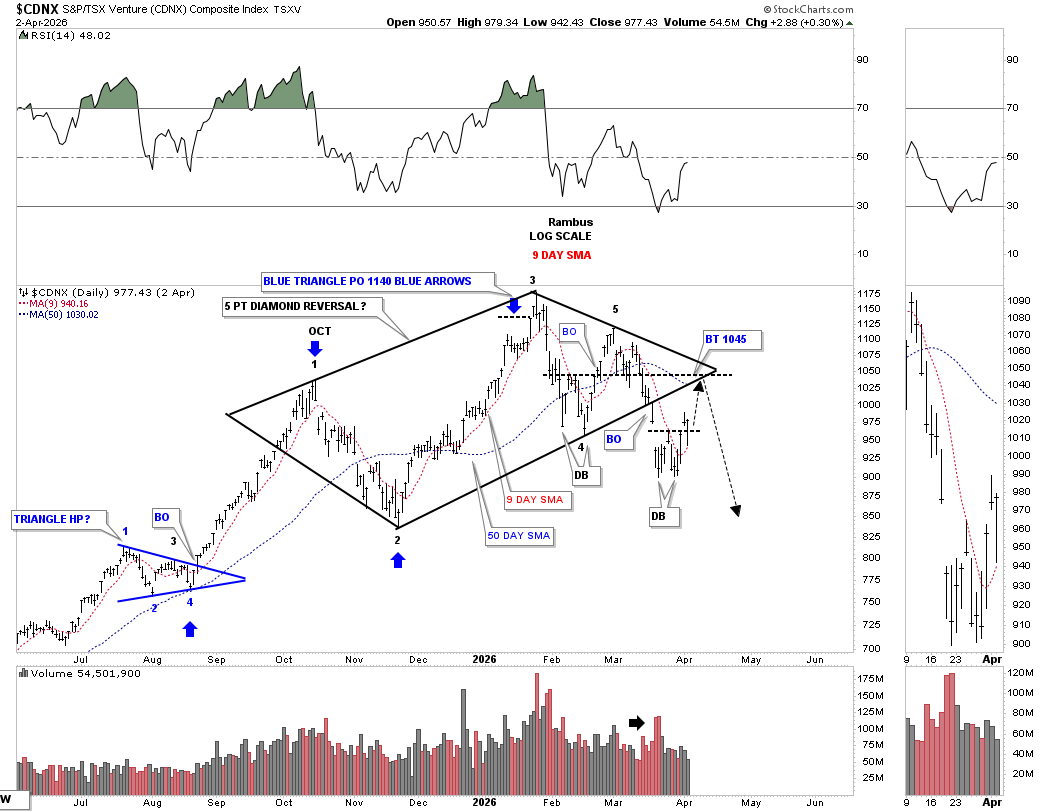
This long-term daily chart shows just how important the apex of the 5-point diamond is for both the bulls and bears alike. Below the apex, and the bears are still in charge, and above the apex, and the bulls take control.
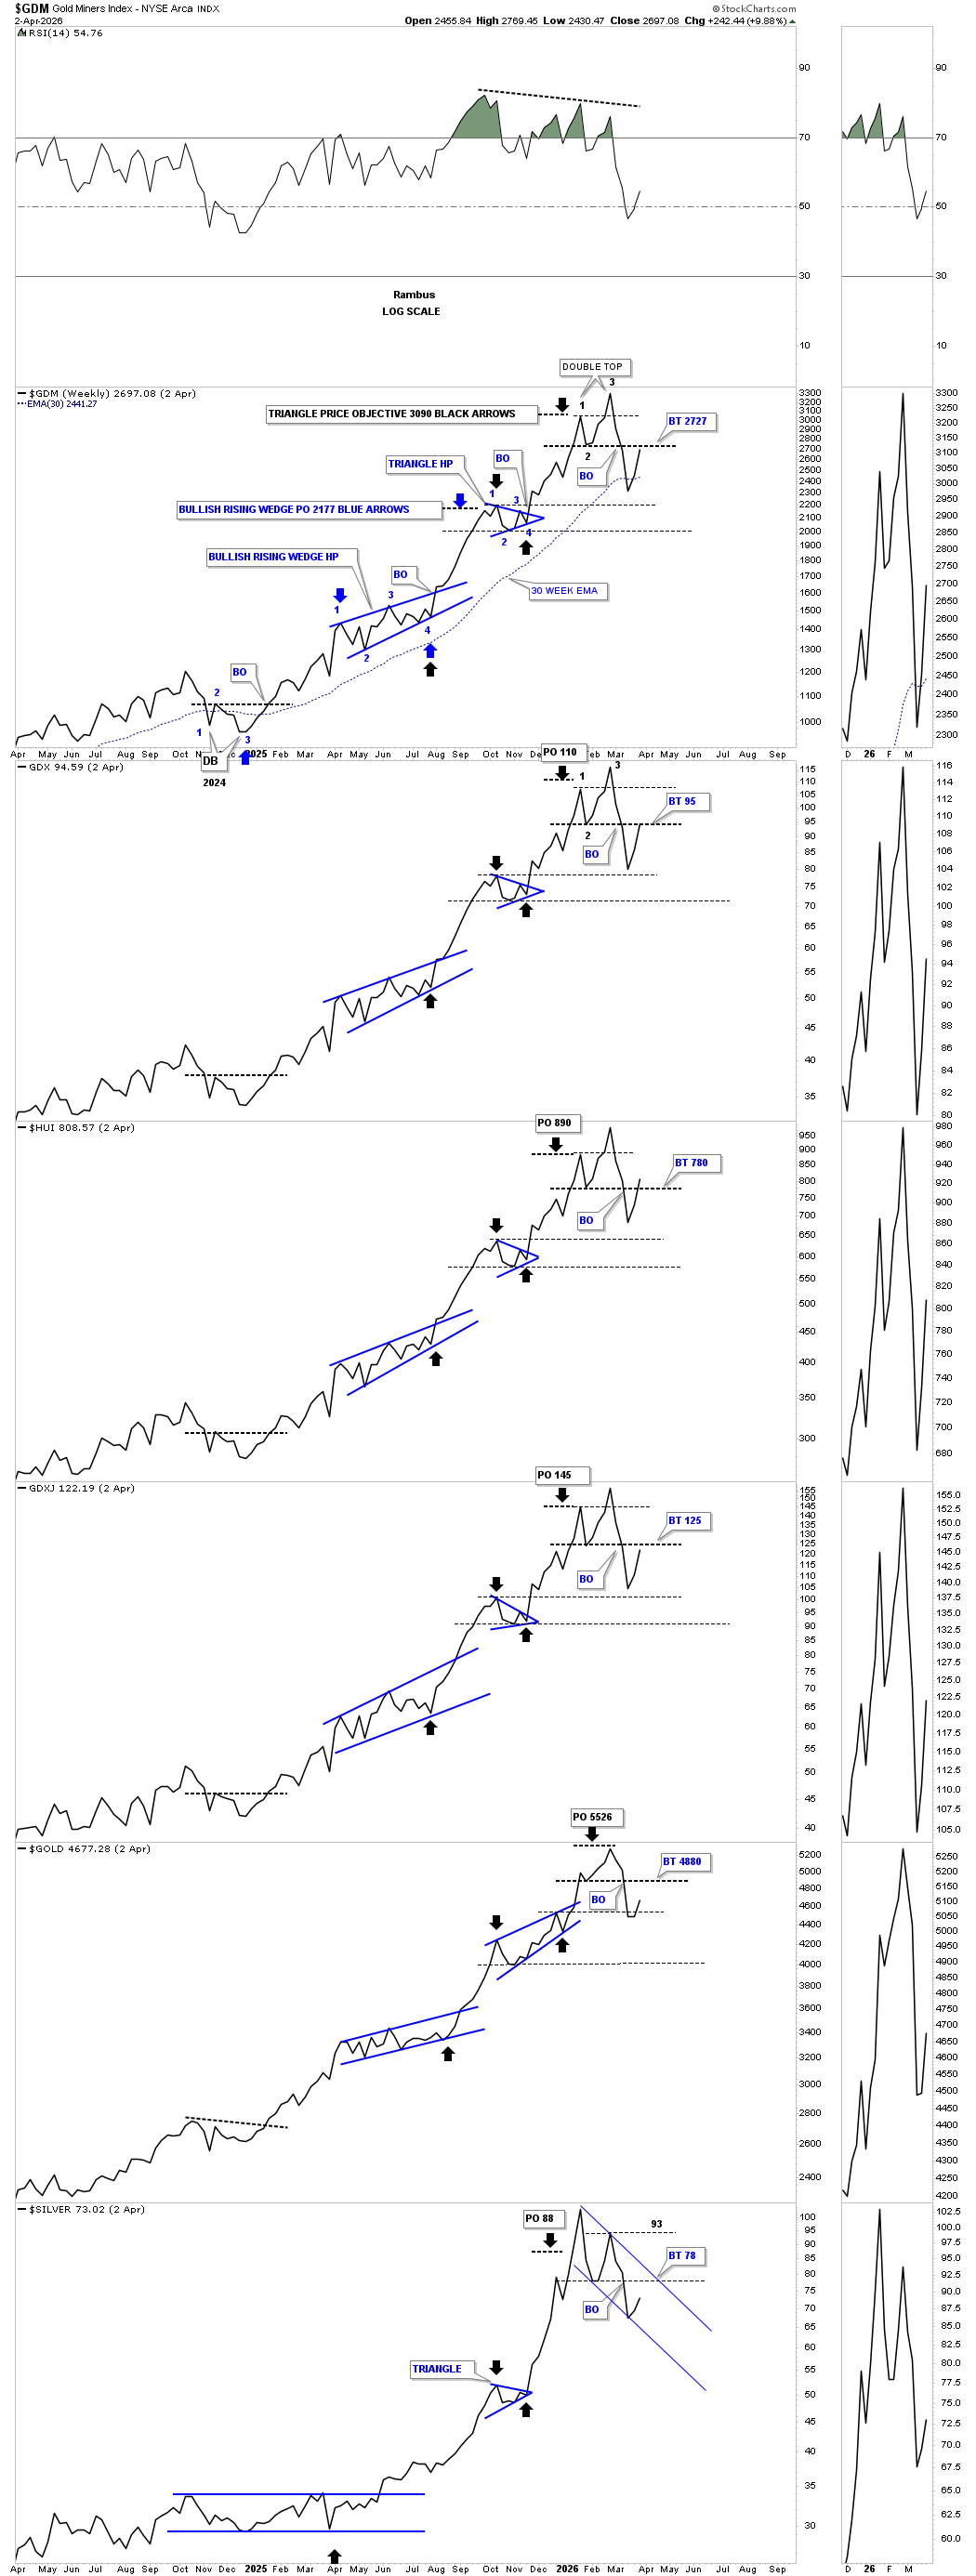
Next up is the weekly line combo chart we started following a month or two ago, which is currently showing the possible double top in place. If you go back to the double bottom low made at the end of 2024 and January 2025, you can see the price action has made a series of higher highs and higher lows all the way up to the all-time high made at the beginning of 2026. Since the all-time highs made in January of this year, the PM complex made its first lower low below reversal point #2, but we still don’t have a confirmed lower high in place yet, leaving the door open to a larger trading range.
Last week when we looked at this chart, I mentioned how important the weekly close would be. If the price action exceeded the double top trend line, then the double top would be negated, putting back into play a larger trading range is forming. As you can see, for the most part, the double top trend line held resistance last week. Now we have to see where the price action is trading at the end of this coming week before we can say with any confidence the double top is still in play or has been negated.
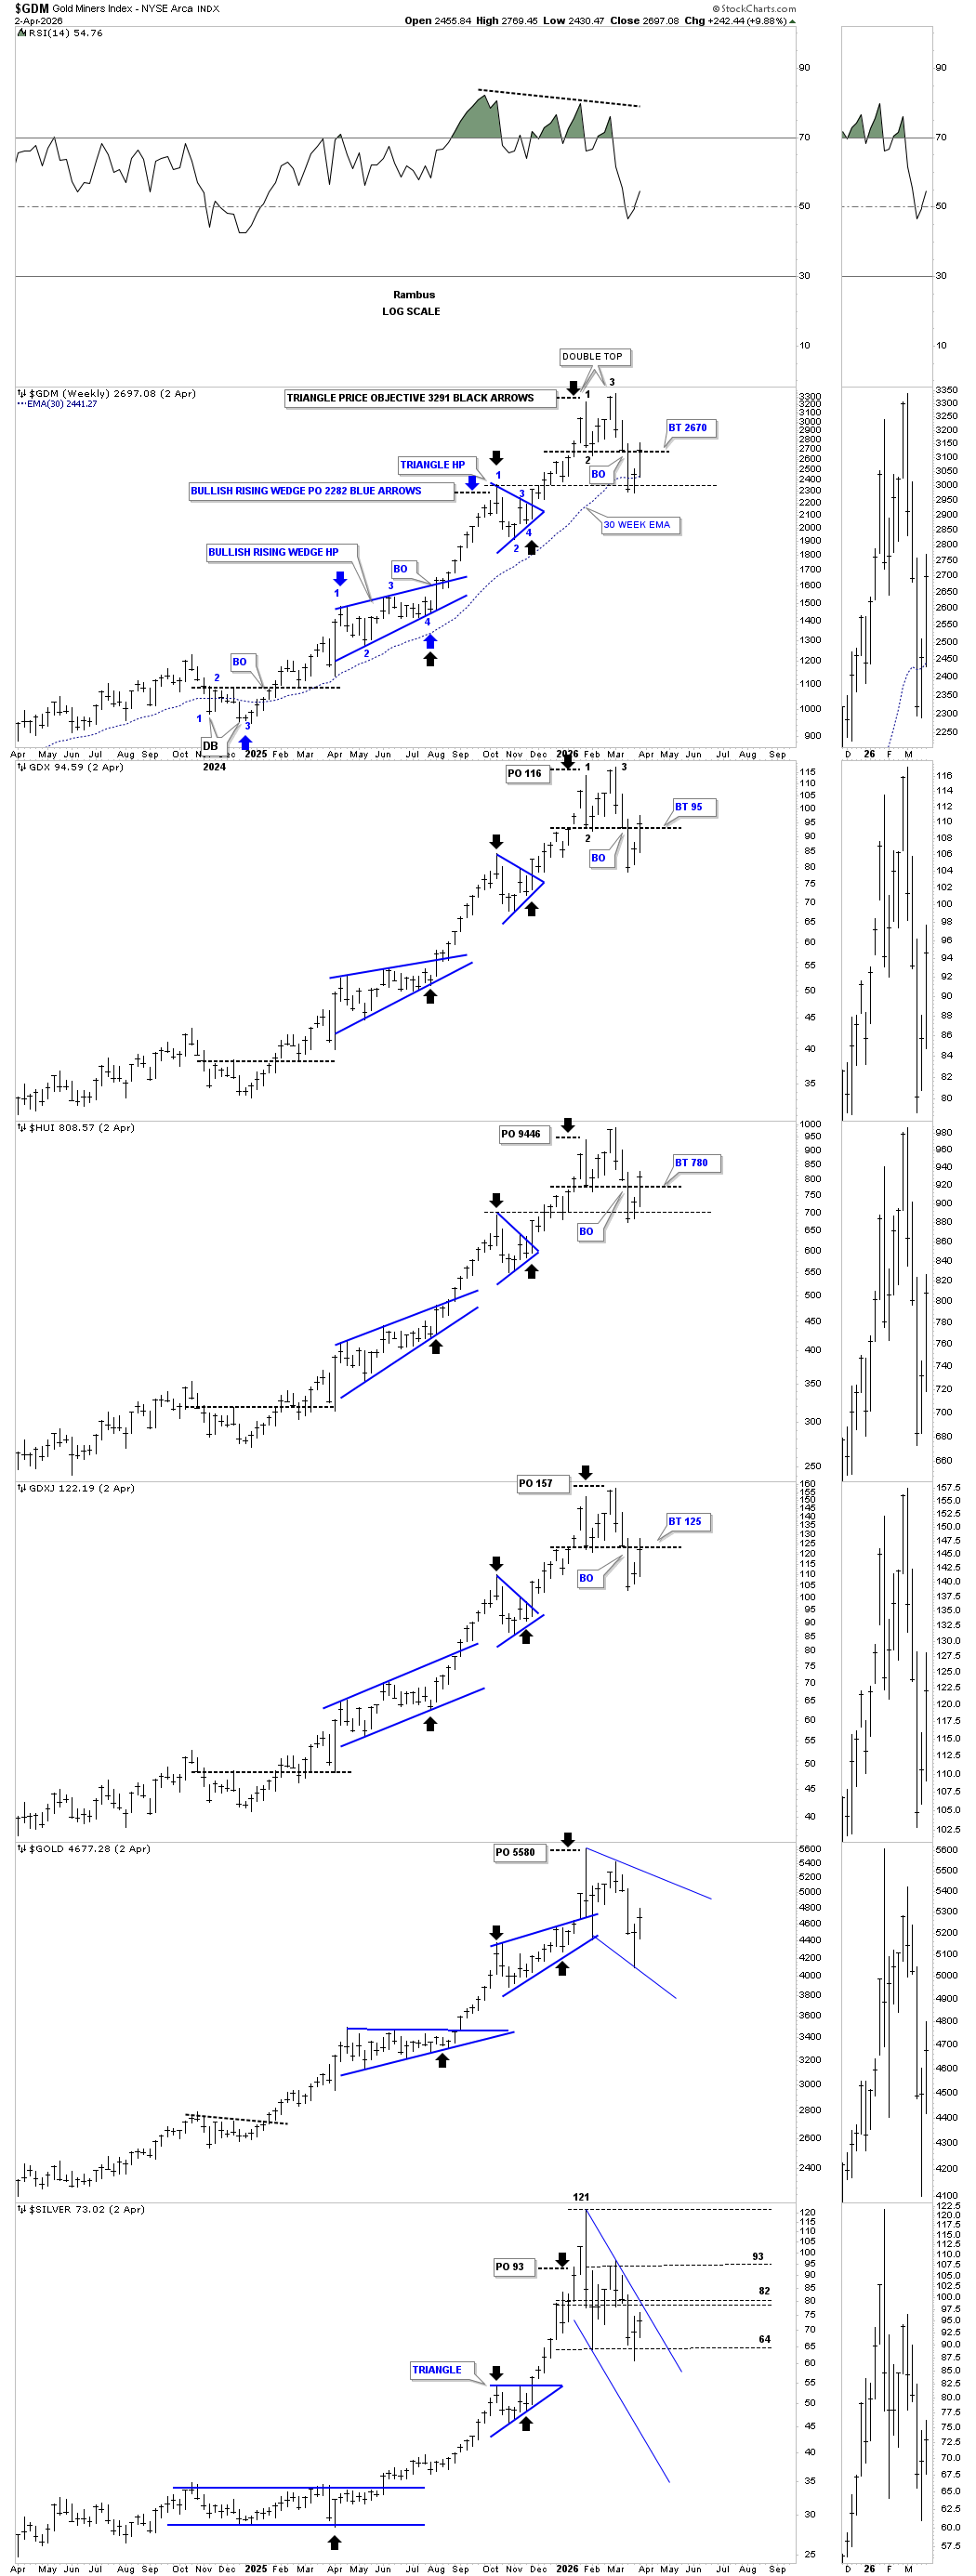
I realize the double top on the weekly line chart above doesn’t look like a double top, so I rebuilt the same weekly line chart above to show you from the weekly bar chart perspective how the potential double top looks.
The GDM on top is properly annotated with the two measured moves reaching their respective price objectives, which generally calls for some type of new trading range, which can be either a top or consolidation pattern. The backtest to the double top trend line is taking place right now, so we need a little patience to see how the price action behaves in this general area. Initial support is often found on the top of the preceding consolidation pattern, and in this case, the black triangle, thin dashed horizontal line on the GDM.
The black arrows also show the measured move price objective was also reached and held at reversal point #1.
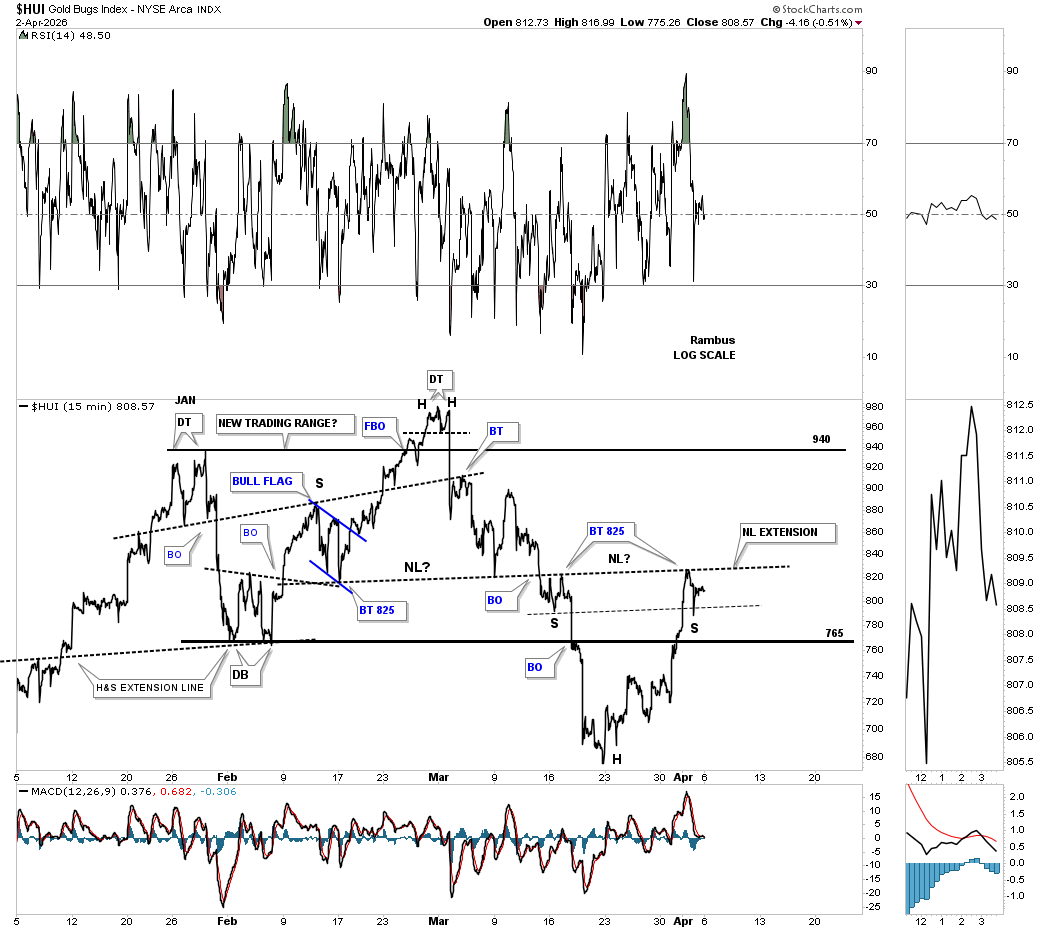
There’s a potential new pattern that just began to show itself last Thursday on the short-term 15-minute line chart below. Note how the H&S top neckline extended to the right side of the chart held resistance last Friday, which could be forming a small right shoulder to match the small left shoulder, as shown by the neckline symmetry line. Since this is a very small pattern, we should have our answer in the next day or two if the possible small H&S bottom is possible. If the small H&S bottom does in fact play out, then it would call for a rally up to the top of the January 2026 trading range.
The 2 hour bar chart for a slightly different perspective.
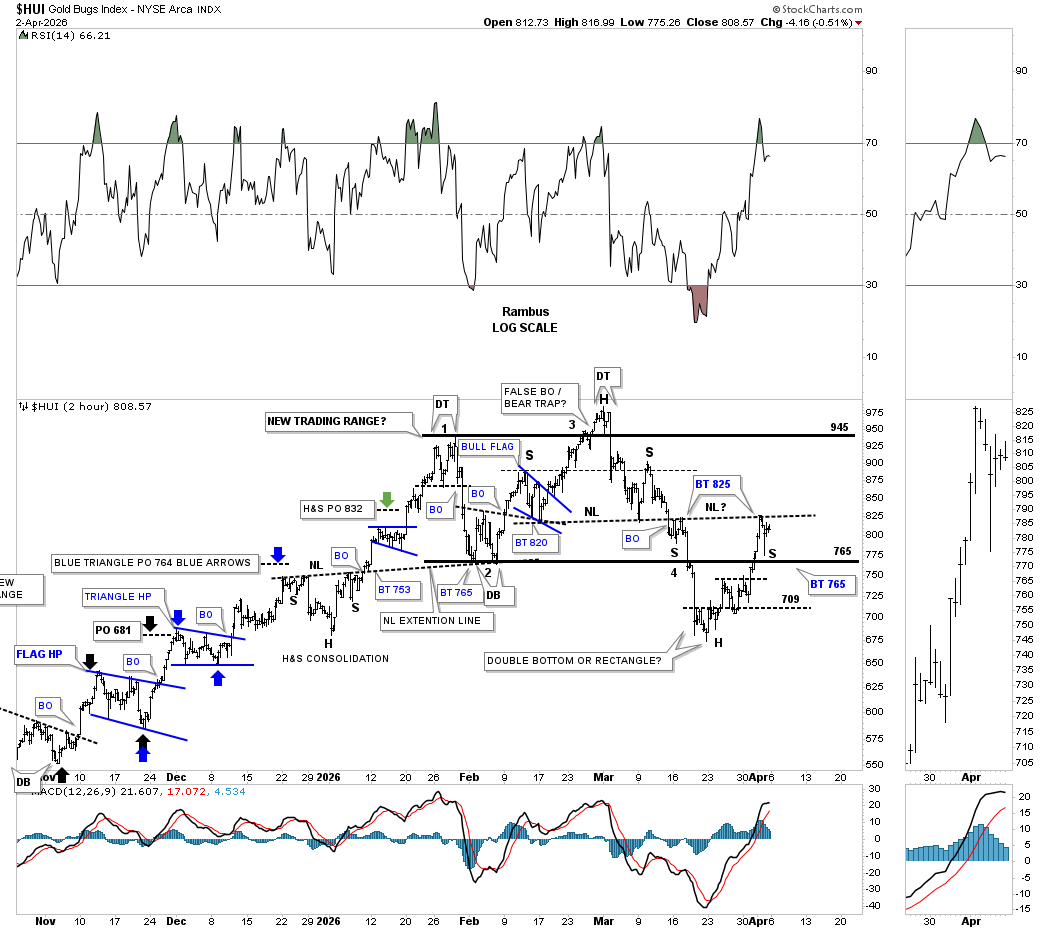
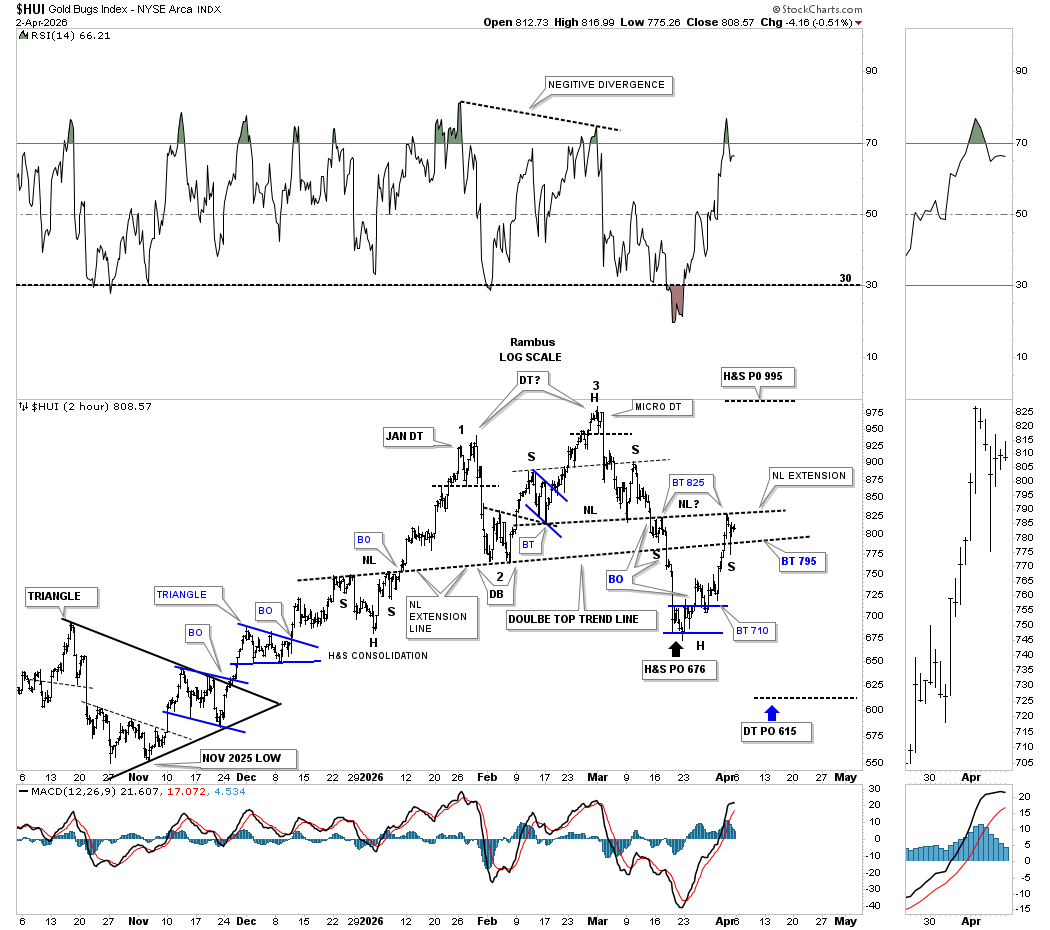
We’ve been following this 2-hour chart since its inception, which shows the possible double top still viable, but this counter-trend rally is pushing the limits of the possible double top trend line. Here again, you can see how the possible small H&S bottom is forming at the most recent low, which would have a minimum price objective up to the 995 area, which is the top of the trading range.
The H&S top part of the double top was reached at 676, but if the possible double top is still in play, it has a price objective down to the 615 area.
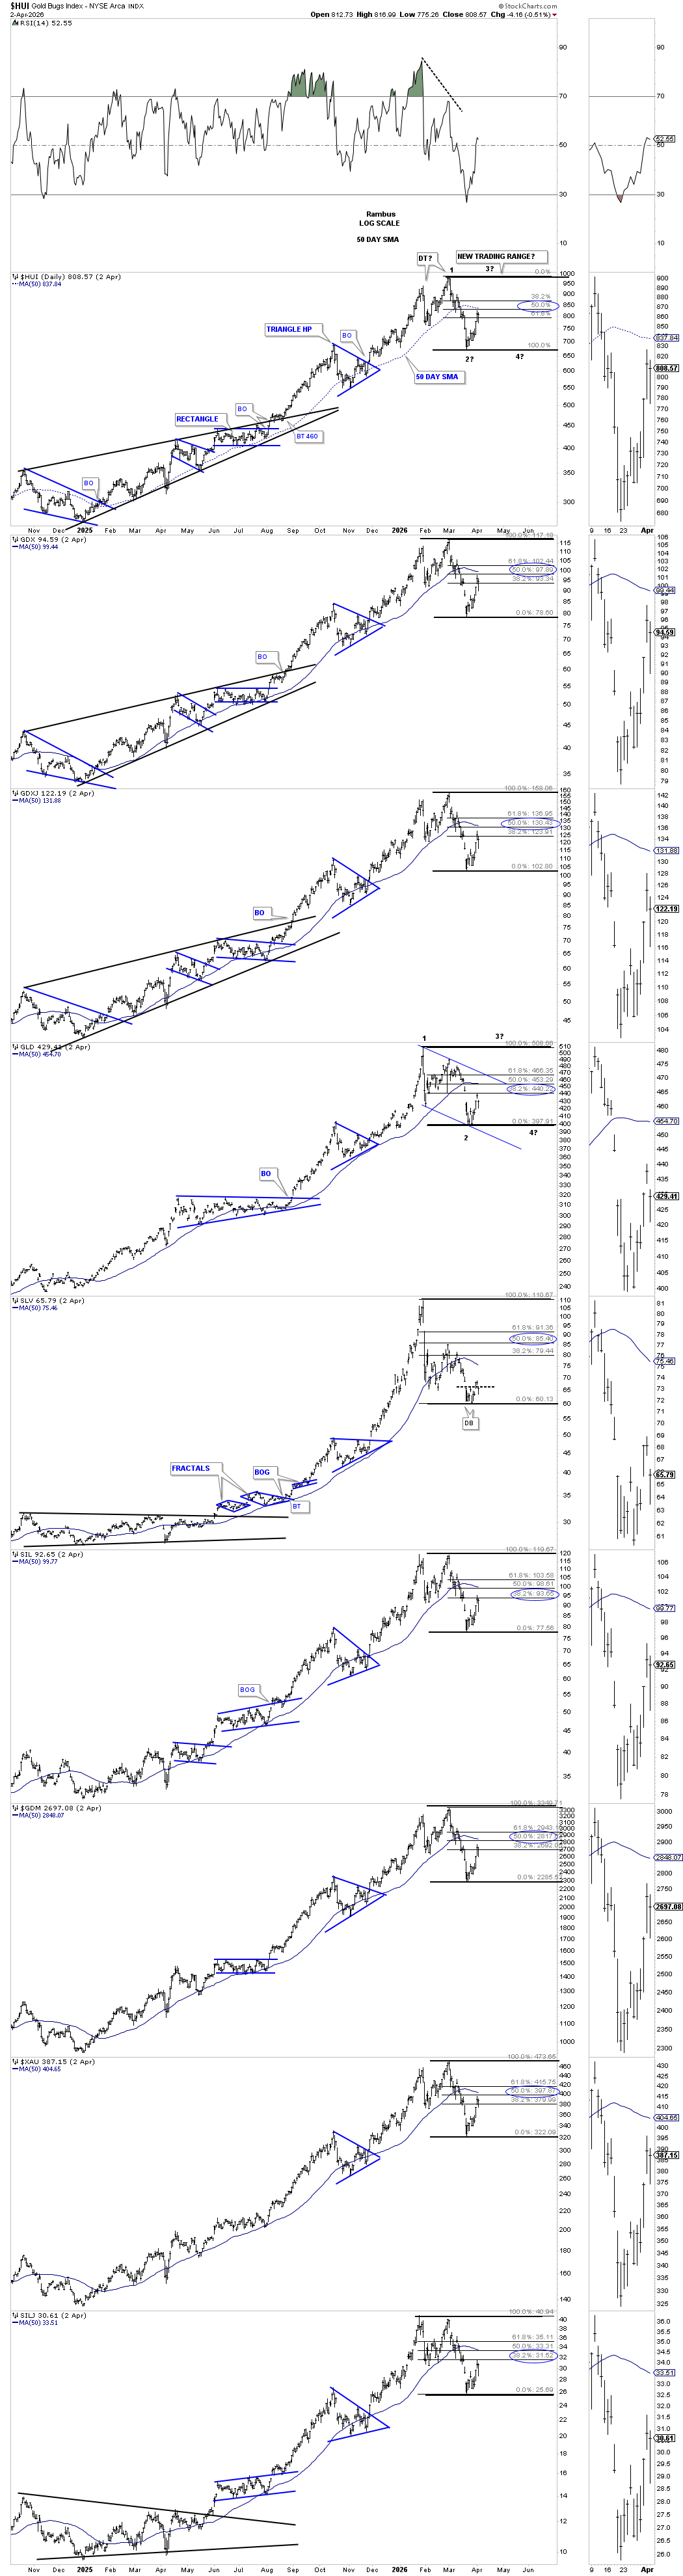
If the possible double top is negated at some point in the week ahead, this longer-term daily chart below shows how the new trading range is beginning to form. First, to negate the possible double top, the price action will have to trade above the 61.8% Fib retrace to get the ball rolling. Currently, the PM stock indexes have retraced 50% of the recent decline, and if the new trading range is forming, then we have seen the first reversal point low, with the 2nd reversal point now in progress towards the top of the trading range.
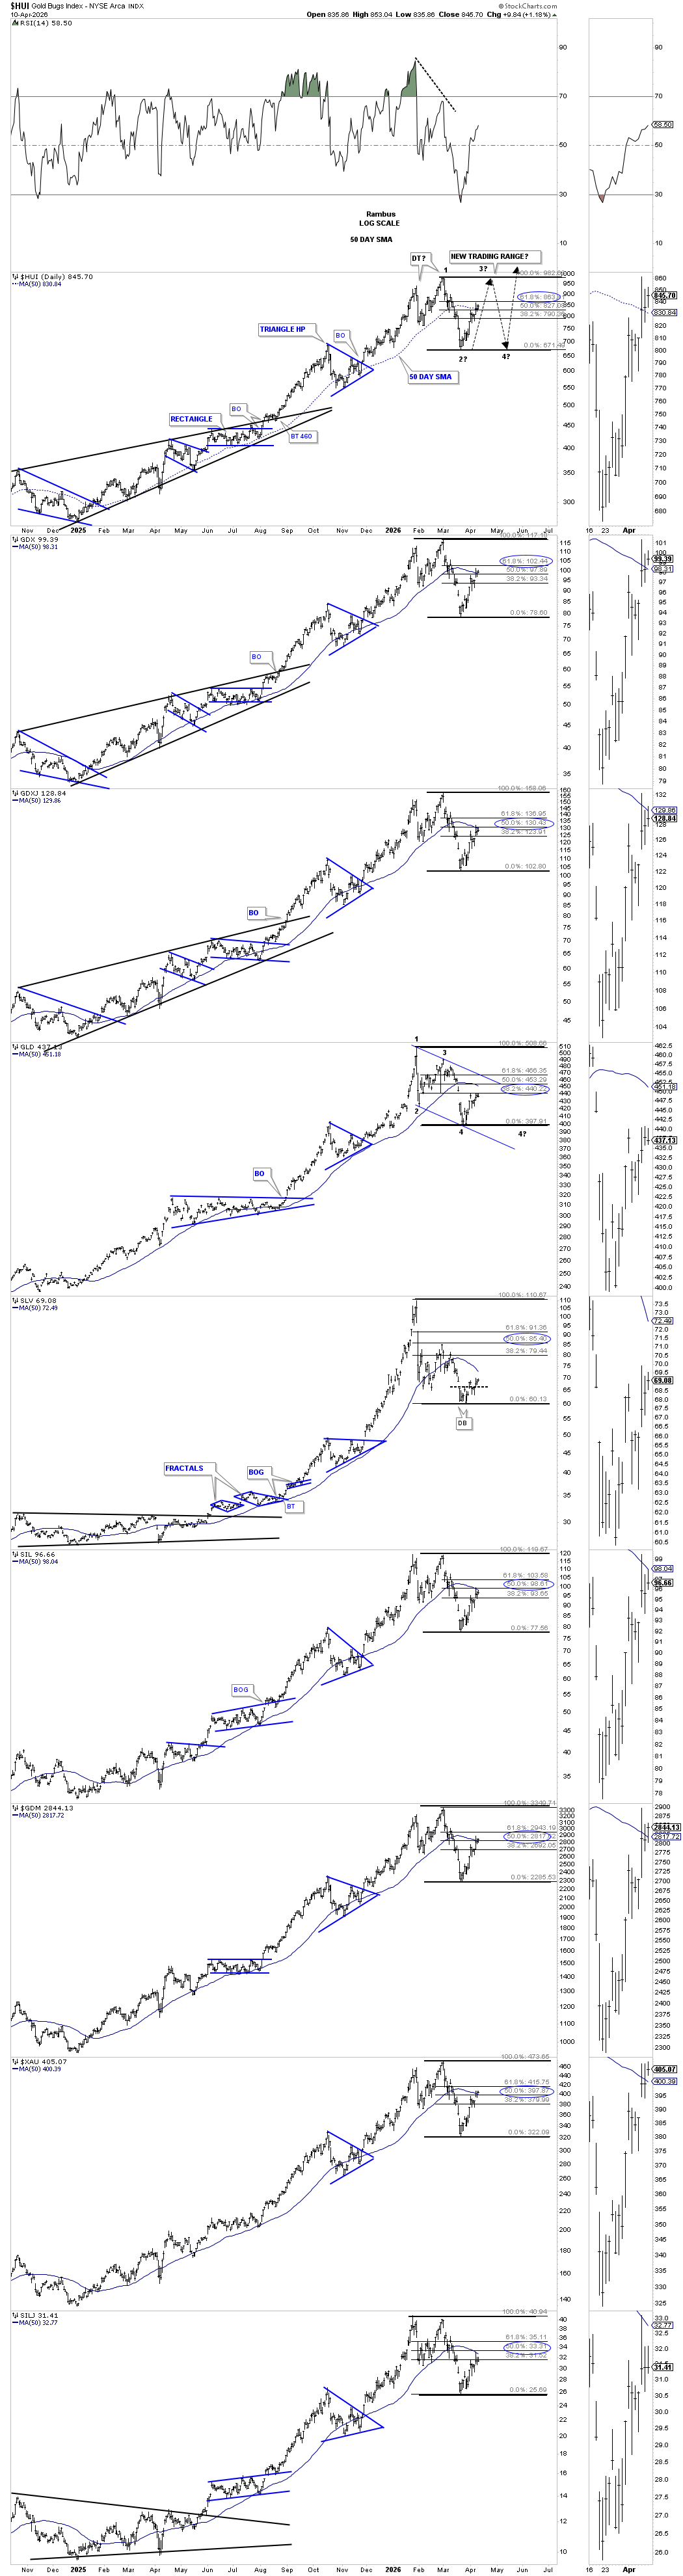
The thing that most investors don’t understand about a consolidation pattern is that there has to be a minimum of four reversal points. If the PM complex is forming a consolidation pattern, then when the price action rallies towards the top of the trading range, reversal point #3, there will need to be one more decline to find the all-important 4th reversal point low. Take a second and look at all of the consolidation patterns on this combo chart and you’ll see every consolidation pattern, whether it’s blue or black, has a minimum of 4 reversal points with reversal point #1 starting at the first high of each pattern.
For instance, in our current situation, if the potential new trading range is under construction, then this current rally will find the end of reversal point #2 up towards the top of the trading range, where reversal point #3 to the downside begins. At the top of the trading range, where reversal point #3 begins, most investors that don’t understand the basic concept of a consolidation pattern will be calling for new all-time highs and the correction is over, but it’s this point where they’ll be caught off guard as the decline to find the 4th reversal point low begins. Depending on how large the consolidation pattern is, it can become very disheartening watching all your new longs declining and not knowing why. Then, when the decline is finishing up after finding the 4th reversal point low, they become despondent and sell their stocks at the low because the pain is too great to bear. It’s just the way the markets work.
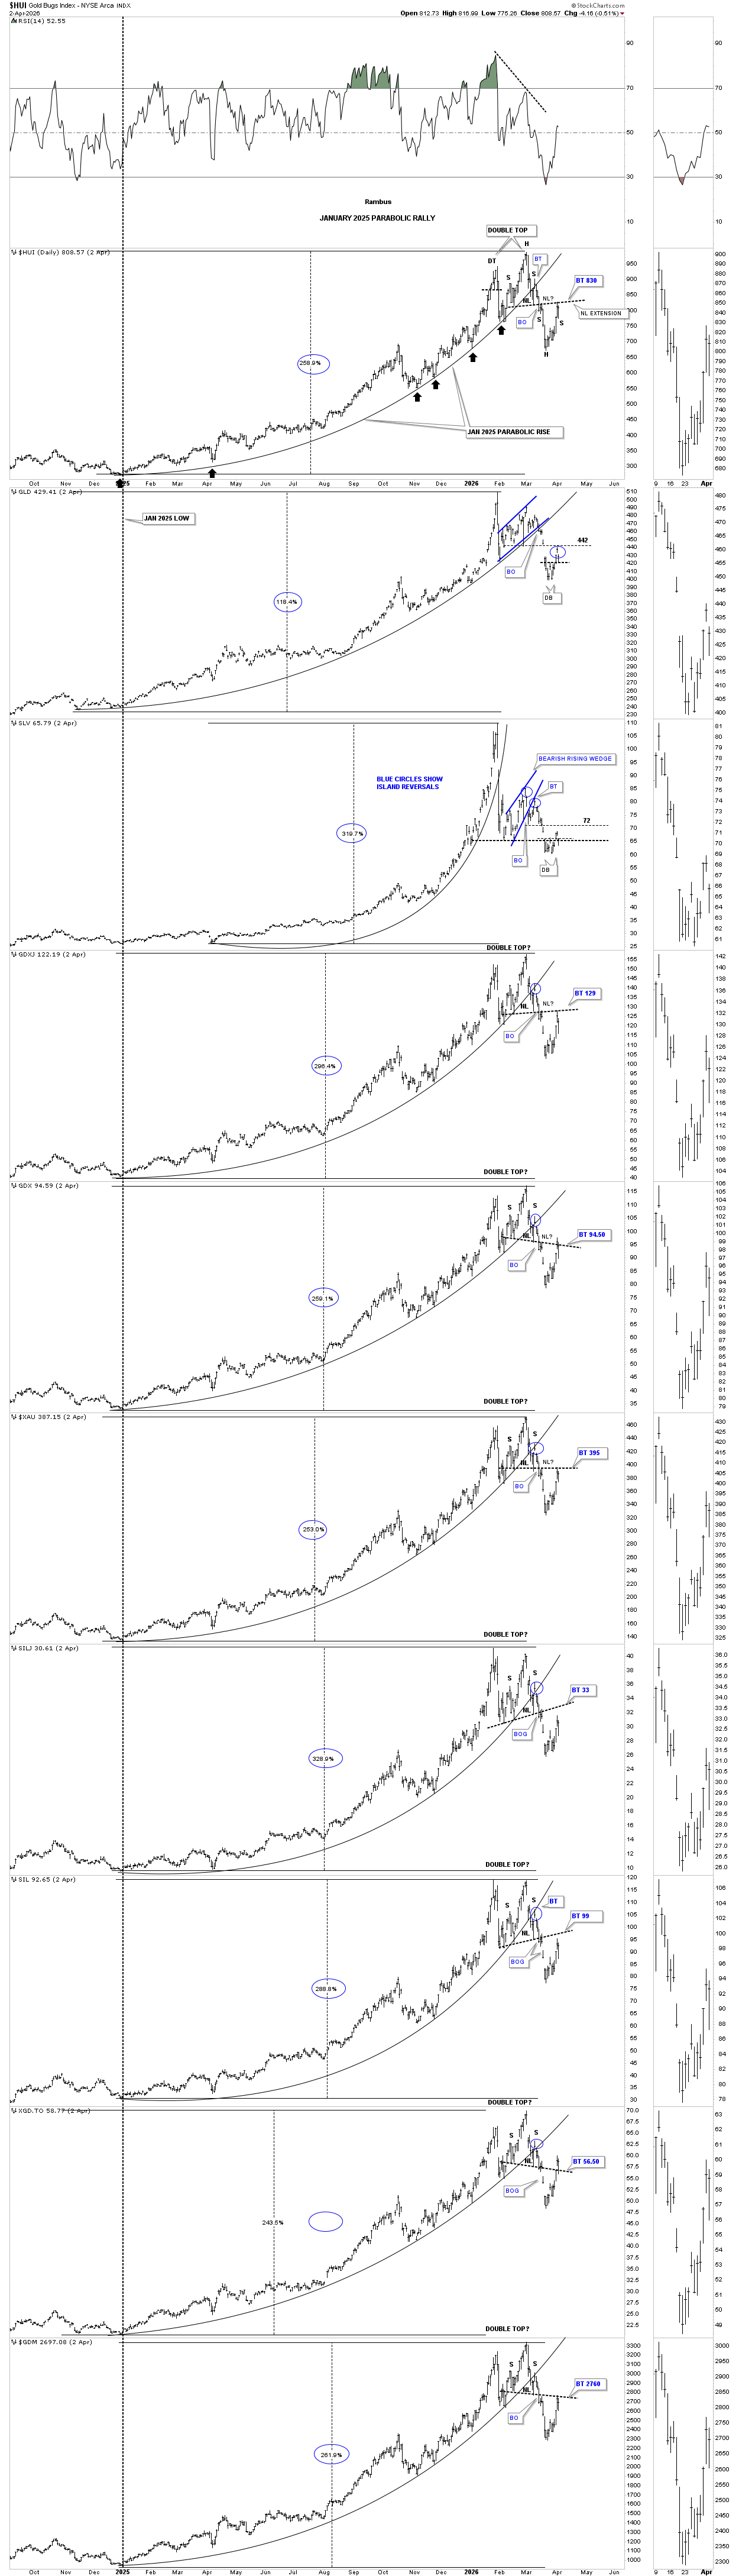
This next daily combo chart shows the parabolic arc that began in January 2025. I’ve added that small H&S bottom we looked at on the minute charts above, which is the neckline from the H&S top portion of the potential double top. If the price action trades above the neckline, then that’ll open the door to a rally up towards the top of the trading range.
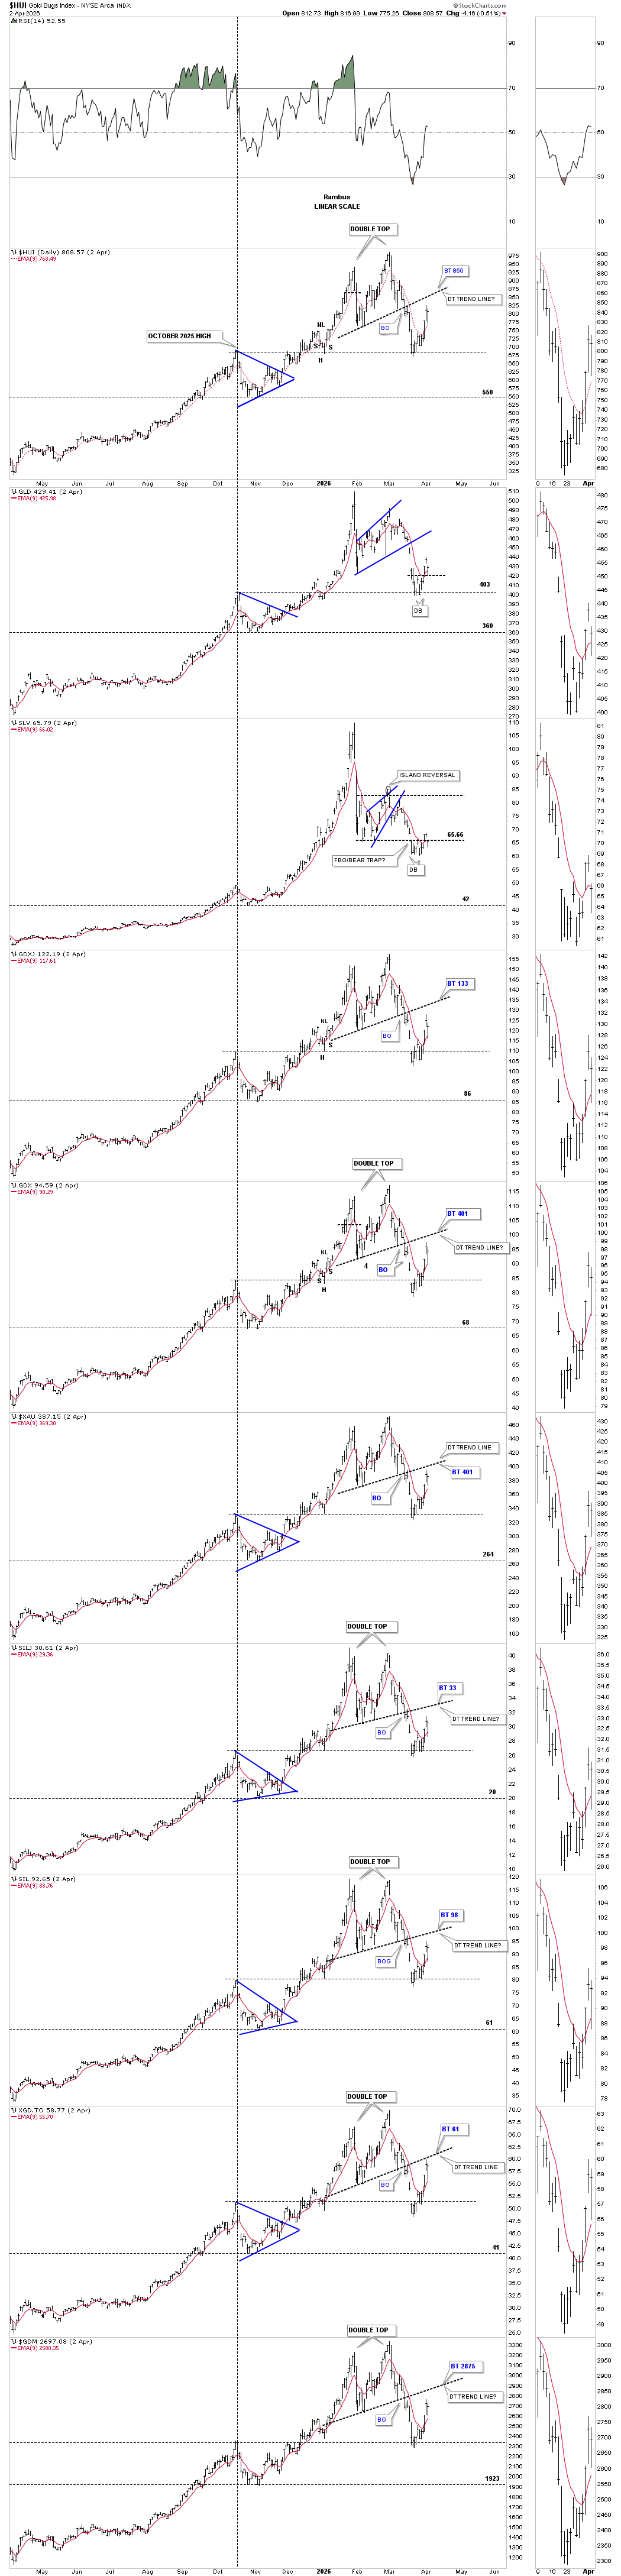
This next daily combo chart just focuses on the possible double top trend line, which is getting pretty steep. Last week, the price action traded above the red 9-day EMA, which is one for the bulls. The thin horizontal black dashed line is taken from the top of the blue triangle, which is the first place one would look for initial support during a decline, which held, which is another one for the bulls.
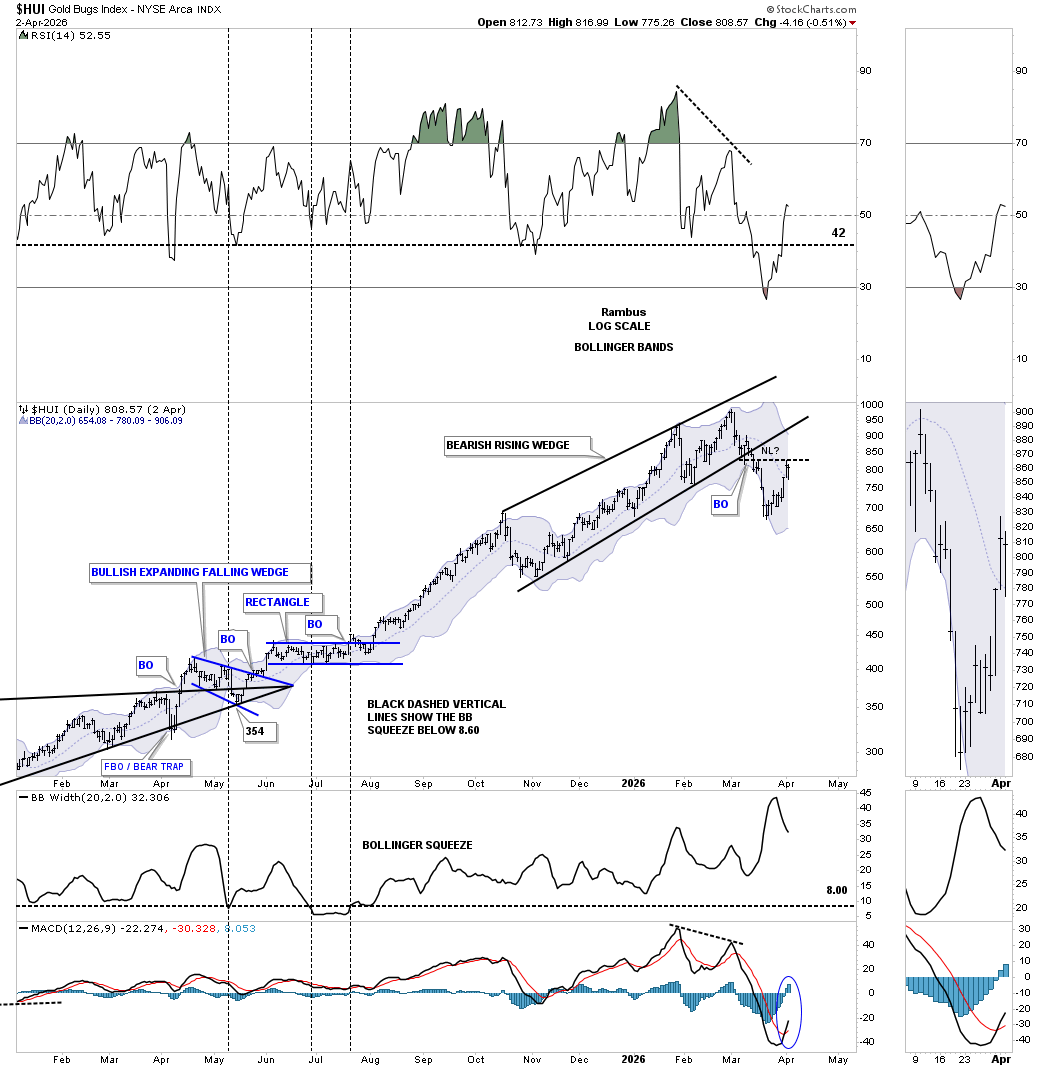
This last chart for the HUI shows the October 2025 bearish rising wedge with the possible small H&S bottom forming below the bottom trend line. Last week, the HUI traded above the center dashed midline of the Bollinger Band, which is another one for the bulls. The top of the BB now comes in at 906 and is declining.
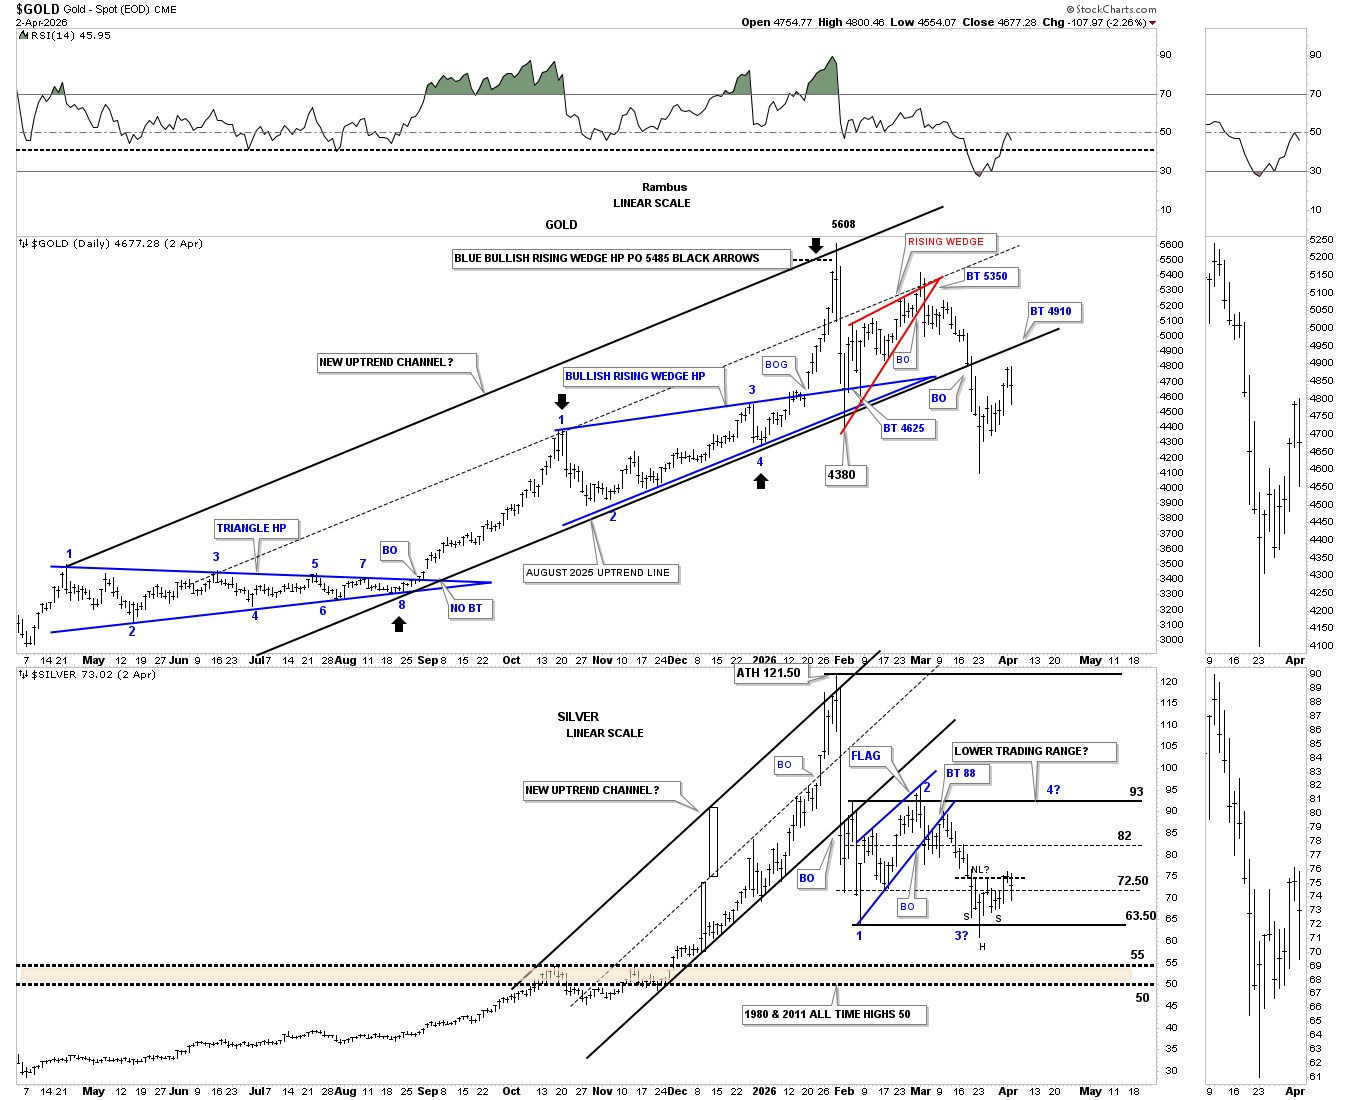
Next is the daily combo chart, which has gold on top with silver below, showing their uptrend channels, with both bottom trend lines having given way to the downside. Gold is still trying to backtest the bottom trend line around the 4910 area. Silver could be trying to form a small H&S bottom at the low end of the trading range, but it’s becoming a bit unbalanced, though still viable.
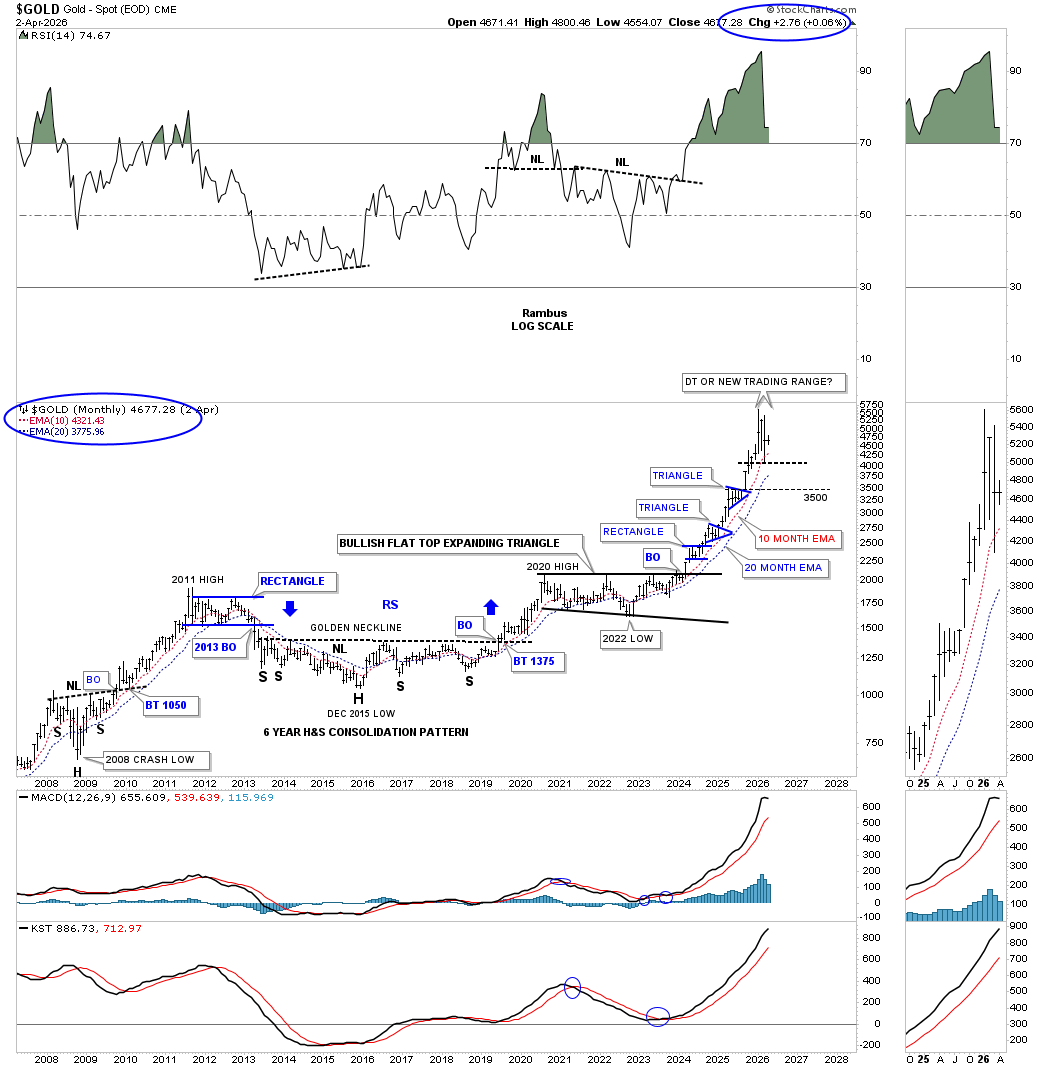
Next is the long-term monthly chart for gold we haven’t looked at in a few months. This chart shows the powerful rally out of the 2008 crash low to the 2011 high with the black rectangle measuring time and price. When I first built this chart, I showed how the current rally out of the 2022 low was almost equal in time and price to the 2008-2011 rally phase, as shown by the red arrows. As you can see, the current rally exceeded the 2008-2011 rally by almost 70%.
Back at the 2011 all-time high was the beginning of the bear market that lasted until the 2016 low, which I can assure you was no fun if you got caught at the top. One would’ve had to wait for the 2011 high to be exceeded until 2024, some 13 years later.
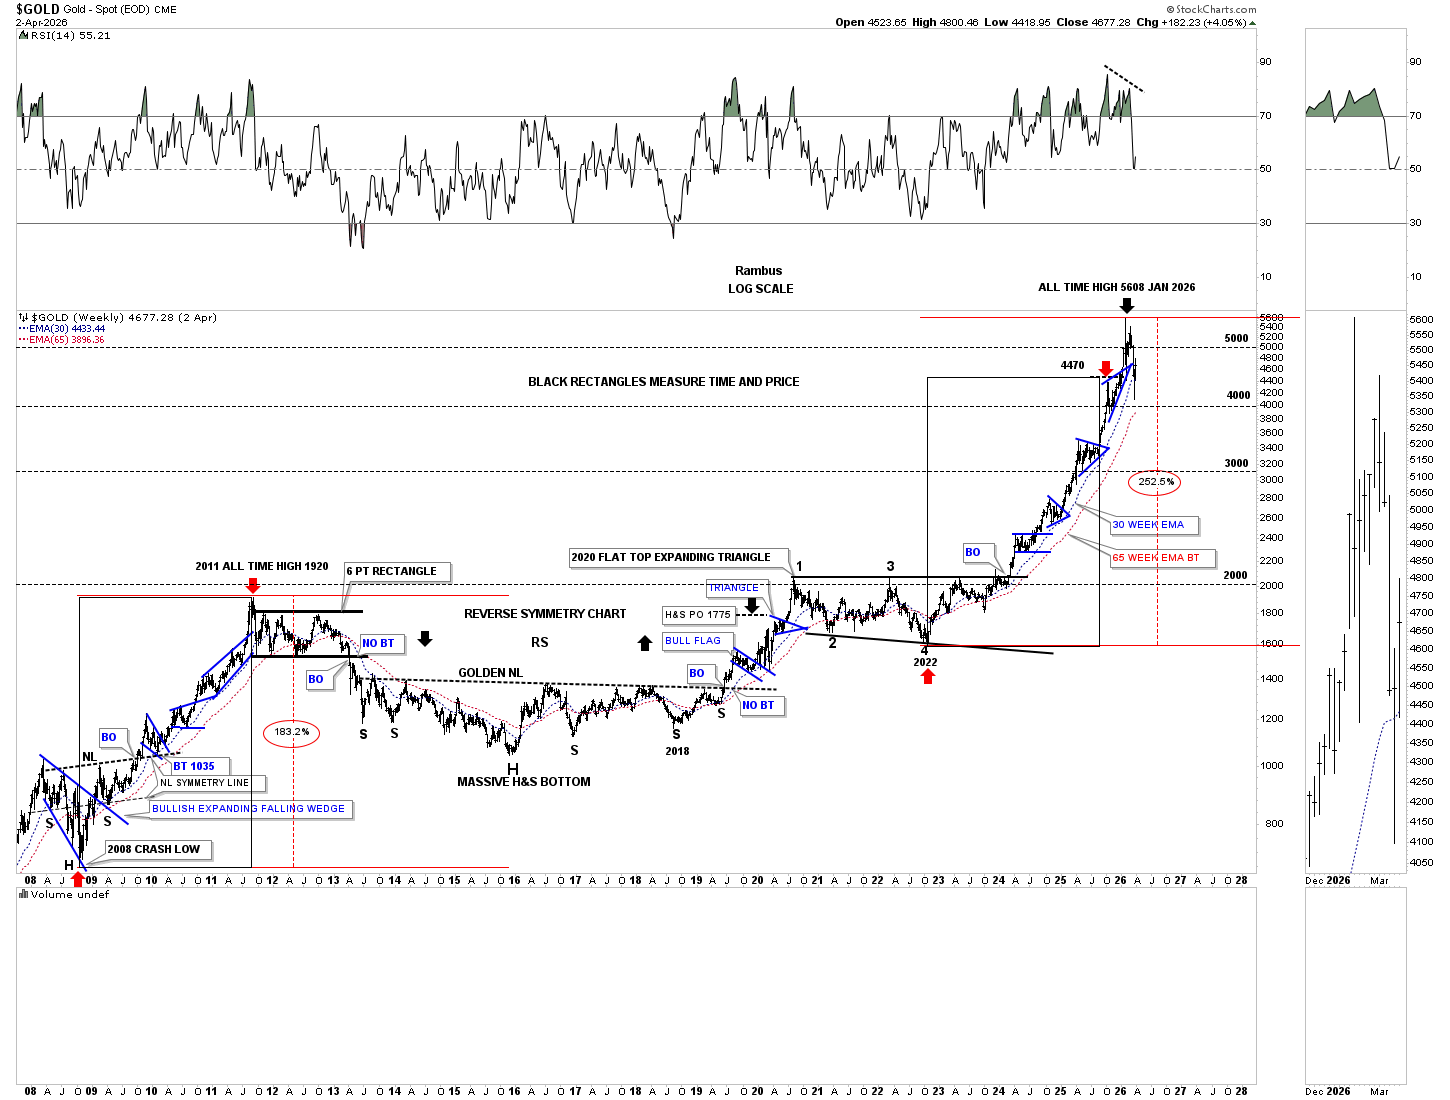
Next is the long-term monthly chart, which uses the 10- and 20-month EMAs for long-term support. In March, the red 10-month EMA was hit, and gold has gotten a nice bounce. Back to the question at hand, is gold forming a double top or a high-level consolidation pattern? Back in 2011, gold traded sideways for over two years, forming the 6-point rectangle consolidation pattern, which broke to the downside in April 2013.
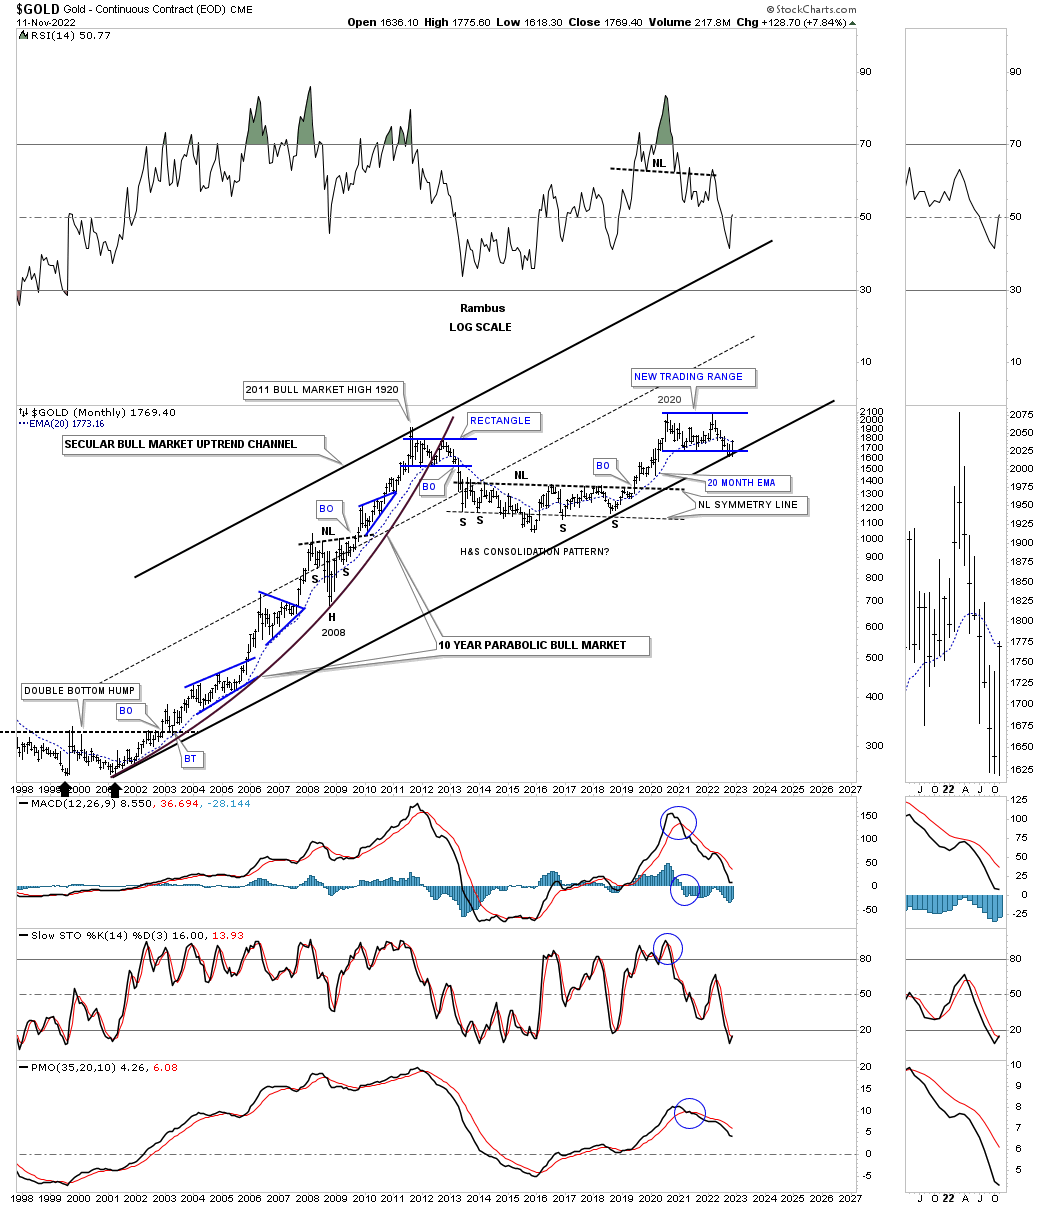
Back on November 13, 2022, almost 3 1/2 years ago, gold had just reached a critical support area which is where the bottom trend line of the 2000 parallel secular bull market uptrend channel and the bottom rail of the 2020 bullish flat top expanding triangle were intersecting. I had been explaining the three different types of lows that form on a chart short, intermediate and long term lows.
Below is what I wrote on November 13, 2022 about the long term low on gold.
November 13, 2022:
So far we have looked at a short term “TIME LOW” and an intermediate term “TIME LOW” for Gold. Now lets look at a possible long term “TIME LOW” which has slowly but surely been forming since the August 2020 high. After the August 2020 high was established I mentioned that I wouldn’t be surprised if we saw the price action trade sideways until the bottom rail of the 2000 secular bull market uptrend was reached. As you can see Gold has finally reached its destination and the moment of truth is at hand.
If this low holds where the bottom rail of the secular bull market uptrend channel and the bottom rail of the flat top expanding triangle intersect, this low may never be seen again for a very long time. What would you have thought if I showed you the 2000 low at the time, similar to the current low, and said, expect to see a bull market that is going to last for eleven years and reach 1920 before it ends? Gold was trading at 250 back then.
Back in 2000 you would have said I was crazy because Gold had been dead money for 20 years since its previous all time high that was made back in 1980 at 850. In regards to the markets, when one is called crazy for thinking outside of the box, I take it as a compliment, because when everyone is thinking the same no one is thinking at all.
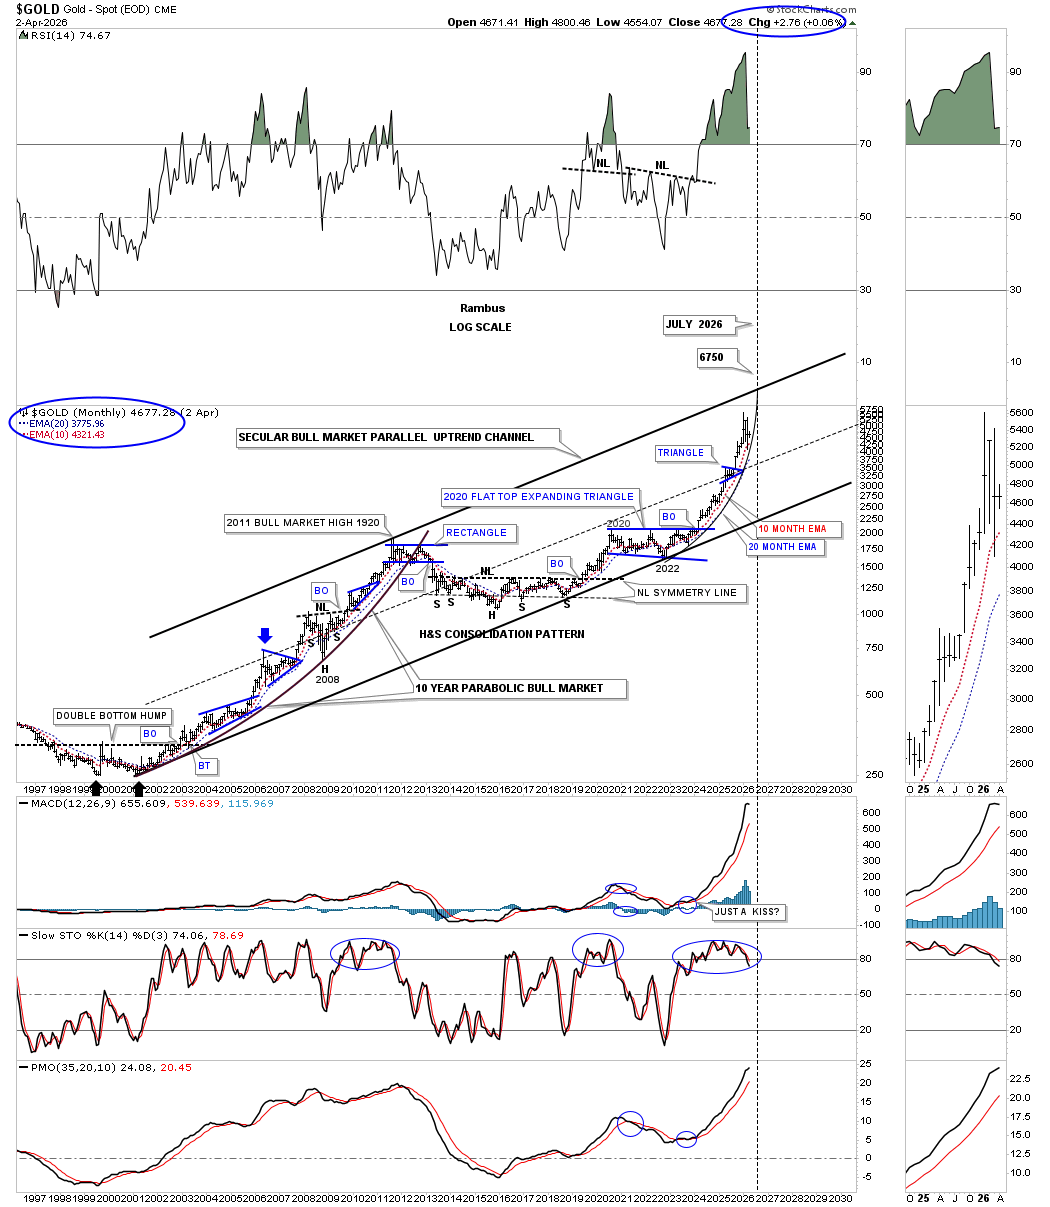
Today April 5, 2026.
Below is the exact same chart I used for the November 13, 2022 post above. Note where the bottom trend line of the 2000 secular bull market uptrend channel and the bottom trend line of the 2020 flat top expanding triangle intersected back in November 2022, which was around the 1600 area.
Also, check out the top rail of the 2000 secular bull market parallel uptrend channel on the chart above that seemed like it would take forever to reach back in 2022. The first leg of the secular bull market lasted from 2000 to 2011, so getting as close as gold got to the top trend line in January of this year, just 3 1/2 years off the 2022 low, was pretty remarkable, to say the least.
For the last couple of years or so, I’ve been showing you this monthly chart of gold’s 2000 secular bull market uptrend channel with a price objective up to the top trend line with a time and price objective up to 6750 in July of this year. That was an ambitious call and still is. Now the question is whether gold has topped out in January of this year and is beginning to build a high-level consolidation pattern before the top trend line is finally reached sometime out in the future higher up on the top trend line?
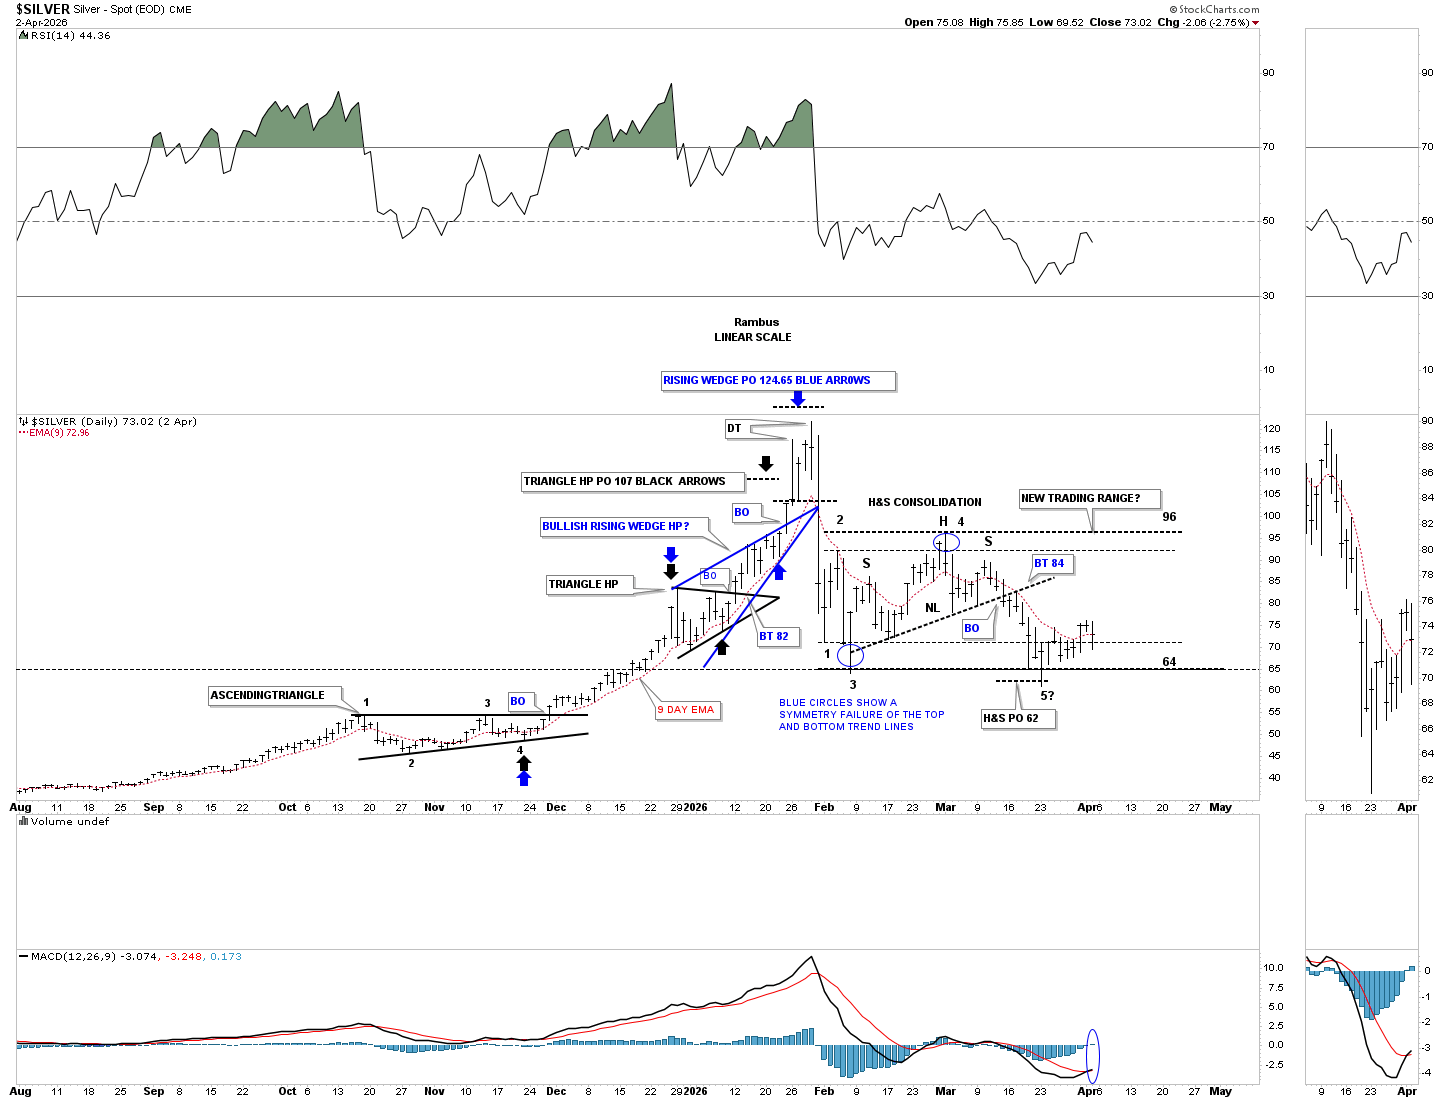
Next is a short-term daily chart for silver, which shows the black 5-point diamond reversal pattern that reached the minimum price objective down to the 2nd reversal point low in the back diamond around the 64 area. Since the reaction low off the all-time high at 121, silver has been chopping sideways for the last two months, forming a sideways trading range with no visible low-risk entry point, either long or short.
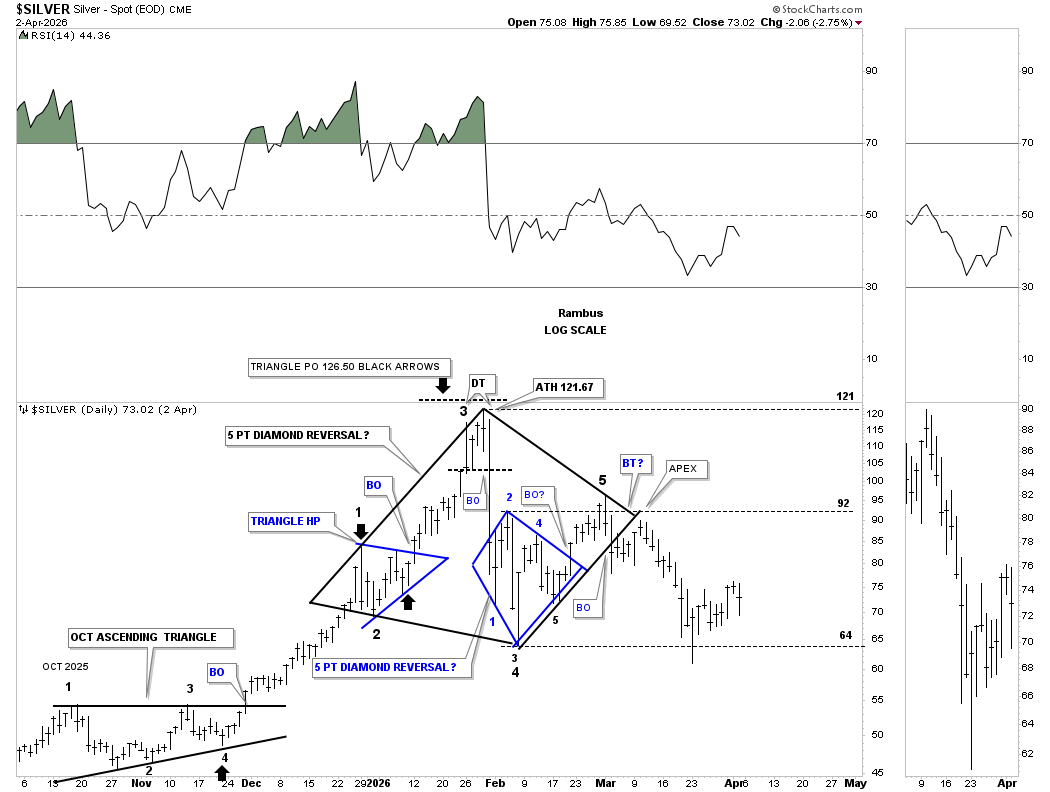
Back in March, we looked at the sideways trading range, which was showing a H&S consolidation pattern with the minimum price objective down to 62, which was achieved where the most recent bounce occurred. The blue circles show the symmetry failure of the top and bottom trend lines, thin black dashed horizontal lines, which shows the original sideways trading range expanding just a bit in both directions. If the bulls are in charge, then 64 should hold support; if the bears are in charge, then eventually 64 will give way to the downside, then 50 comes into play, where the 1980 and 2011 highs formed.
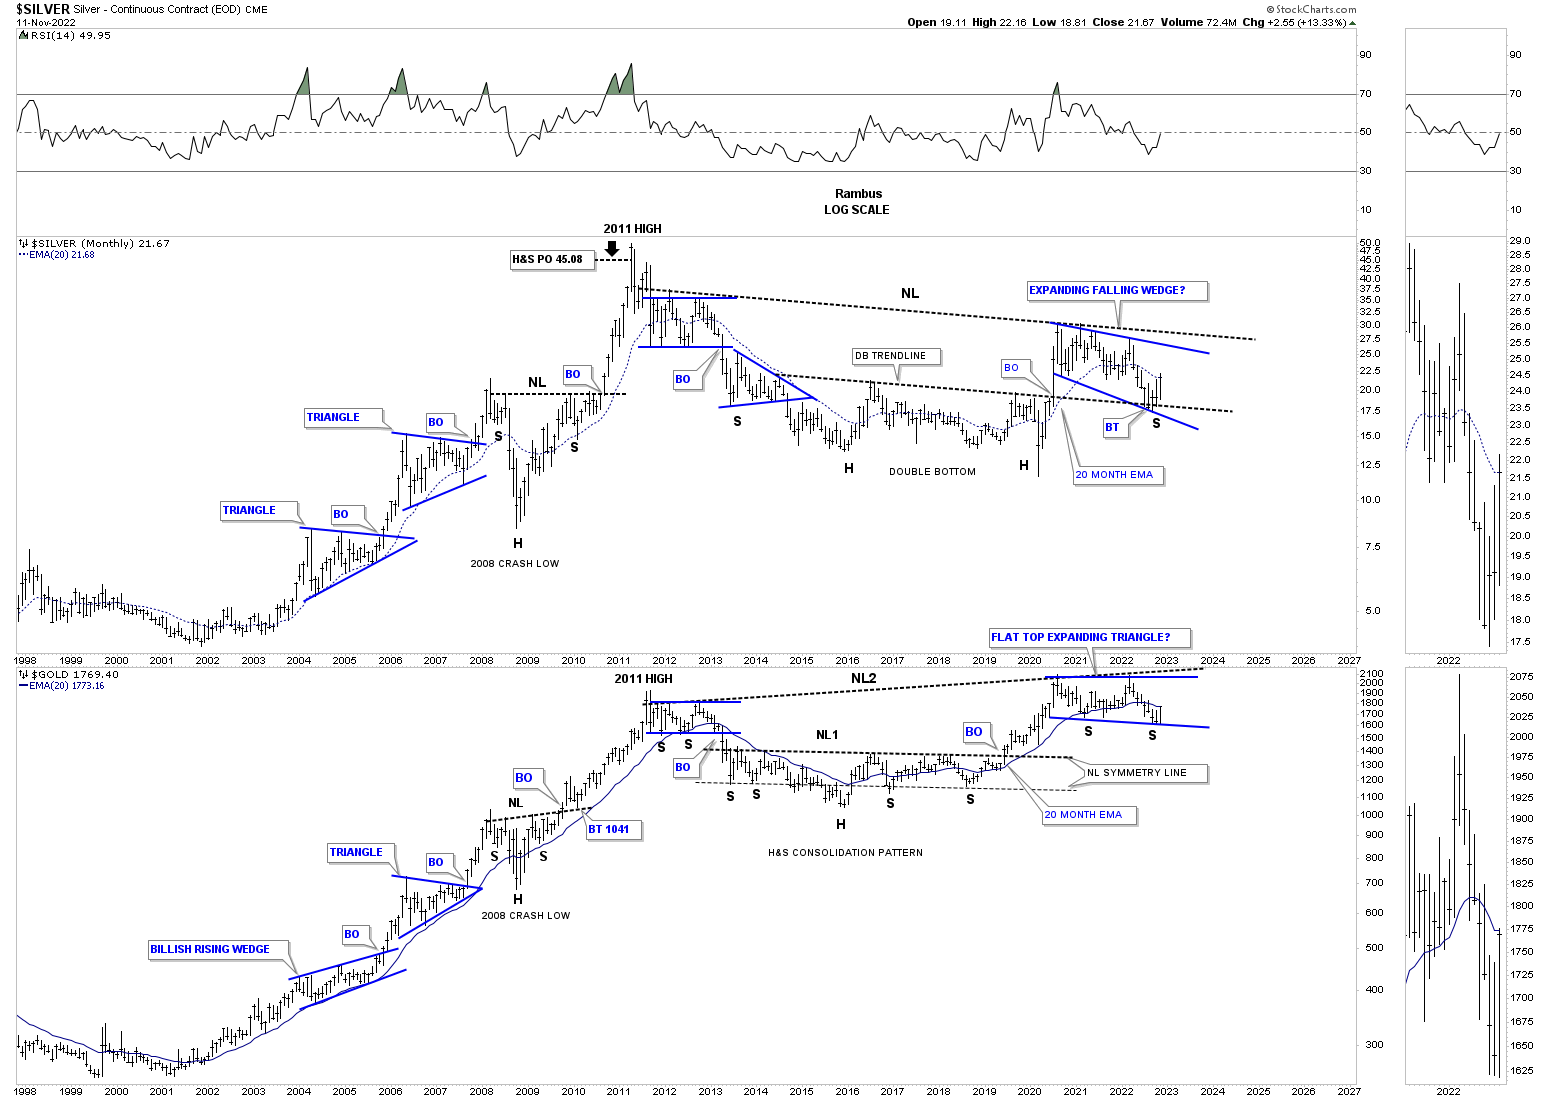
Back on November 13, 2022, we also looked at this long-term monthly combo chart, which showed silver and gold’s massive 2011 H&S consolidation pattern. As you can see, both silver on top and gold on the bottom were just completing their right shoulder low in their 2020 blue consolidation patterns.
This is what I wrote on November 13, 2022:
November 13, 2022:
This next chart is a combo chart which shows Silver on top with Gold on the bottom. I originally built these charts earlier this year when it looked like the 2020 trading range could be the right shoulder of a much bigger H&S consolidation pattern. The recent low in the PM complex put the right shoulder low in jeopardy as the price action fell below the neckline symmetry line which can show the low for the right shoulder. With that deeper low now out of the way I’ve adjusted the possible right shoulder low which shows the expanding falling wedge on Silver and the flat top expanding triangle on Gold.
During Silver’s bear market low it formed a massive double bottom while Gold formed that multi year H&S consolidation pattern. Note where Silver just pulled back to? It found support on the backtest to the double bottom trend line which is helping to create the 4th reversal point low.
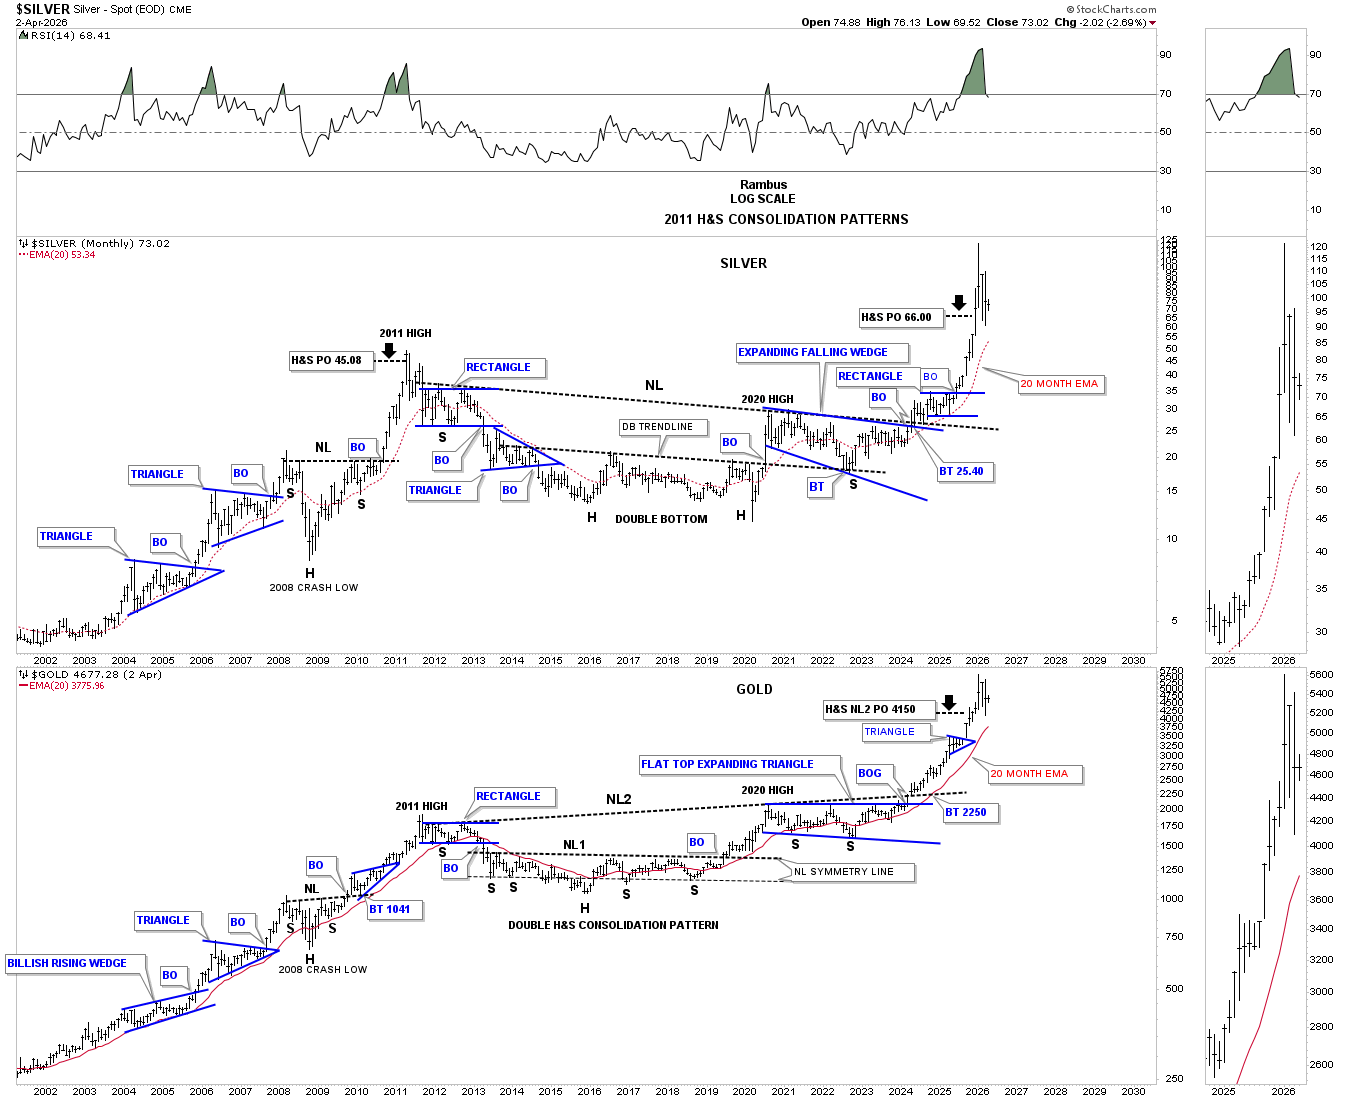
Today April 5, 2026:
I was posting this long-term monthly combo chart, which has silver on top with gold on the bottom, quite a bit before the 2011 H&S consolidation pattern necklines were broken to the upside, but haven’t posted it much since then. Both ended up reaching their minimum H&S price objective and then some. Now back to the question at hand, which few want to believe or even think is possible, is silver and gold starting to form a high-level consolidation pattern? Just like at the 2022 low, we won’t know for 100% certainty until we can look back in hindsight.
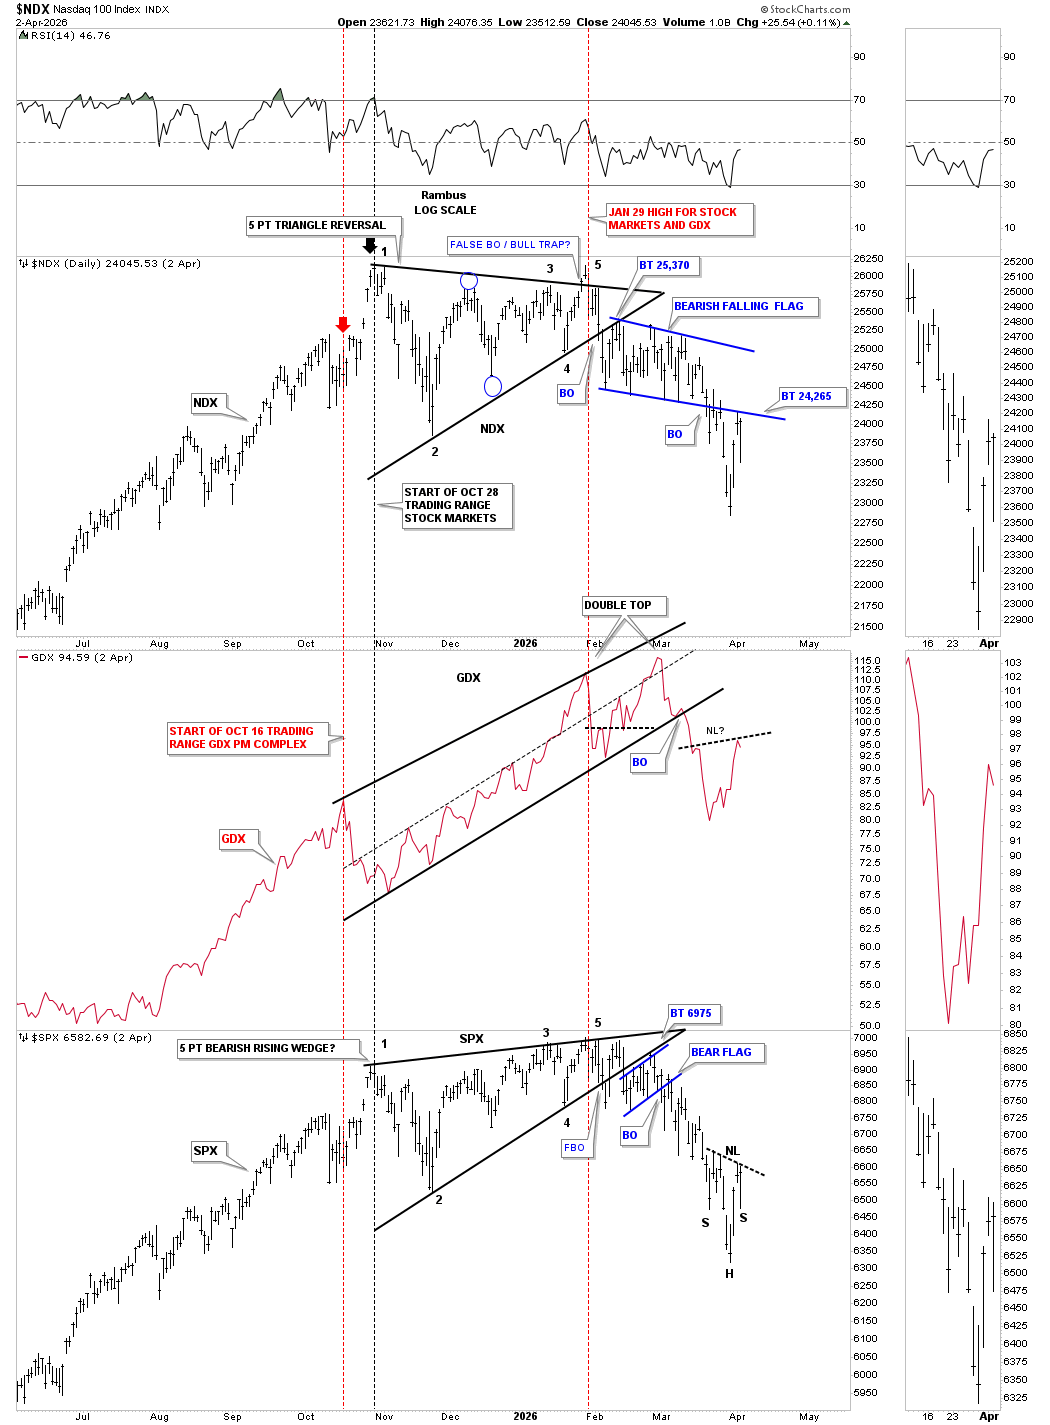
Next is a triple combo chart, which has the NDX on top with the GDX in the middle and the SPX on the bottom, which I built several months ago, showing how the PM complex and the US stock markets have been moving together, both up and down. It’s not a perfect positive correlation by any stretch of the imagination, but close enough to pay attention to.
As you can see, the most recent low made last week on the NDX and SPX has the GDX in a countertrend rally. What I’m focusing on right now is what is going to happen with the NDX and the SPX. If they’re putting in a short-term low, then the odds favor the GDX is also forming a short-term low. If the short-term low fails, then I expect all three to move lower. Note the possible H&S bottom on the GDX; if the neckline is broken to the upside, that would suggest the stock markets will also move higher, and vice versa if it fails.
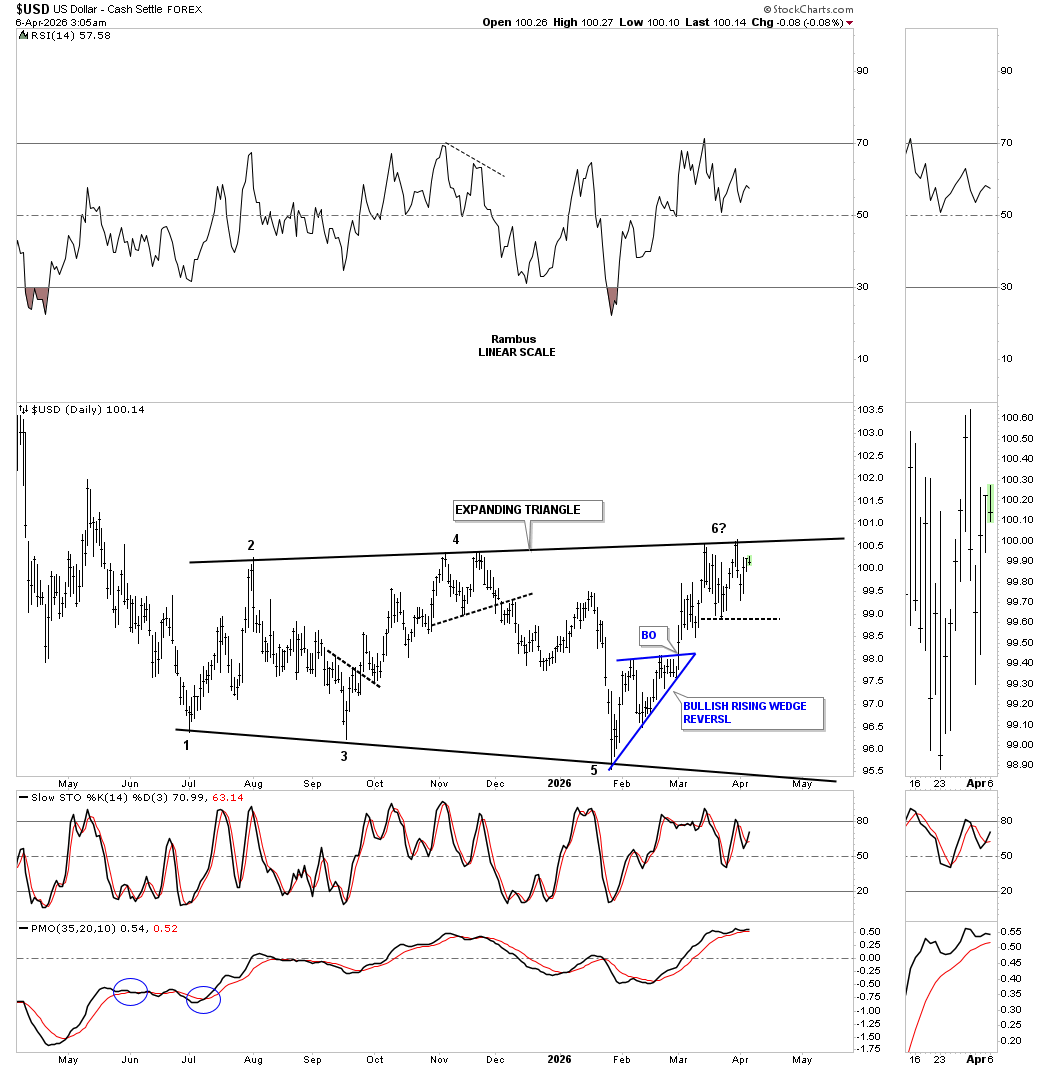
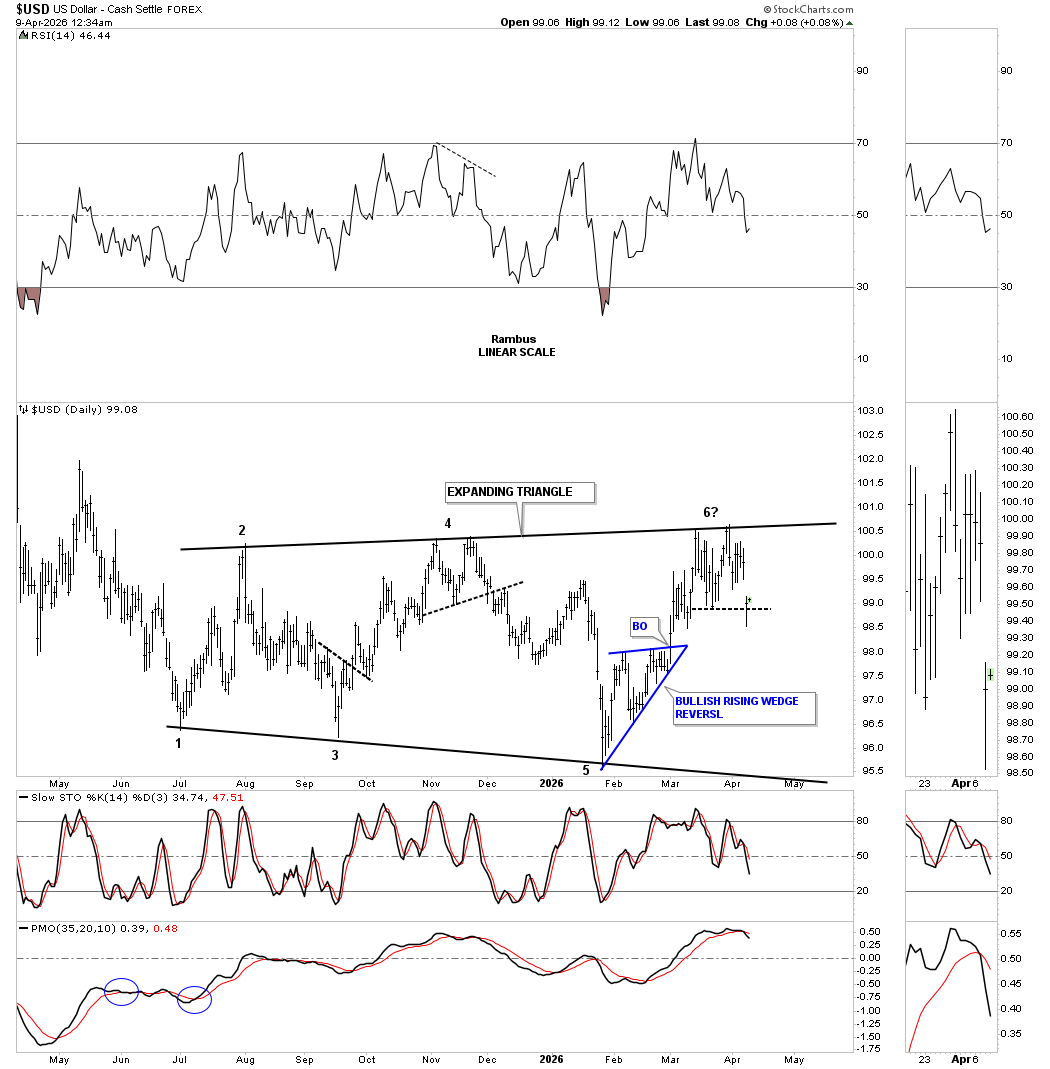
Next is a new daily chart for the US dollar I just built this weekend, after I noticed the top rail the trading range is slightly up slopping. What would be very bullish for the PM complex is if the US dollar forms a double top, just like it did at reversal point #4. The pattern is complete, but we don’t know if it’s going to be a bullish or bearish expanding triangle.
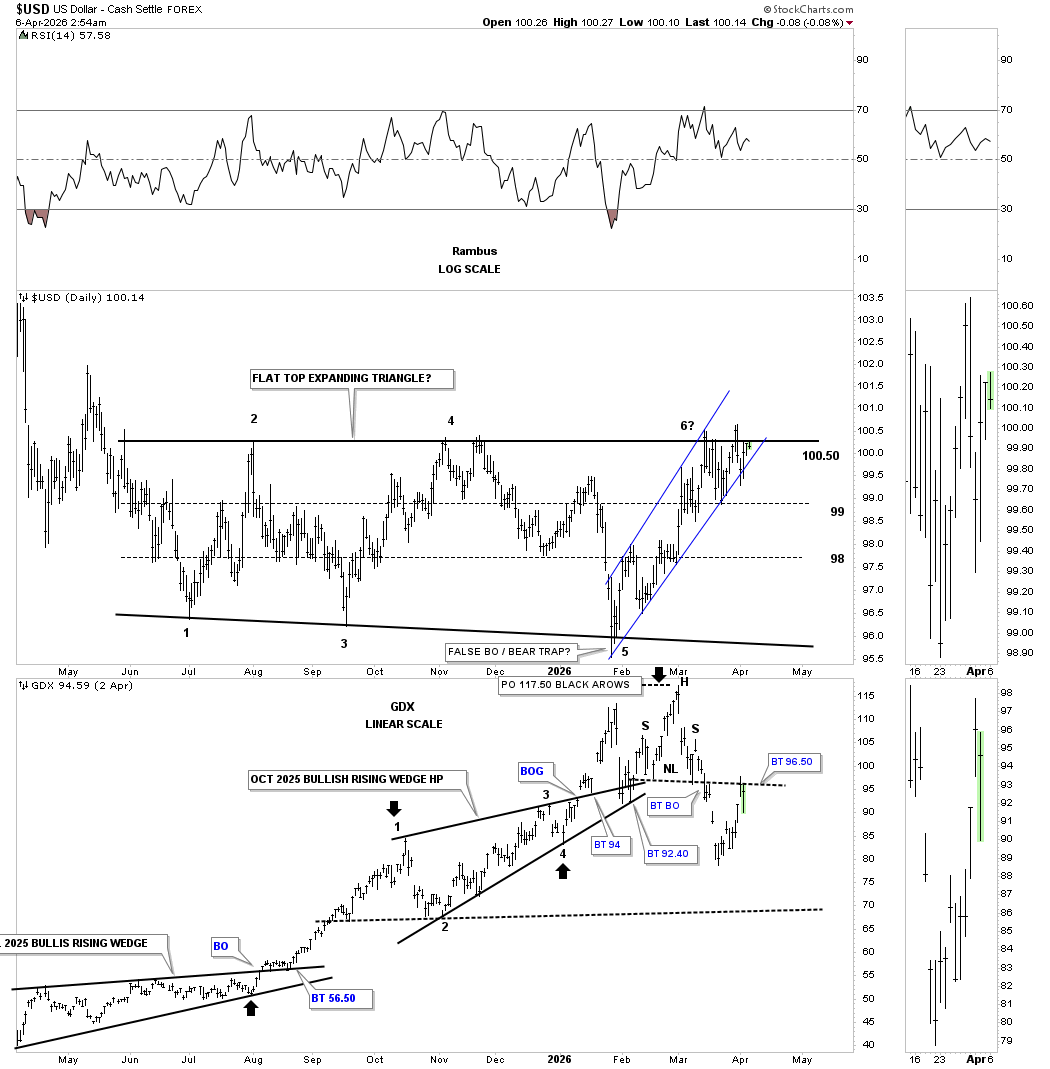
Below is the original daily combo chart we’ve been following, with the US dollar on top and the GDX below.
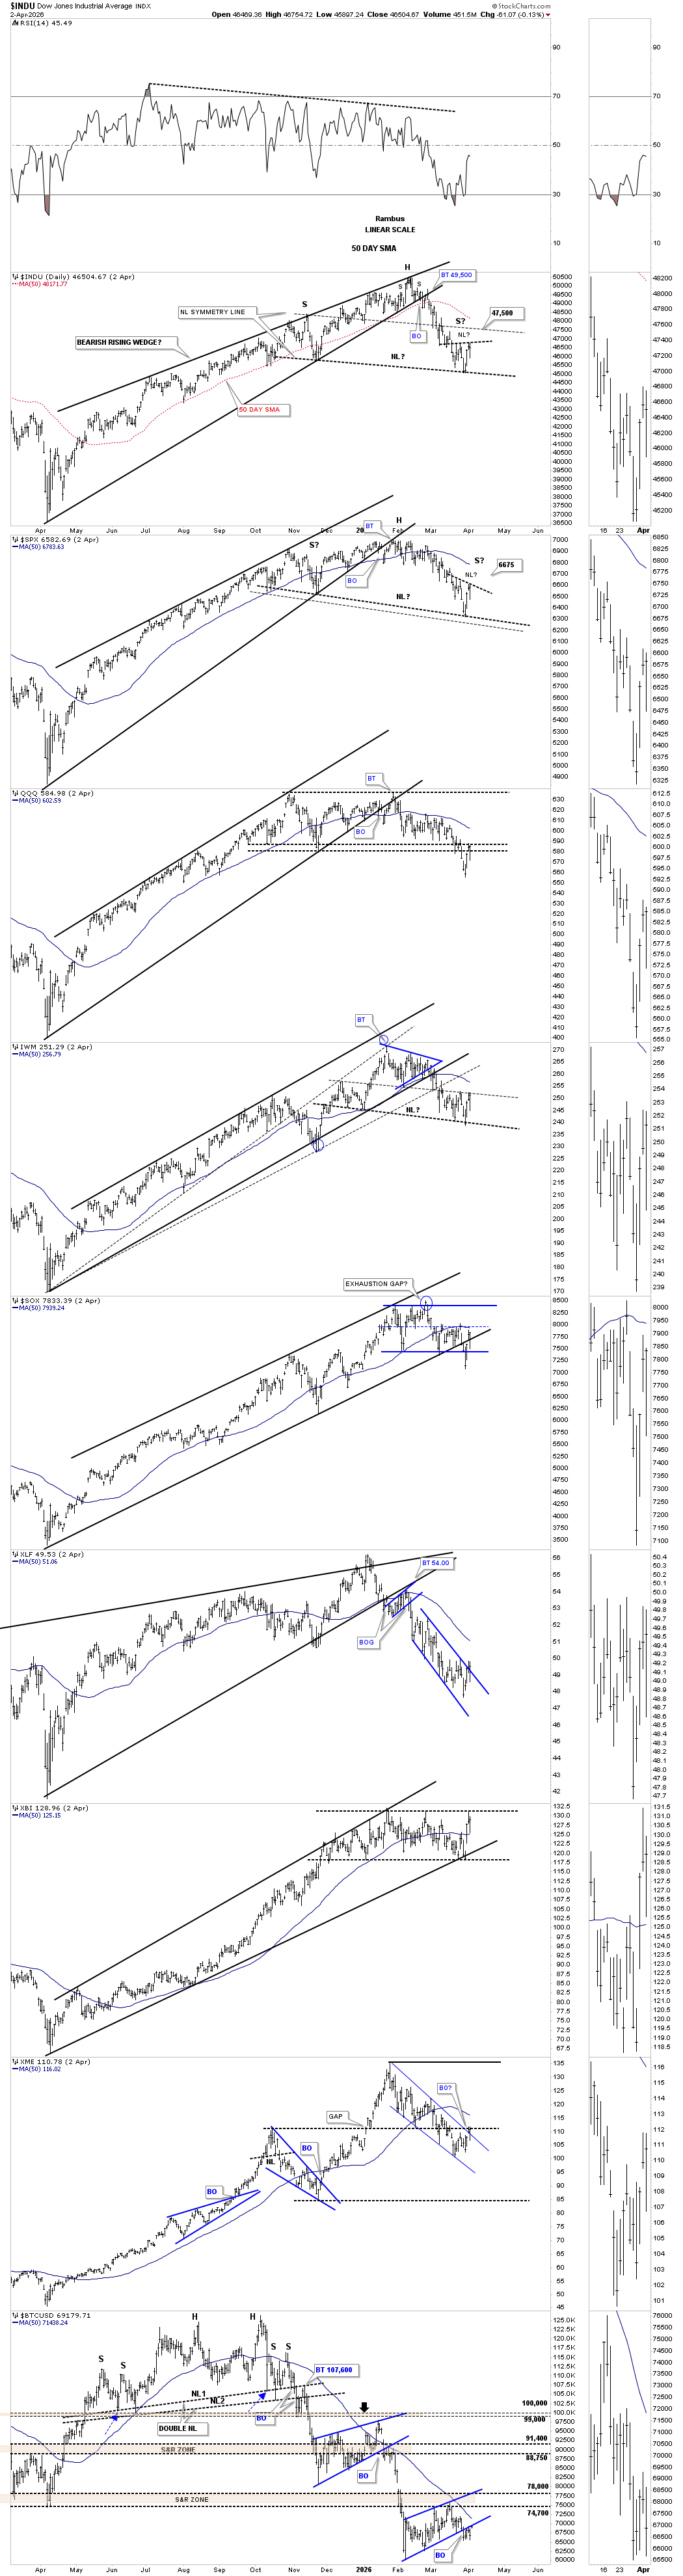
Let’s finish up by looking at a couple of combo charts for the US stock markets. First is the daily bar combo chart, which shows the price action getting a bounce last week, with the INDU and SPX forming a possible small H&S bottom, which could be forming on top of a potential larger H&S top neckline.
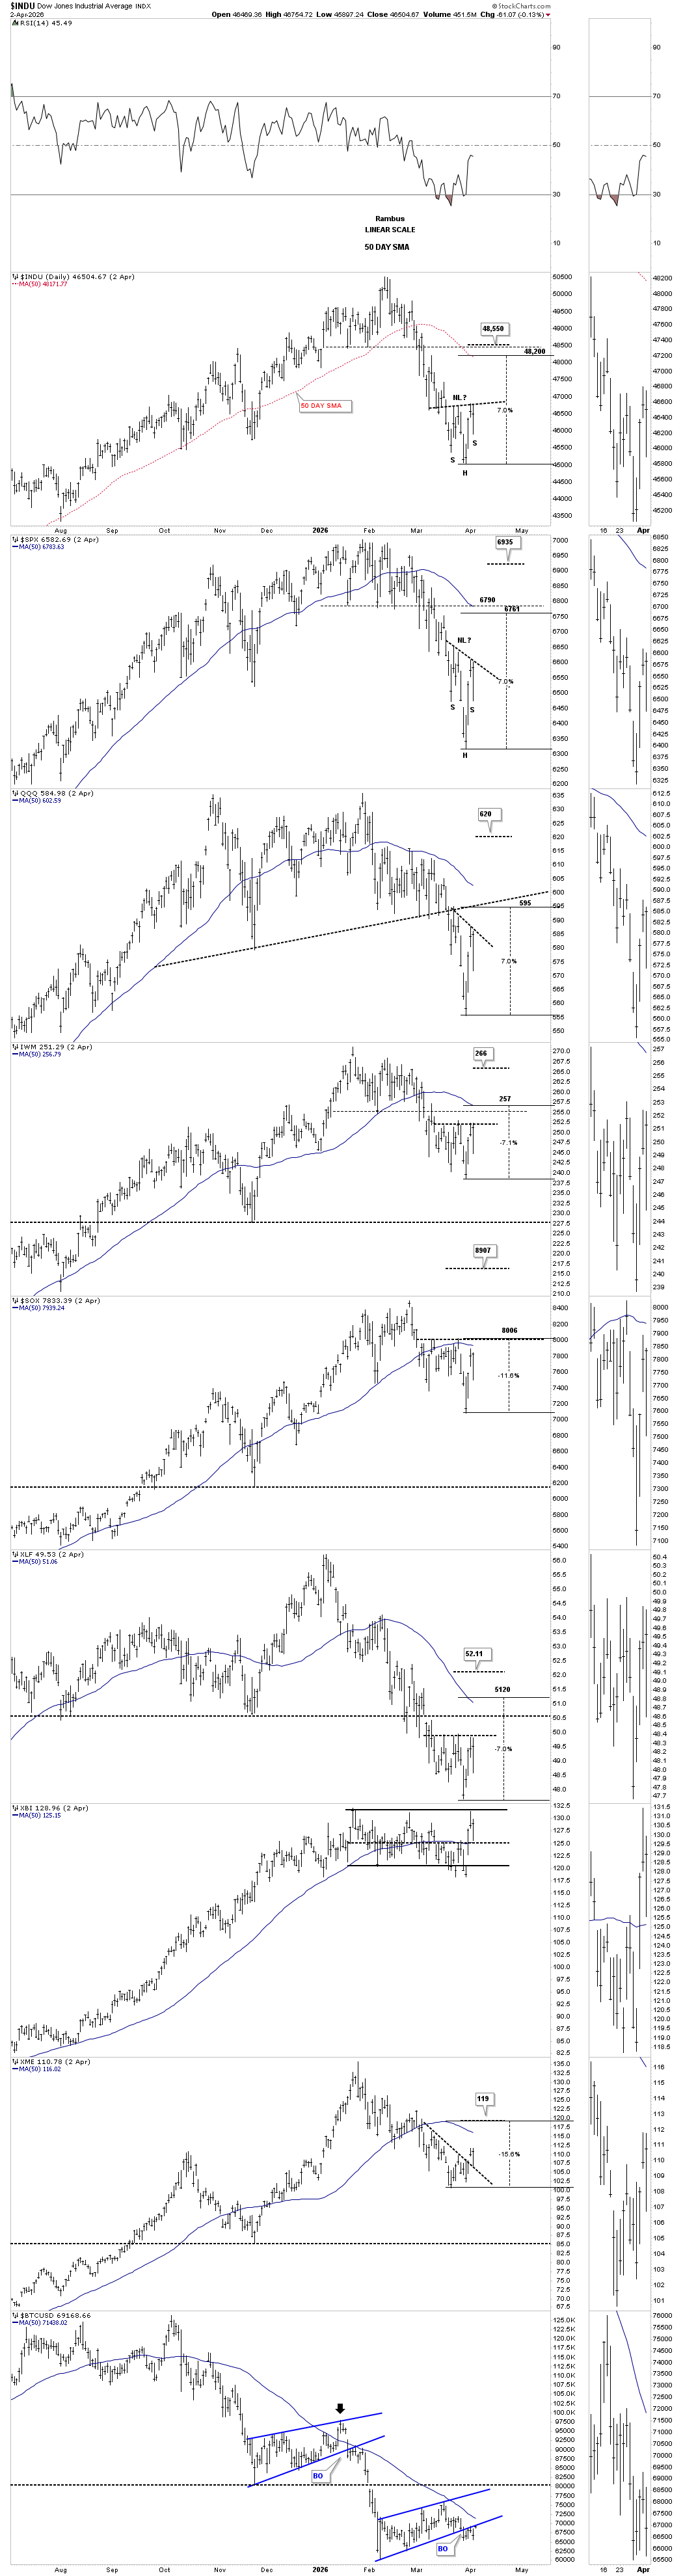
Below is a new short-term daily combo chart, which shows the possible small H&S bottoms that could lead to a countertrend rally. The US stock markets have declined roughly 10% off the all-time highs, so a standard 5% to 7% countertrend rally would be about half over at 7%.
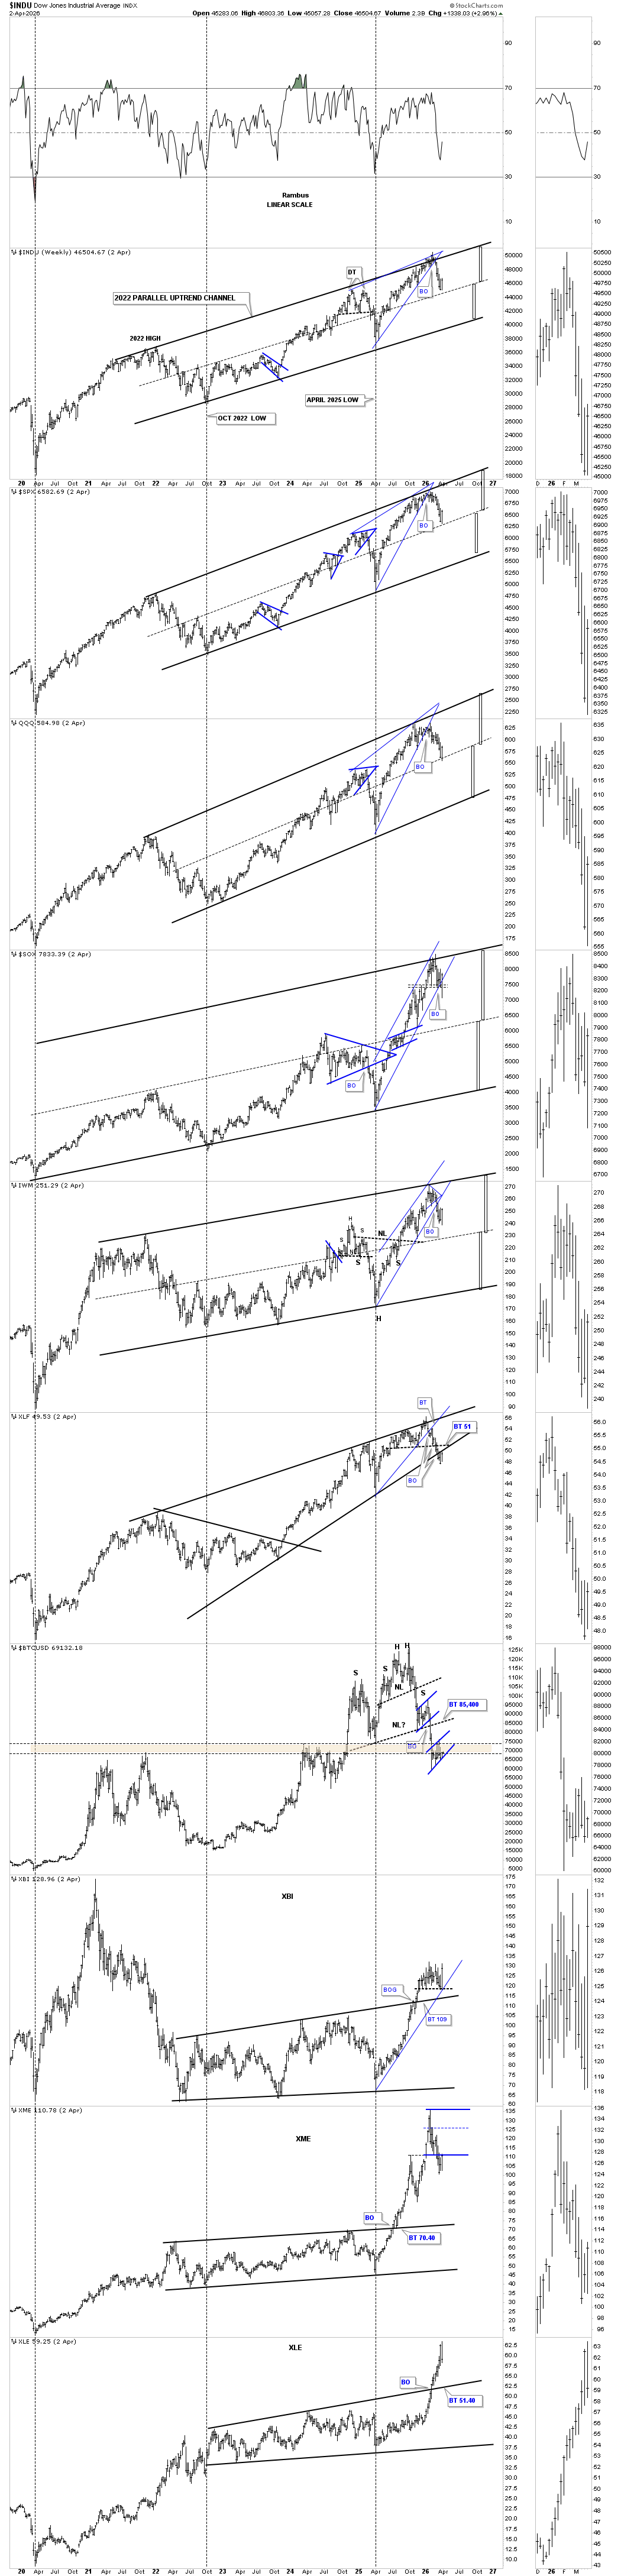
This weekly combo chart shows the current bounce starting off the center dashed midline on many of the indexes.
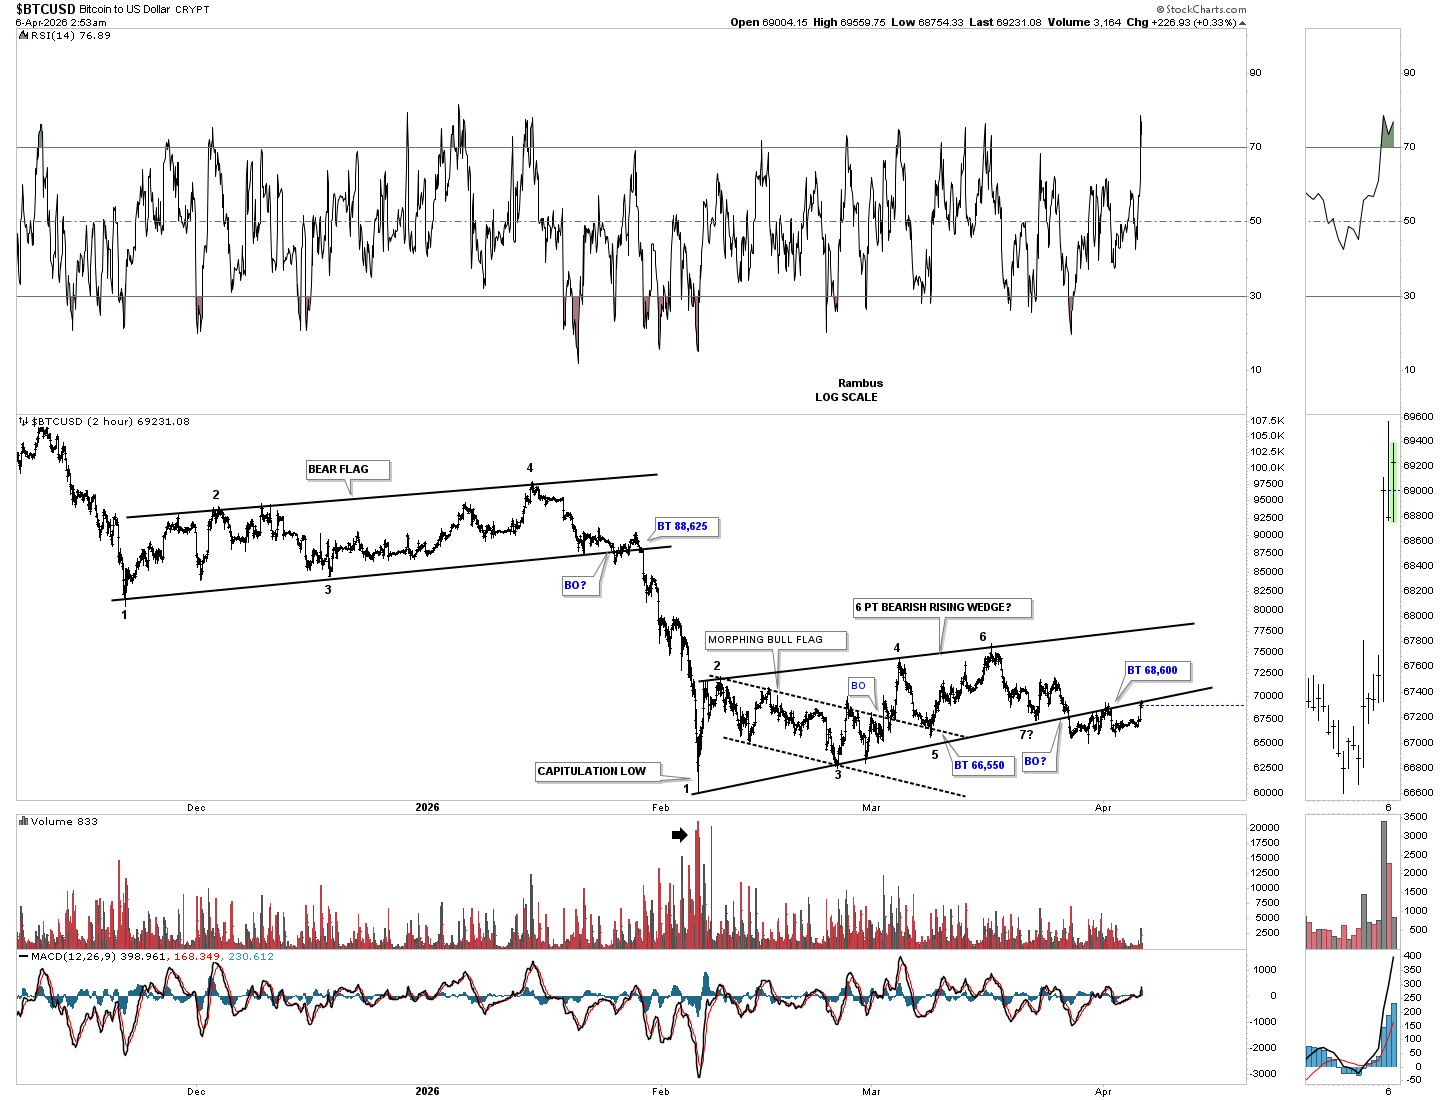
This last chart for tonight is the 2-hour chart for BTCUSD, which keeps hanging around the bottom rail of the rising wedge as the backtest. Any move above the bottom trend line, I’ll exit the short trade in SBIT.
I wish I could be more confident in the direction of the markets, but sometimes there isn’t enough information. Always remember cash is an option too. All the best…Rambus
H&S Bottom or Double Top Reversal Pattern?
It was a very interesting day in the PM stock indexes today. As you know, we’ve been following two important chart patterns: the H&S bottom that has been forming at the most recent low and the January double top. Today, the neckline was broken to the upside on the PM stock indexes, and at the same time, the possible double top trend line was hit, completing both patterns. We know we can’t have a bottom and top completing at the same time, so one is lying to us, which we should know the answer to in the next day or two.
Starting with this, the first day chart for the CDNX today, the price action reached the minimum measured move price objective at 1010, which is just below the apex of the 5-point diamond reversal pattern.
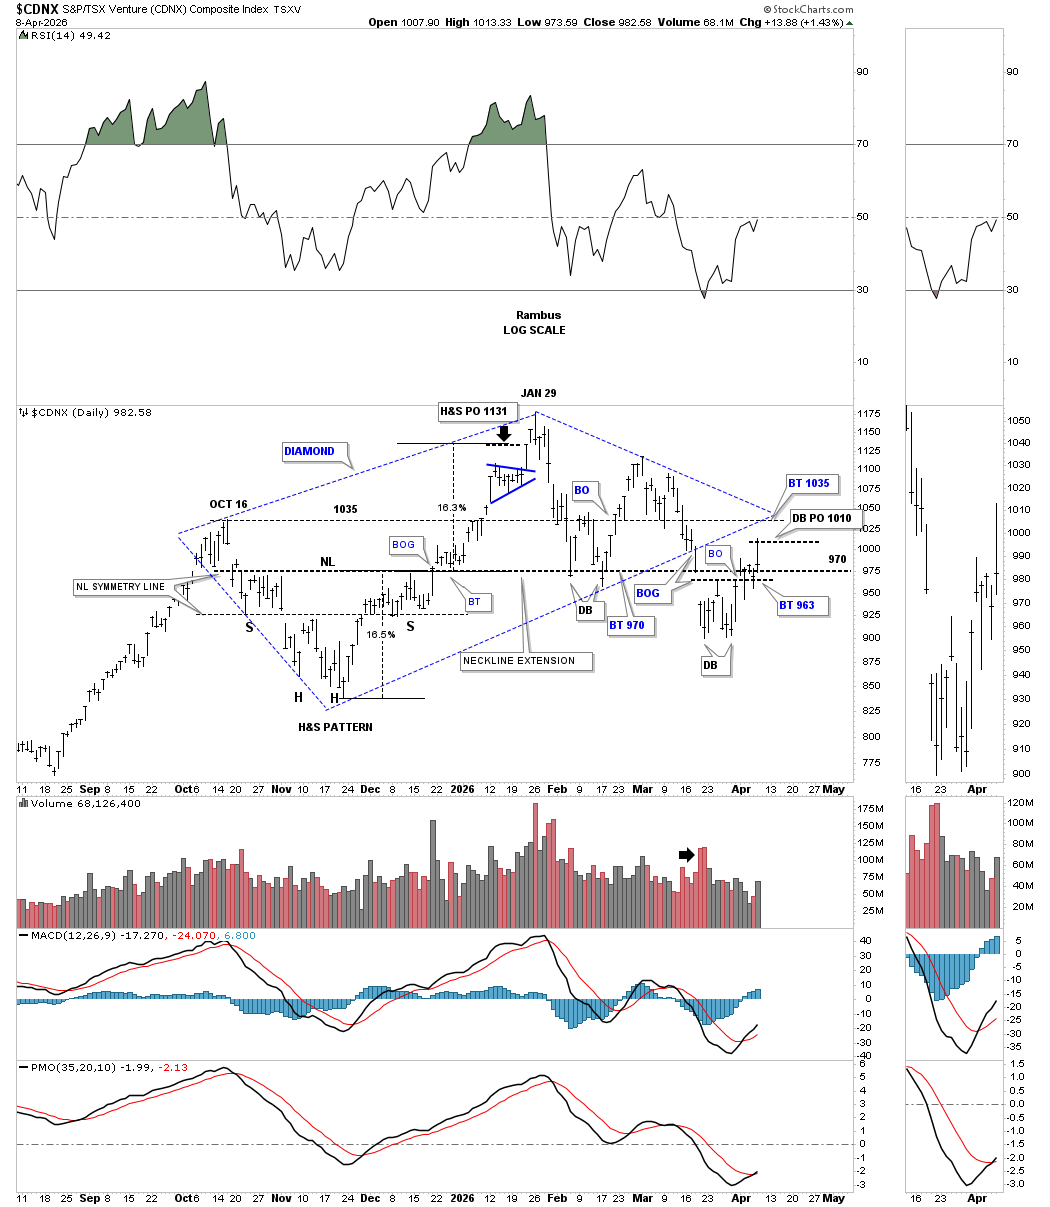
The first step in negating the 5-point diamond reversal pattern would be a run around the apex to the upside, which is roughly 1035 or so. As long as the apex holds resistance, the bears are in charge.
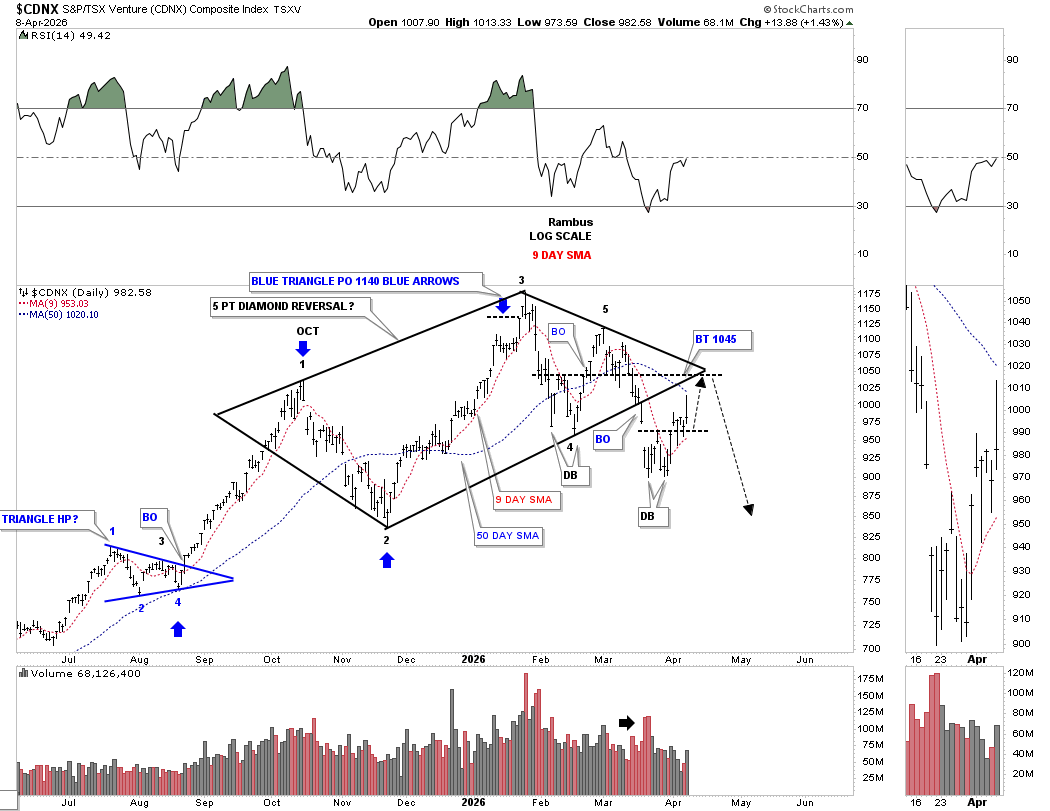
This long-term daily chart shows the diamond reversal pattern in isolation, with the near backtest today to the bottom trend line. Depending on tomorrow’s price action, CDNX may have put in a daily reversal bar today.
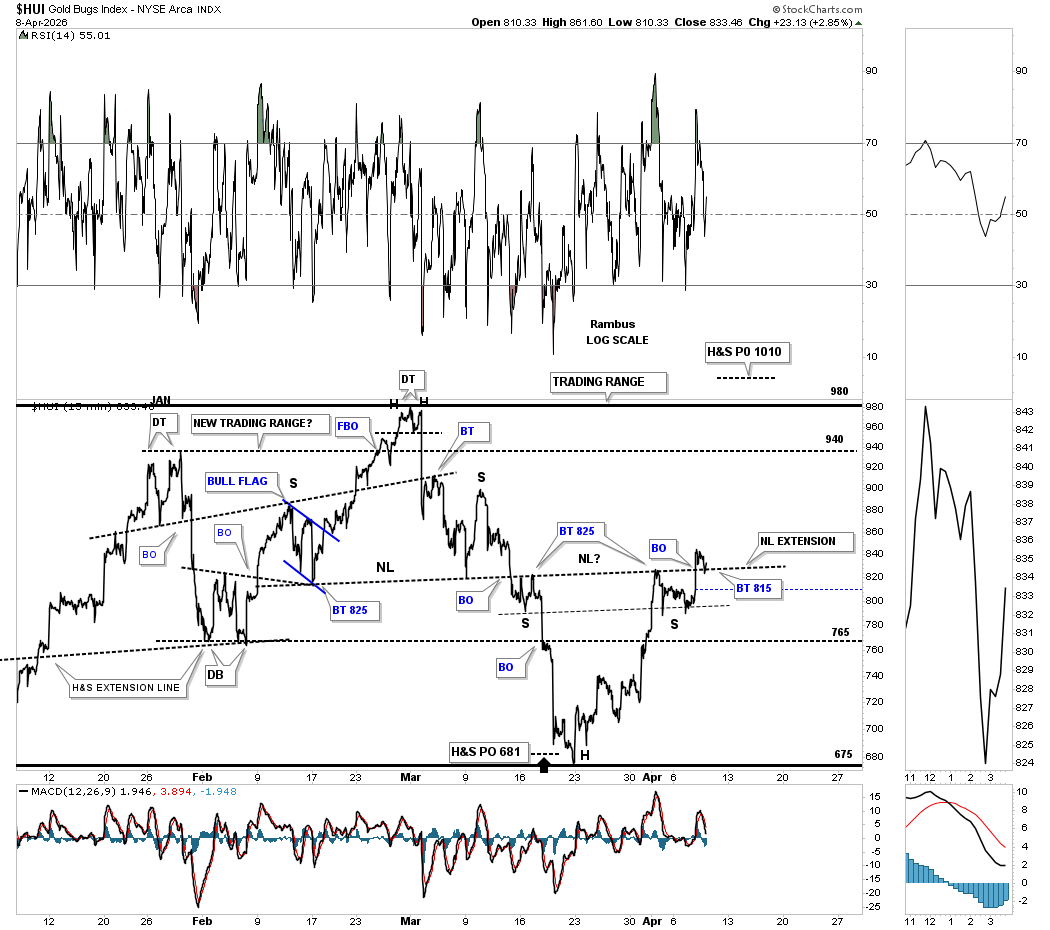
Now for the HUI, which shows the H&S bottom forming at the most recent low. This 15-minute line chart shows the breakout and the backtest at the end of the day to the neckline. Note how the neckline taken from the H&S top is forming the neckline for the H&S bottom, neckline extension line. Tomorrow is going to be a critical day to see if the backtest holds support.
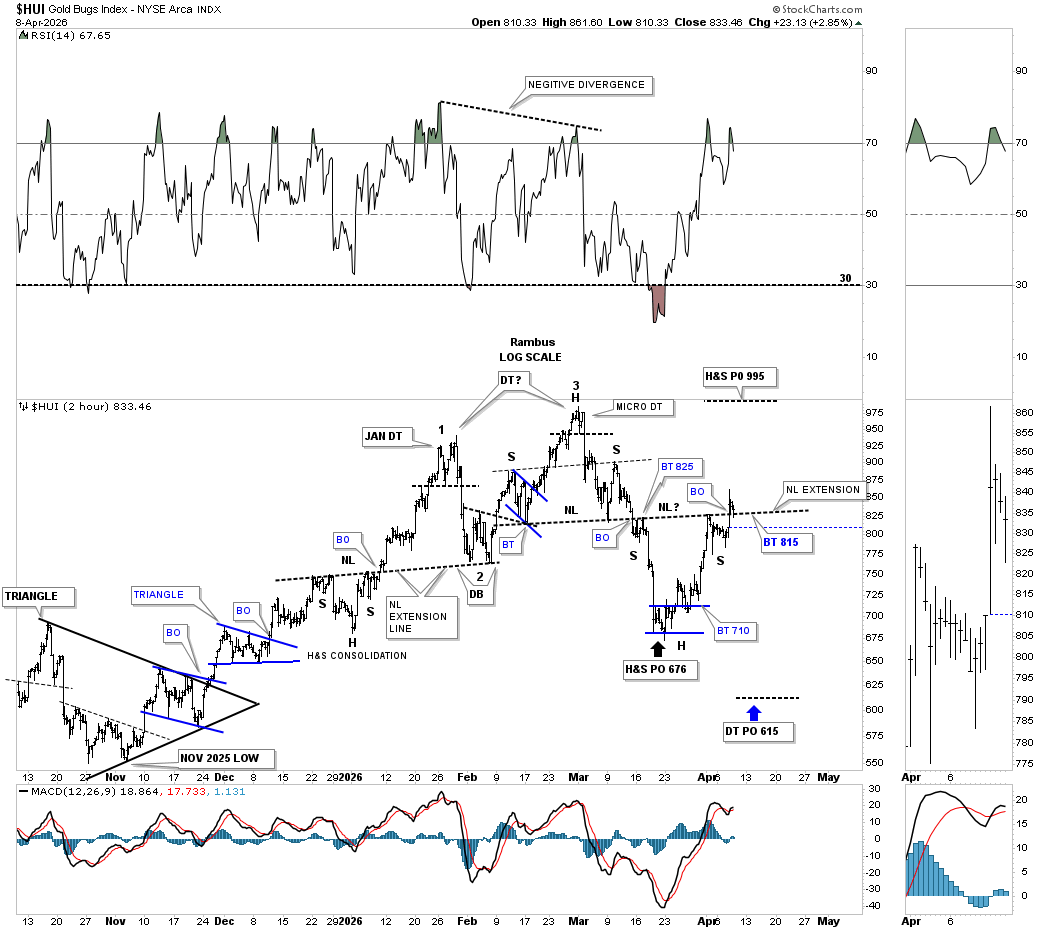
This 2-hour chart shows the same H&S top neckline extended to the right side of the chart, which is forming the neckline for the H&S bottom. Here again, you can see the backtest at the end of today. The H&S top price objective was reached at 676 last week, which so far is forming the head with that micro double bottom. I’m not showing the double top on these minute charts because they’re already pretty busy looking, but if the double top is still in play, then its measured move price objective would be down to the 615 area, as shown by the blue arrow.
Next is the daily line combo chart that began forming the bearish rising wedge back in October of last year. From this line chart perspective, you can see the current H&S bottom with the shallow left and right shoulders, shows the breakout above the neckline today with no backtest yet.
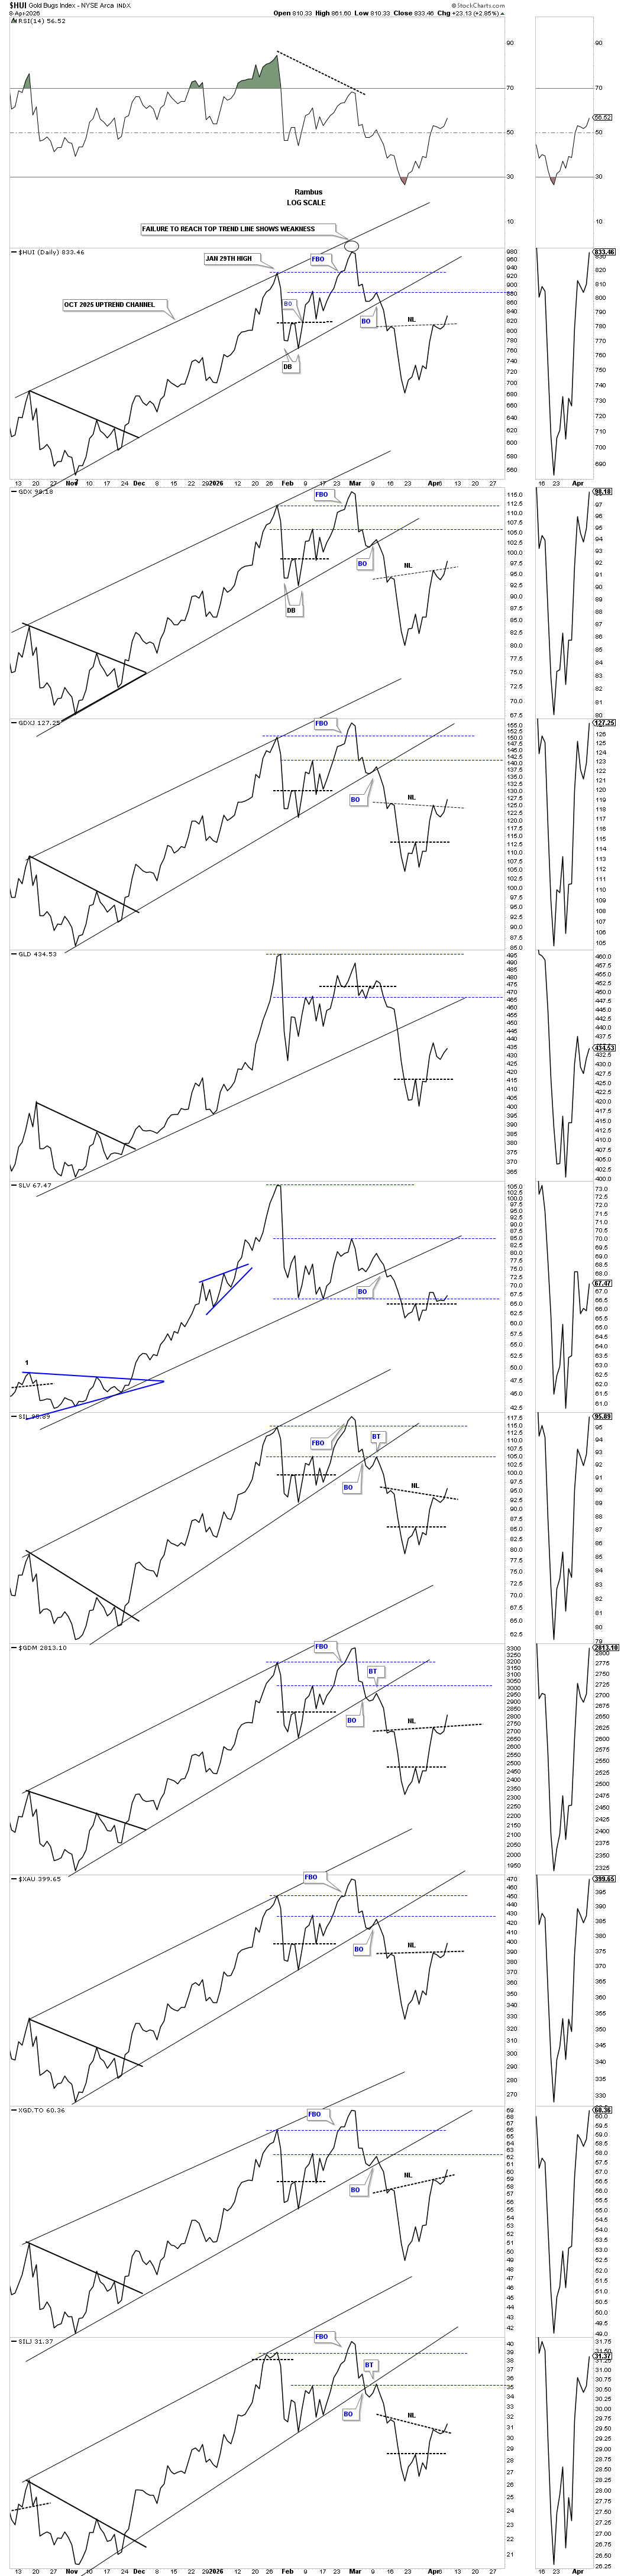
Since the January 2026 high, I’ve been suggesting that the PM complex is forming a high-level consolidation pattern, which still has a lot of work to do yet. If this possible new trading range is under construction, then the 1st reversal point is complete, with the 2nd reversal point to the upside in progress.
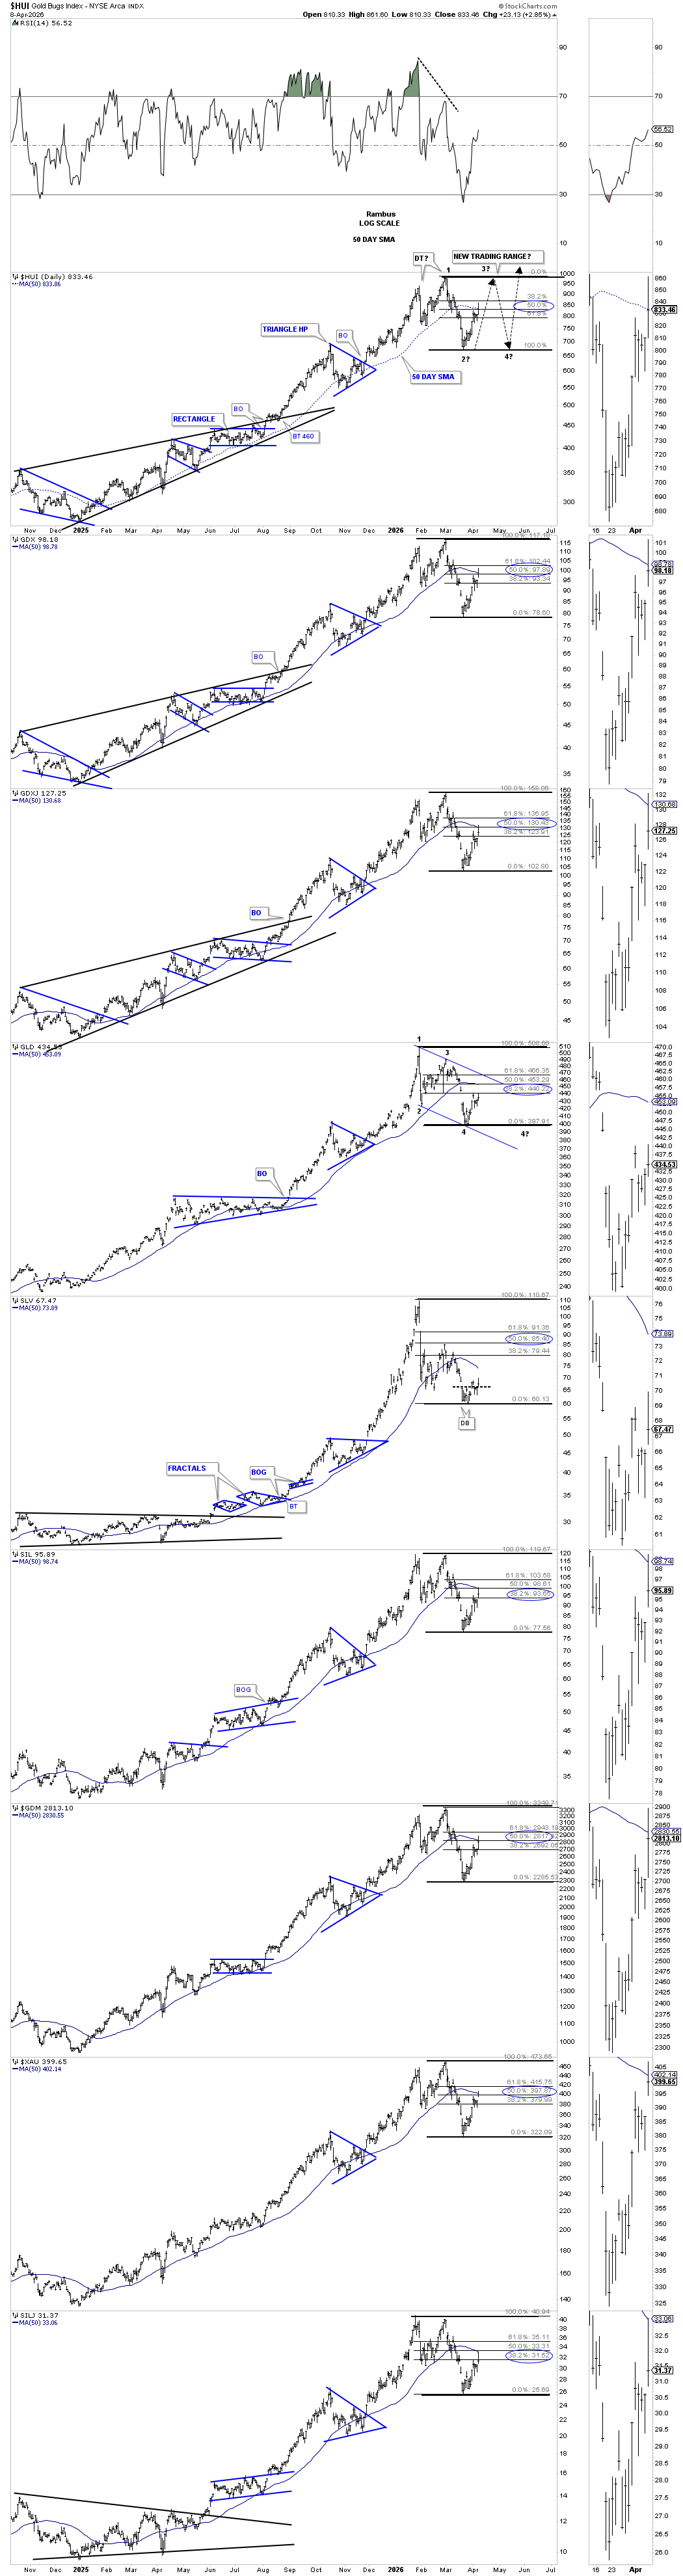
So far, the current rally has retraced roughly 50% of the decline, with a few getting close to the 61.8% area. Where the 2nd reversal point high is located, we’ll need to see one more decline to put in the 4th reversal point low. At this early point in the trading range, there is still no way to know what type of consolidation pattern may form. If the H&S bottom plays out, it strongly suggests the top of the trading range will be reached. If a triangle is forming, then we’ll see a lower high and a higher low, and if a falling wedge or flag, lower highs and lower lows off the 1st reversal point high; see GLD as an example, which has retraced 38% of its move down. SLV is still lightyears away from its 38% retrace. In most of the indexes, the 50-day SMA is starting to roll over, which hasn’t been the case since the January 2025 low well over a year ago.
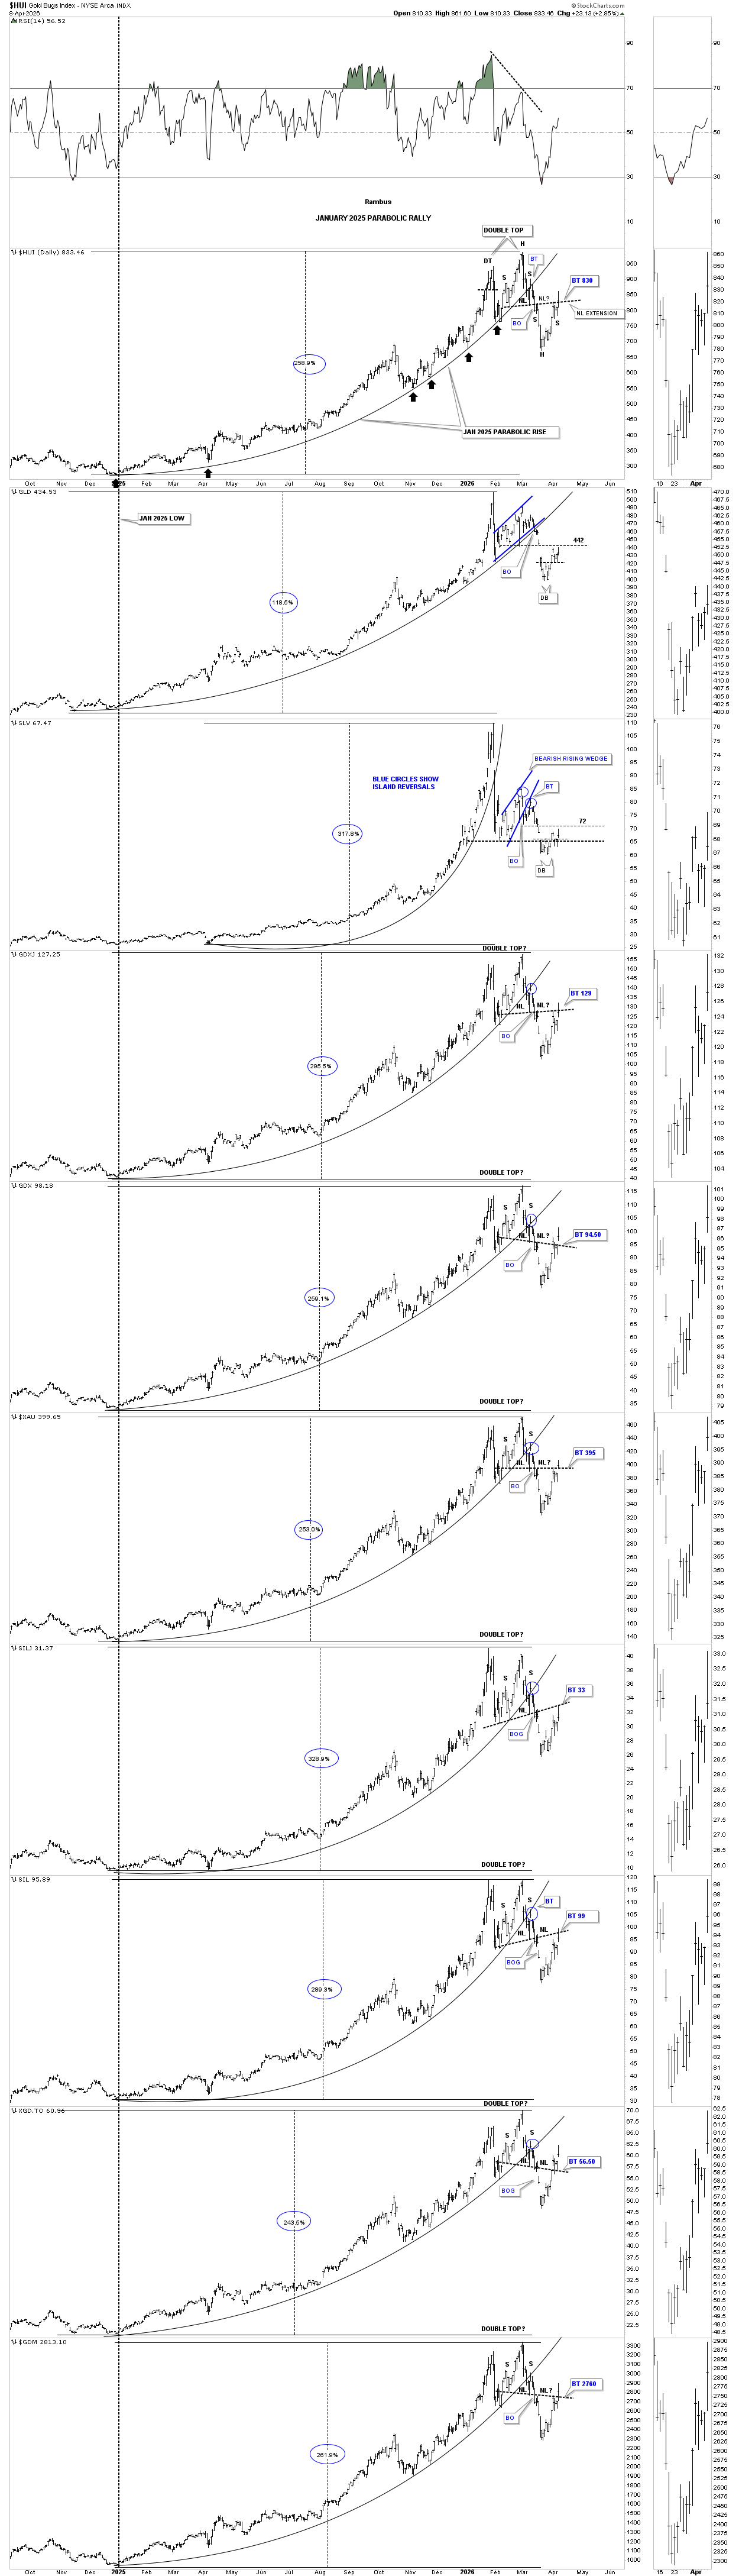
Next is the daily chart showing the January 2025 parabolic arc with the H&S top forming the right side of the double top. Note the strong breakout today above the H&S bottom neckline with a breakout gap.
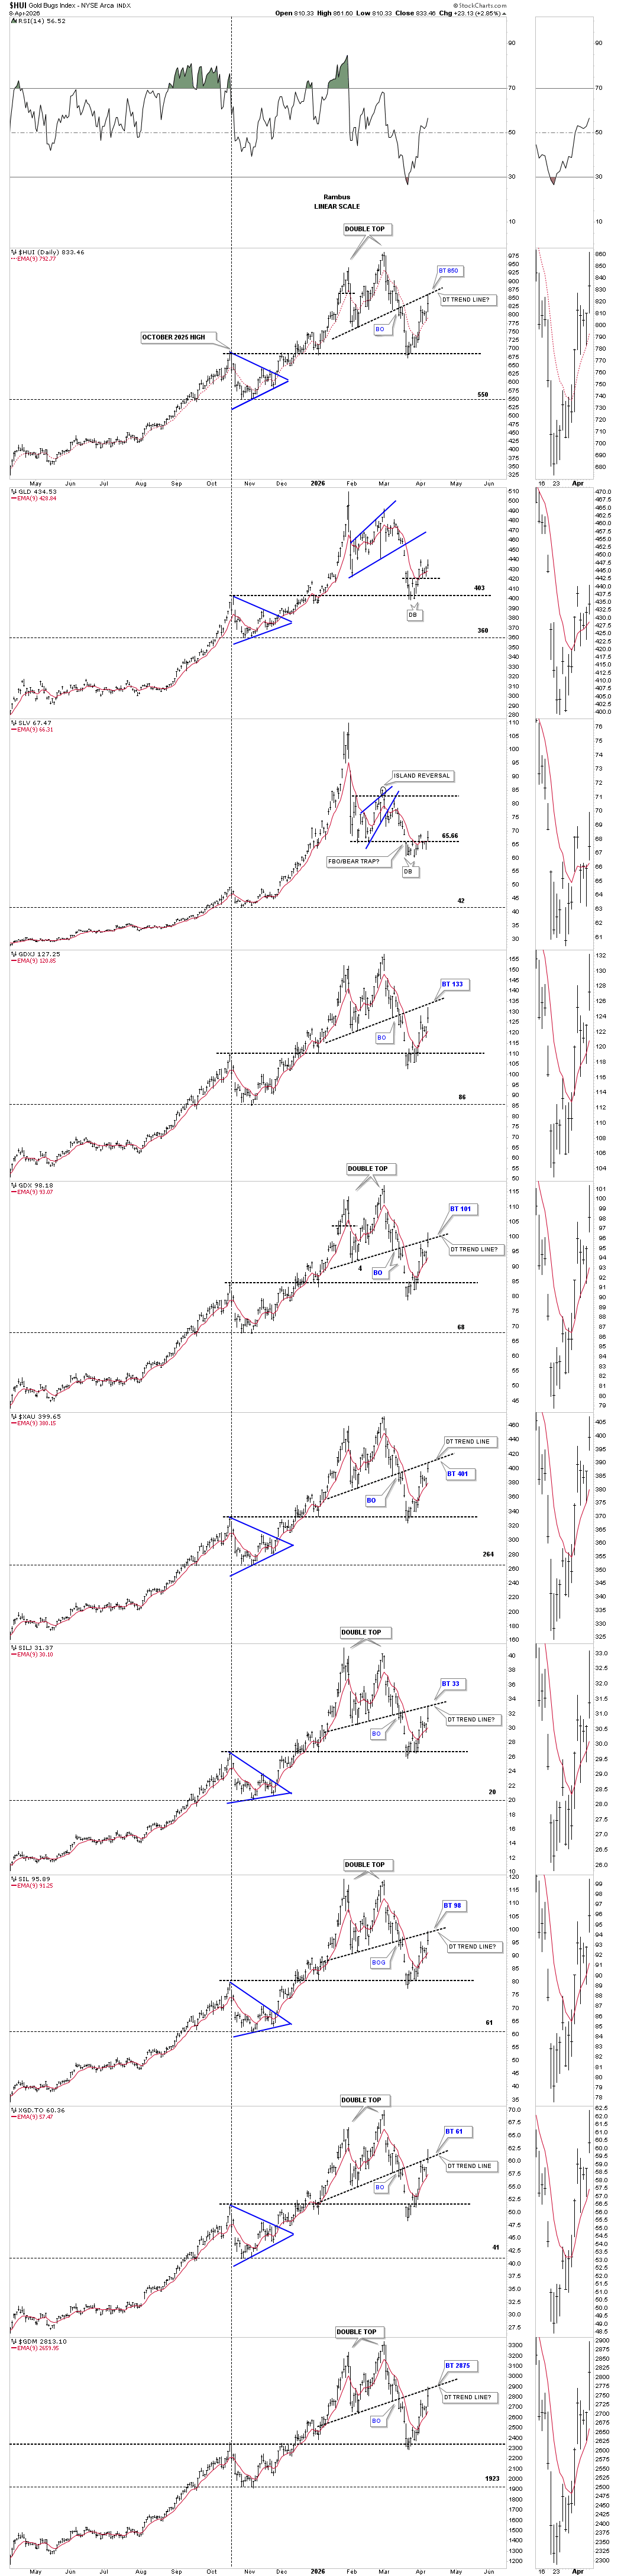
I mentioned at the beginning of this post that the possible double top reversal pattern is still in play. The last time we looked at this combo chart, I mentioned that the double top trend line was pretty steep, but we’ve also seen strongly slanted necklines that played out. You can see a couple of sight breaches of the double top trend line today, but for the most part the strong rally was halted at the double top trend line. Any closing price above the double top trend line will negate the double top and show the January trading range as the dominate pattern.
I’m out of annotations, but note how the top of the blue triangle, that formed on the way up, held support for the most part during the recent decline. Back to the question at hand, is the H&S bottom or double top reversal pattern going to prevail?
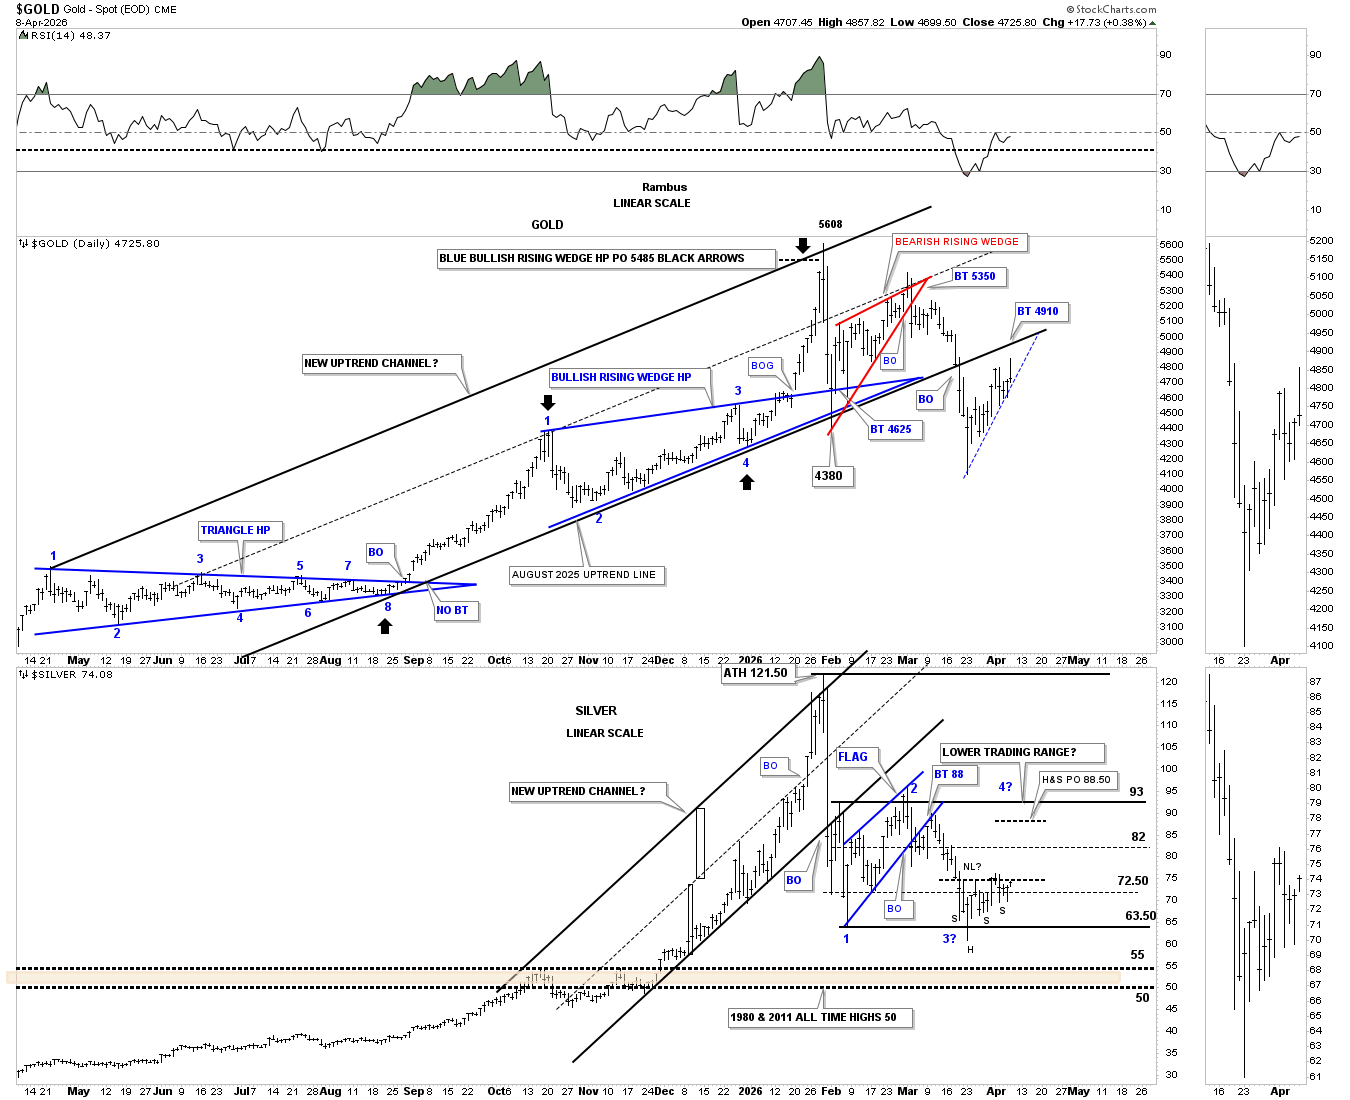
Next up is the daily combo chart, which has gold on top with silver below, showing their uptrend channels. Back in early March, gold broke below the bottom rail of its uptrend channel and has been in backtest mode ever since.
Silver broke below the bottom rail of its uptrend channel much earlier than gold and shows the initial backtest right after the breakout. Silver is trying to form an ugly H&S bottom, which, if it completes, will have a price objective up to the 88.50 area.
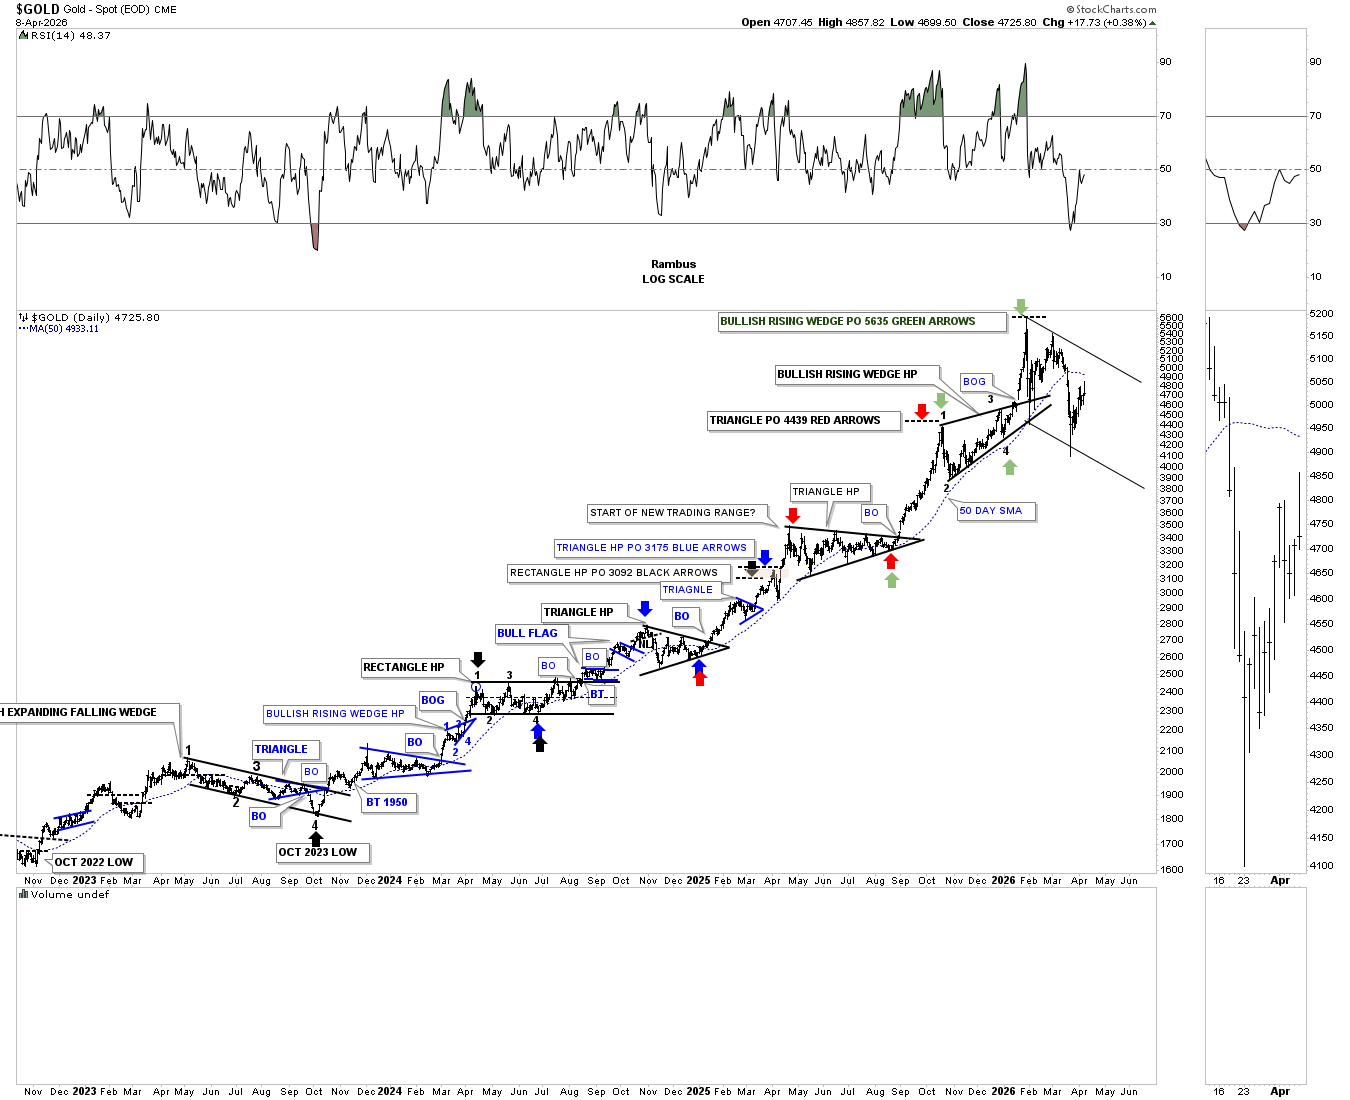
This next chart for gold is one we were following very closely from the very beginning, which shows all the consolidation patterns that formed this massive bull market rally and all the measured moves as shown by the colored arrows.
The last measured move price objective was up to 5635, as shown by the green arrows. Since that January high, gold has made the first series of lower highs and lower lows since the black bullish expanding falling wedge was made in late 2024. If this particular leg of the secular bull market still has legs, gold could be forming a bull flag. On the other hand, the price action could stay confined to the downtrend channel for an extended period of time.
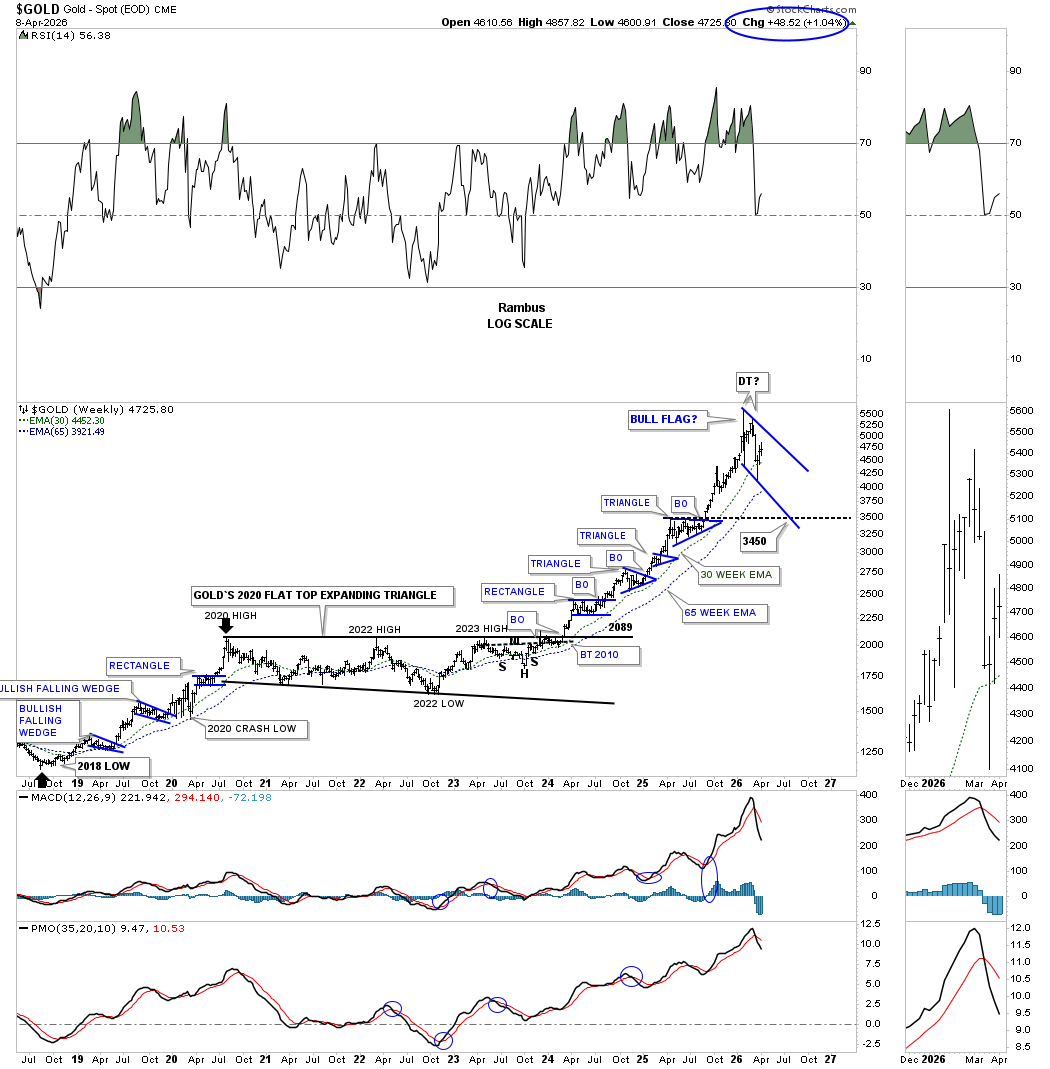
This weekly chart shows all the small blue consolidation patterns that have formed this leg of the bull market, which is an amazing amount of consolidation patterns for one leg. Normally, you’ll see two or three small blue consolidation patterns forming in a normal bull market rally, as shown on the bottom left side of the chart during the rally into the 2020 high, where the bullish flat-top expanding triangle began to form.
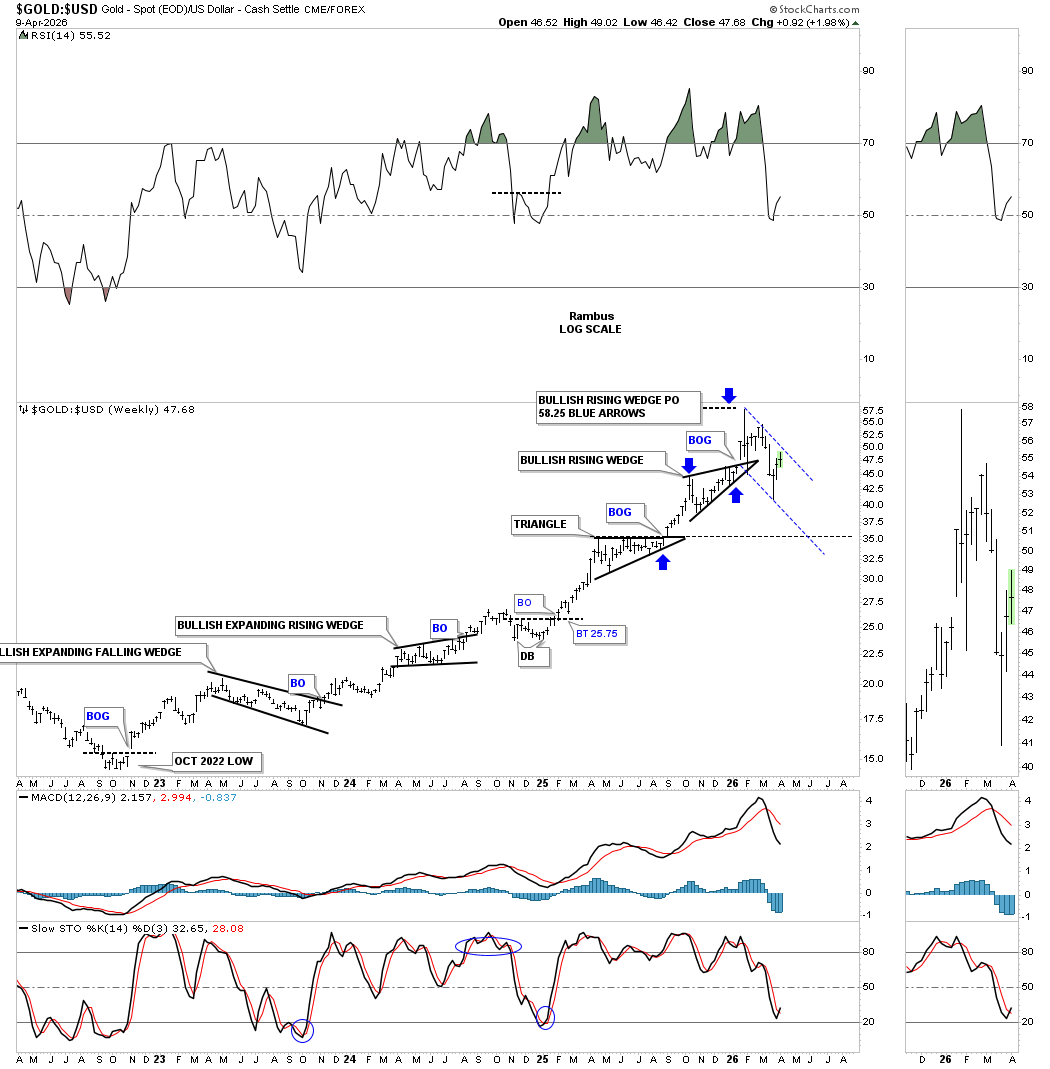
Next is a weekly chart showing the Gold:US dollar ratio, which that how well gold has been outperforming the US dollar since the 2022 low. The blue arrows show the bullish rising wedge halfway pattern price objective, which has led to the current decline.
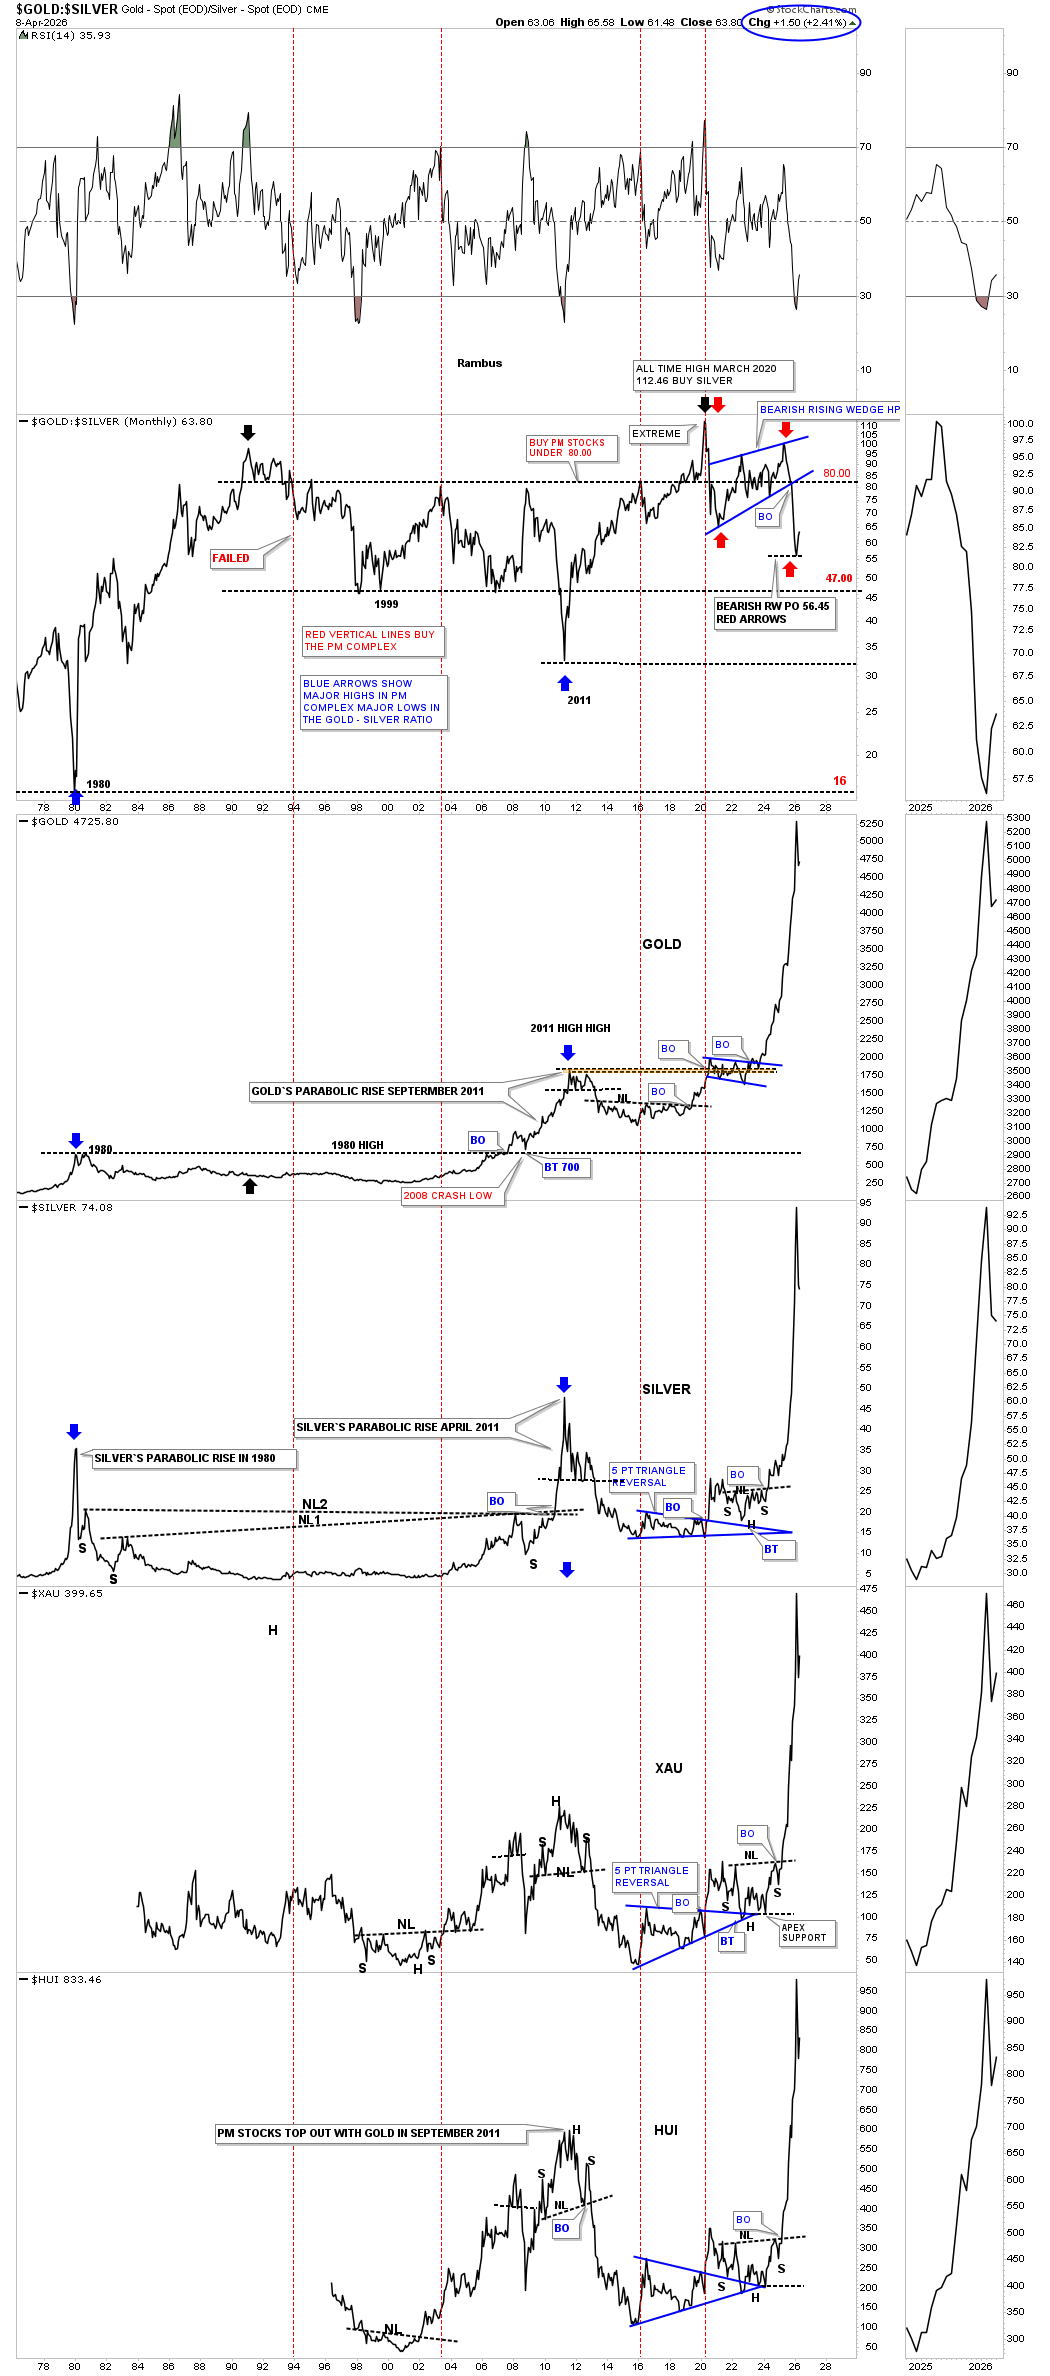
The last time we looked at this long-term Gold:Silver ratio chart, the ratio had just broken below the bottom rail of the blue bearish rising wedge, which led to silver kicking gold’s butt.
I also commented on the charts below the ratio; the rally was the most beautiful and scariest rally I’ve ever seen. It’s beautiful because of its massive vertical move, but it’s also scary because when you see a parabolic rally like this, it generally leads to a large decline that can often go down faster than it went up. At a minimum, this vertical move is calling for some type of consolidation pattern to consolidate these massive gains.
Silver hasn’t been doing a lot since the price action reached the bottom of the trading range. Silver fell just shy of reaching the blue bullish rising wedge price objective by about 5 points or so, blue arrows, back at the January all time high.
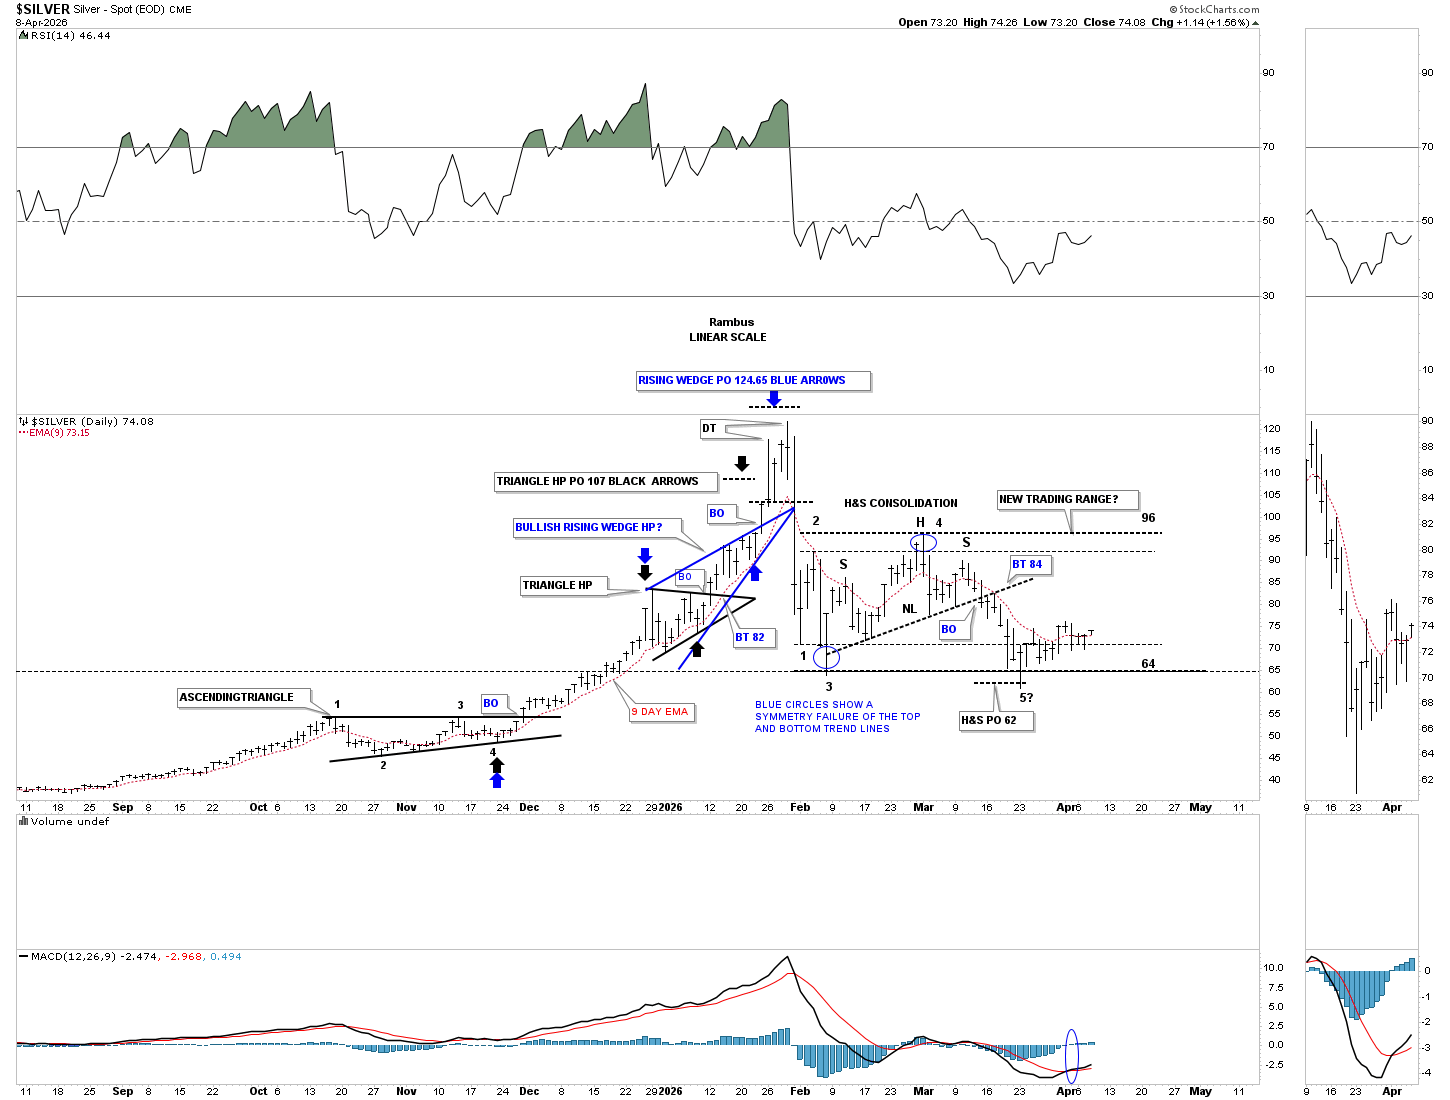
Here is an older silver chart we were following back in 2024 and 2025, showing the two diamonds which led to the massive rally silver enjoyed until the January 2026 high. Silver’s downtrend channel is currently testing the top trend line, with the top of the previous triangle coming in around the 55 area for possible support.
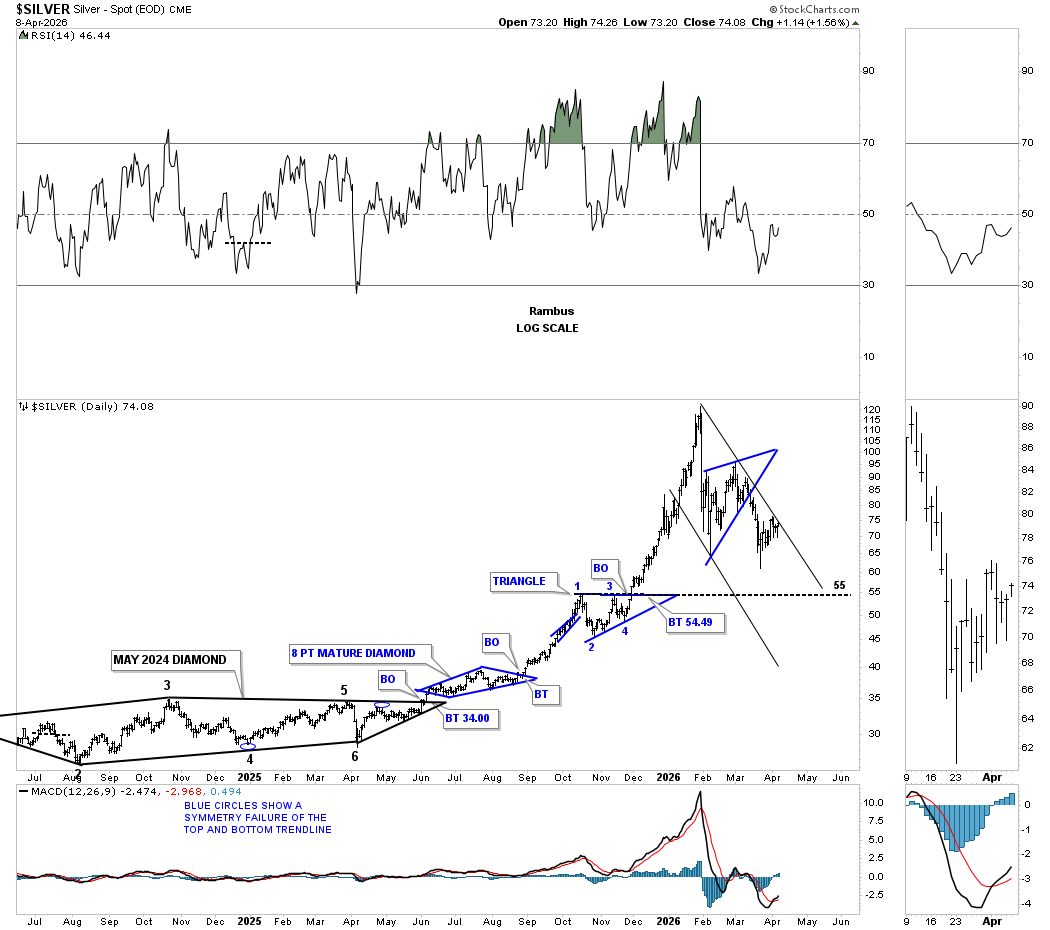
That massive rally into the January 2026 all-time high also hit the top rail of the secular bull market uptrend channel, which came much earlier than I was originally thinking. It’s still possible that with some sideways price action, the top trend line can be hit again out in the future, as I was originally showing, as shown by the long black arrows which measure time and price.
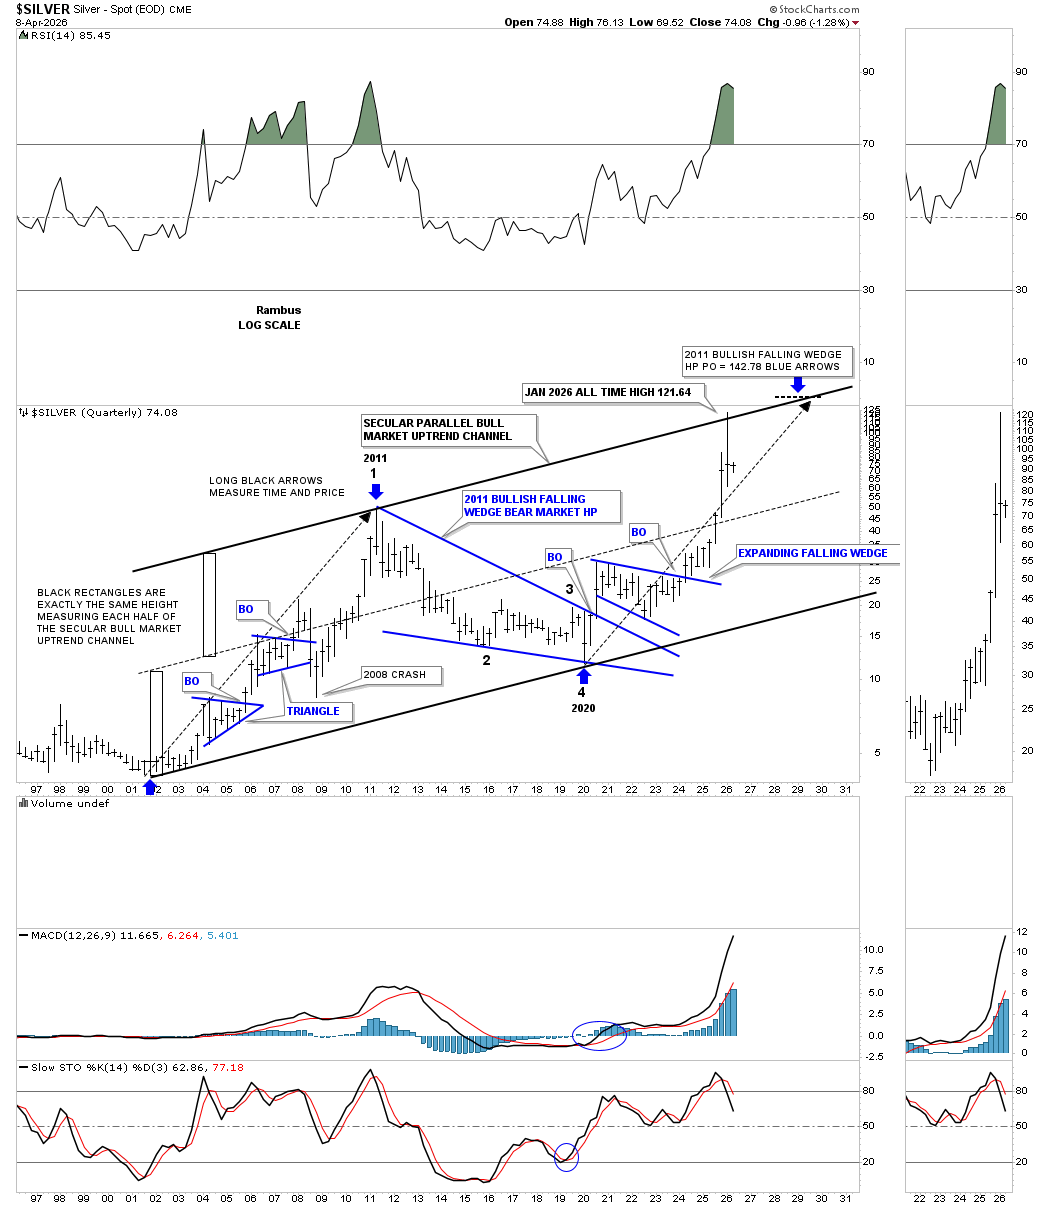
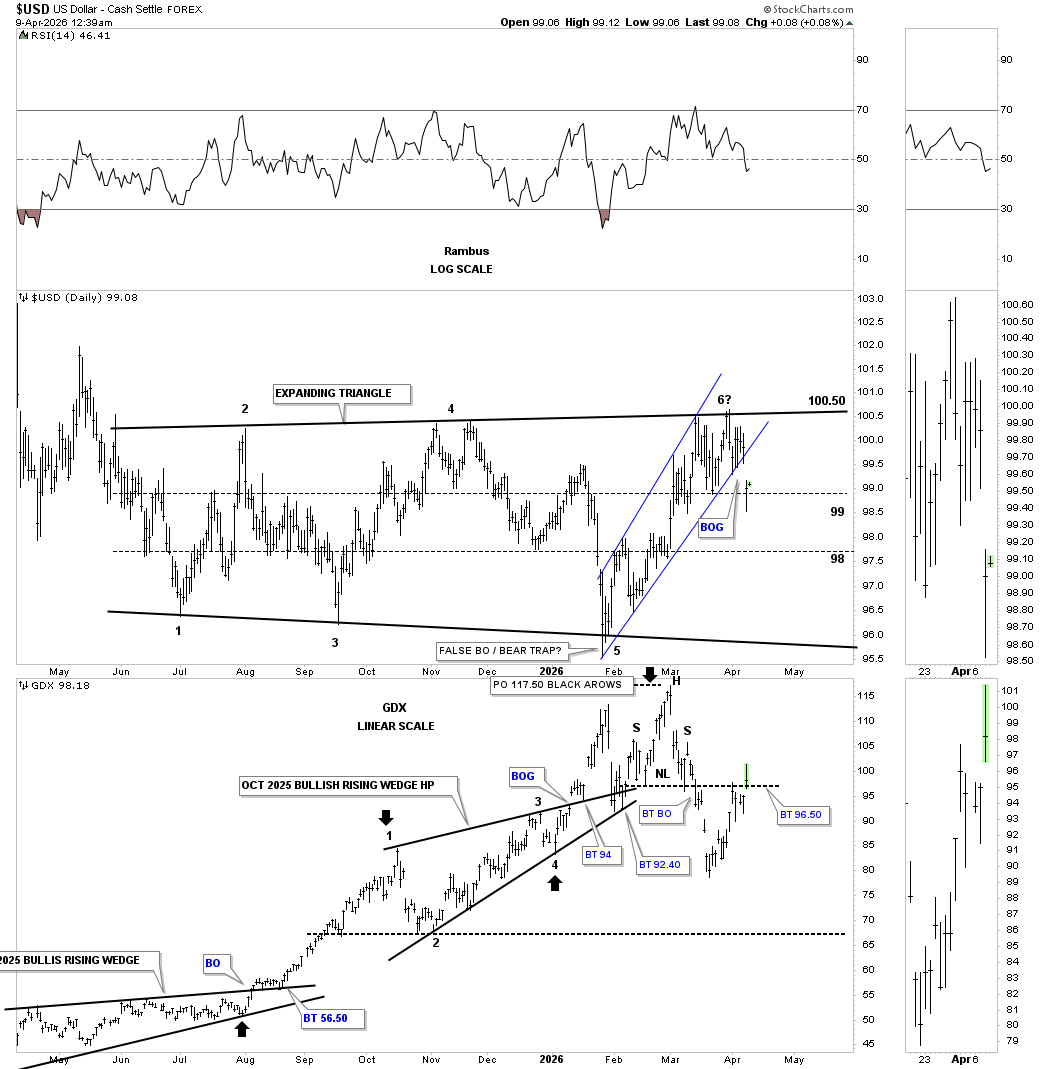
Below is the new updated daily chart for the US dollar, which shows the July trading range as an expanding triangle with 5 completed reversal points when the top trend line was recently hit. So far, the US dollar is struggling at the top of the expanding triangle, forming a possible double top.
Next is the daily combo chart, which has the US dollar on top with the GDX below. Today, the bottom rail of the expanding rising channel was gapped below with the GDX gapping above its potential neckline, showing some inverse correlation.
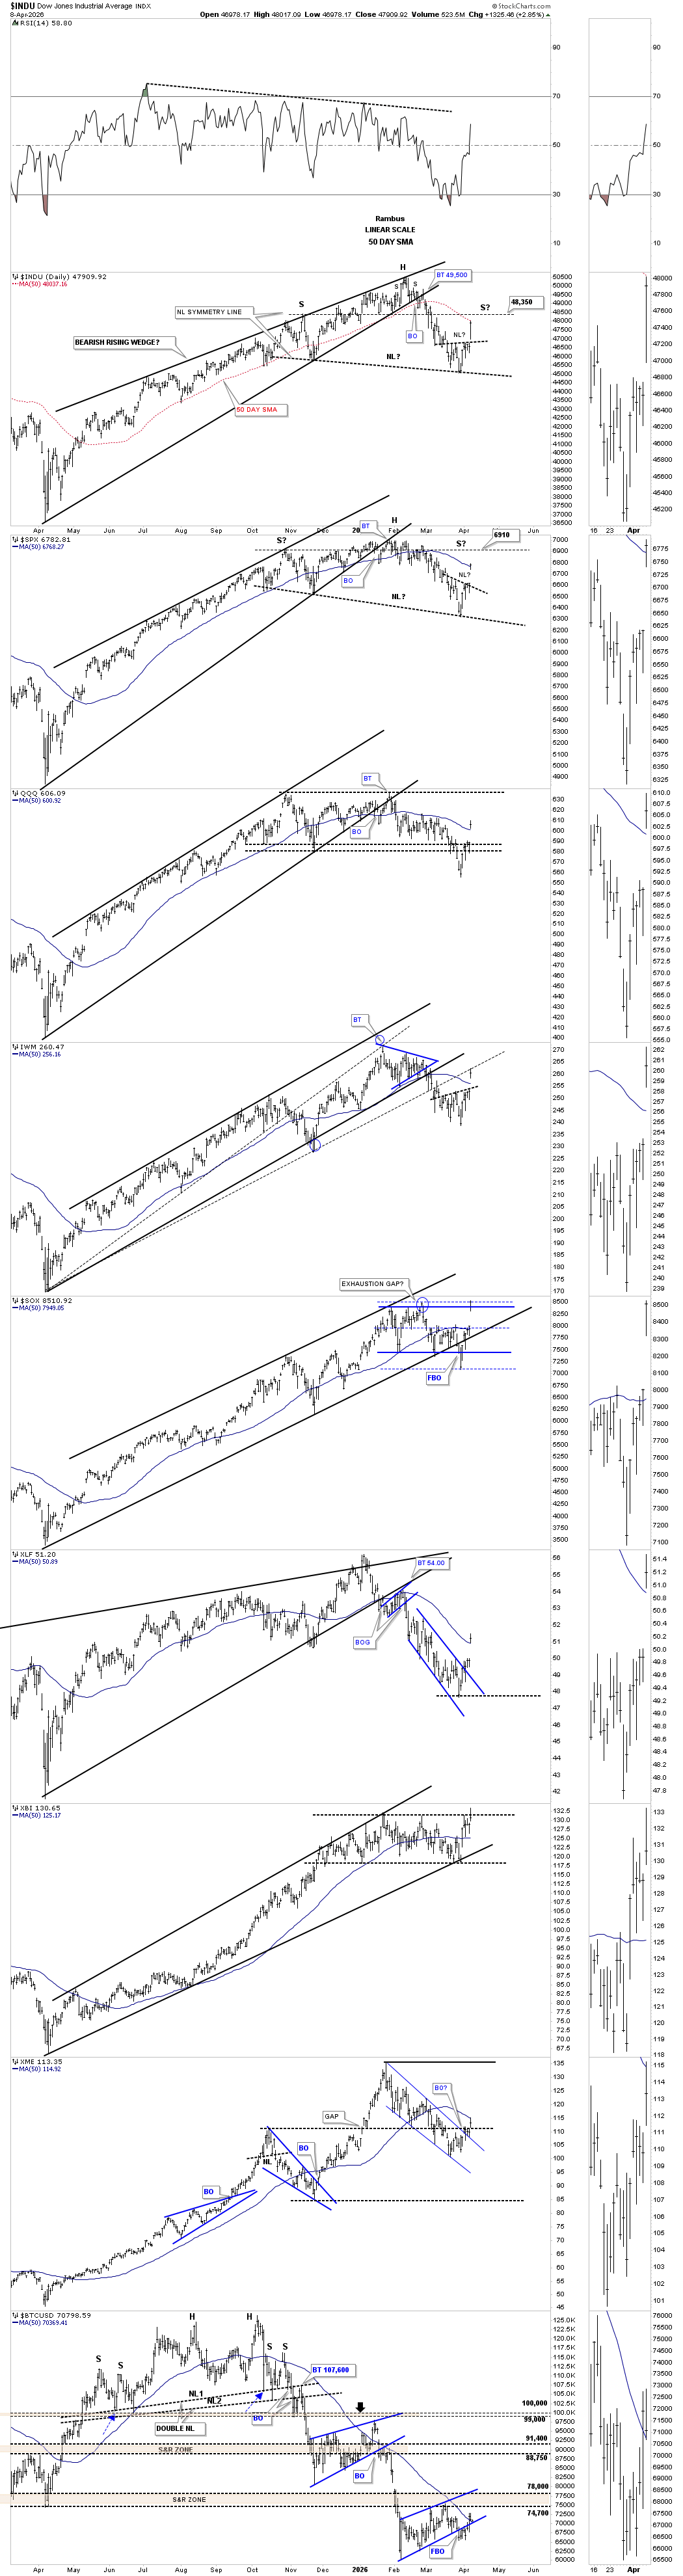
Today’s massive rally in the US stock markets came on a news event, which can be temporary. The small H&S bottoms we’ve been following show a massive breakout gap today. I was showing a parallel neckline symmetry line on the INDU and SPX. When the neckline symmetry line fails like it did today, the second option to find the possible right shoulder high is to draw a horizontal line straight off the high of the left shoulder, which in this case comes to 48,250 on the INDU and 6910 on the SPX.
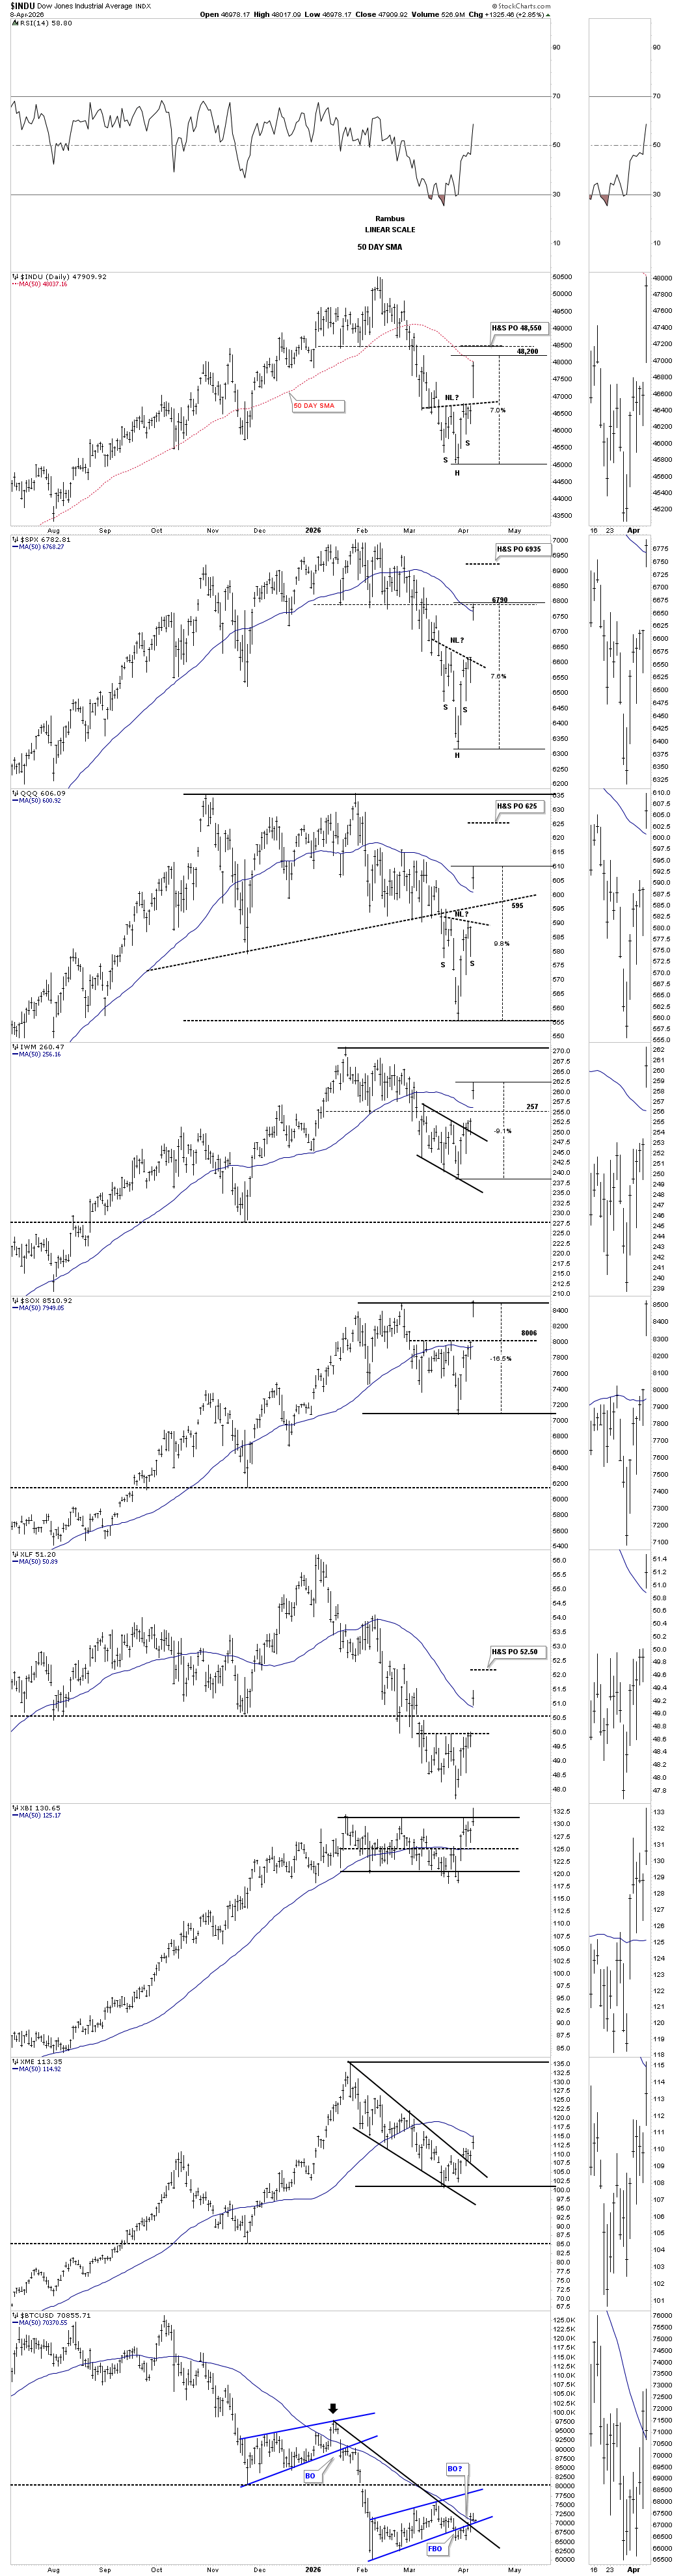
Below is the shorter-term daily combo chart we’ve been following, in which I was showing how a typical 7% correction in a new move lower would look. I also have the H&S bottom price objective on this chart as well. As you can see, some of the stronger indexes have rallied more than 7%, with several of the H&S price objectives a little higher. Will we see another news event add more volatility to the price action one way or another?
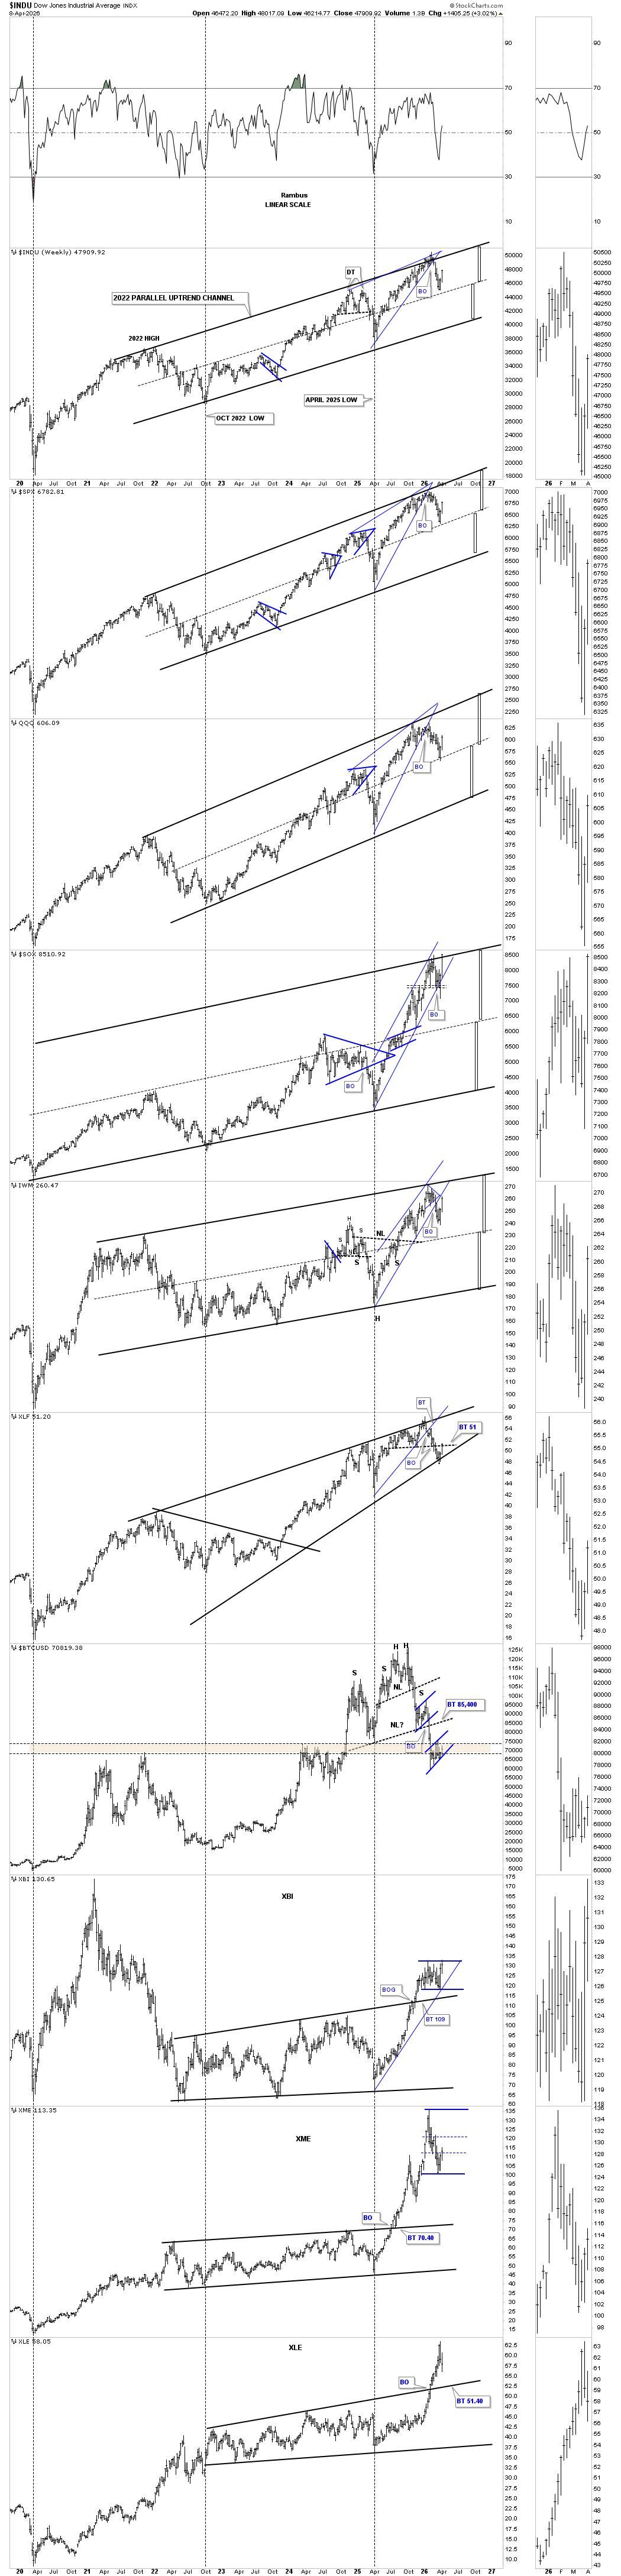
This last chart for tonight shows the parallel uptrend channels, in many cases with the center dashed midline showing where the current bounce started.
Currently, the PM complex needs to show me a bit more in the very short term on whether the H&S bottom is the real pattern or if the double top is still in play, which suggests lower prices yet to come. We shouldn’t have too long to wait. All the best…Rambus
The Chartology of Bull Markets
Tonight I would like to show you a few charts on what a long term bull market should look like from a Chartology perspective. It’s no big secret if one knows what to look for as most bull markets look very similar from the long term perspective.
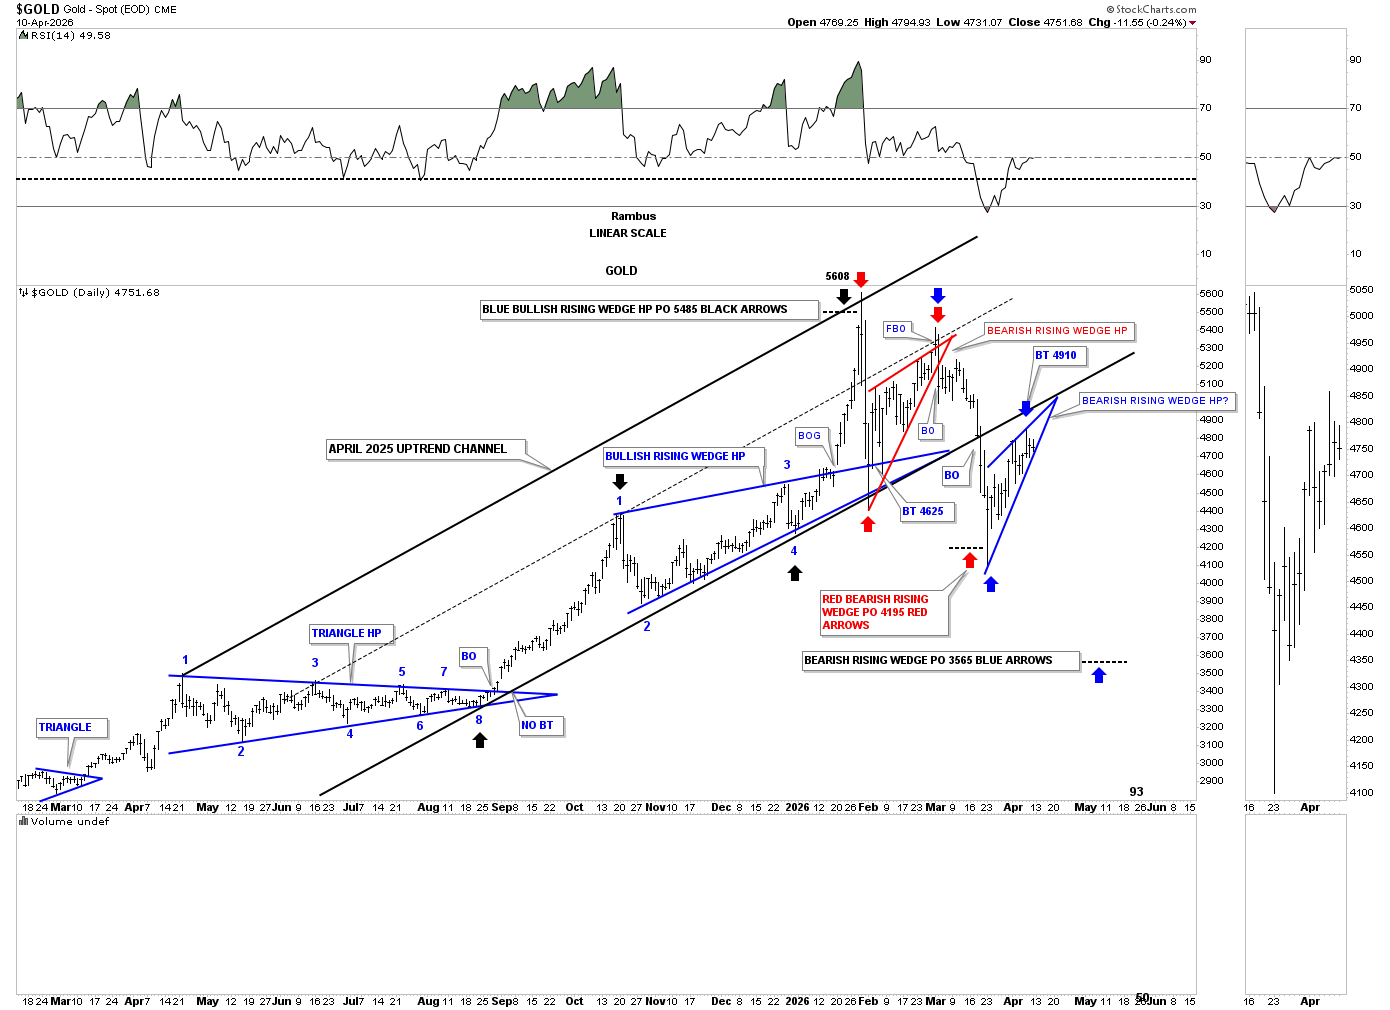
First though let’s take an in-depth look at the daily chart for gold, which covers a little over a year of price action. While there are many fundamental reasons why analysts think gold should be going higher, the truth lies in the chart patterns, which are created by thousands of investors putting their hard-earned capital on the line when they buy or sell.
Below is a daily chart for gold that we’ve been following, which originally included silver on the bottom, but I removed it to focus on the gold chart.
Let’s pause right here for a moment so I can quickly explain the three stages a stock or index can be in. First, a stock can be forming a consolidation pattern where the price action will breakout in the direction of the major trend, up in a bull market and down in a bear market. Second, a stock can build a reversal pattern, which reverses the trend from either up to down or down to up. Third, a stock is in an impulse move after breaking out from either a consolidation pattern or a reversal pattern.
Also, keep in mind that charts are fractal in all timeframes, meaning if I showed you a triangle on a 15-minute chart, you wouldn’t be able to tell the difference if the triangle was forming on a daily, weekly, or monthly chart, as they would look like a triangle; only the timeframe lets you know the difference. So, a consolidation pattern, reversal pattern, or an impulse move is relative to the timeframe you are watching. The longer the timeframe, the more importance each phase becomes.
Almost exactly one year ago, in April of 2025, gold started to build the 8-point symmetrical triangle consolidation pattern that took until August to complete. Upon its completion, a strong impulse move began that took gold up to the October 2025 high, which began the next consolidation phase, which was the October bullish rising wedge, that completed in early January of this year with a breakout gap.
Once the October bullish rising wedge was confirmed, we could now show it as a halfway pattern between the April 8-point triangle and its measured move. The black arrows show how the measured move price objective up to 5608 was reached, as shown by the black arrows.
From April 2025 high to the January 2026 all-time high, gold formed a beautiful parallel uptrend channel. During that initial hard selloff from the January high, gold began to form the red bearish rising wedge when the bottom trend line of the uptrend channel was reached, which. During the month of February, gold ended up forming the red bearish rising wedge, which strongly suggested an important correction was at hand once the bottom trend line gave way. After a quick backtest, the impulse move down began in earnest, taking out the bottom rail of the April uptrend channel, suggesting more weakness was most likely in the cards. The measured move for the red bearish rising wedge was reached at 4195, exhausting the energy, which led to a countertrend rally up to the bottom rail of the April uptrend channel which we are still in.
Gold has now formed the blue rising wedge just below the bottom rail of the uptrend channel and has completed 4 reversal points with the touch of the bottom trend line last week. If we see a breakout below the bottom rail of the blue rising wedge, it will have a price objective down to the 3565 area, where the energy from the blue rising wedge will be exhausted. At that point, it’s possible that gold could be putting in its correction low, which began at the all-time high made back in January of this year.
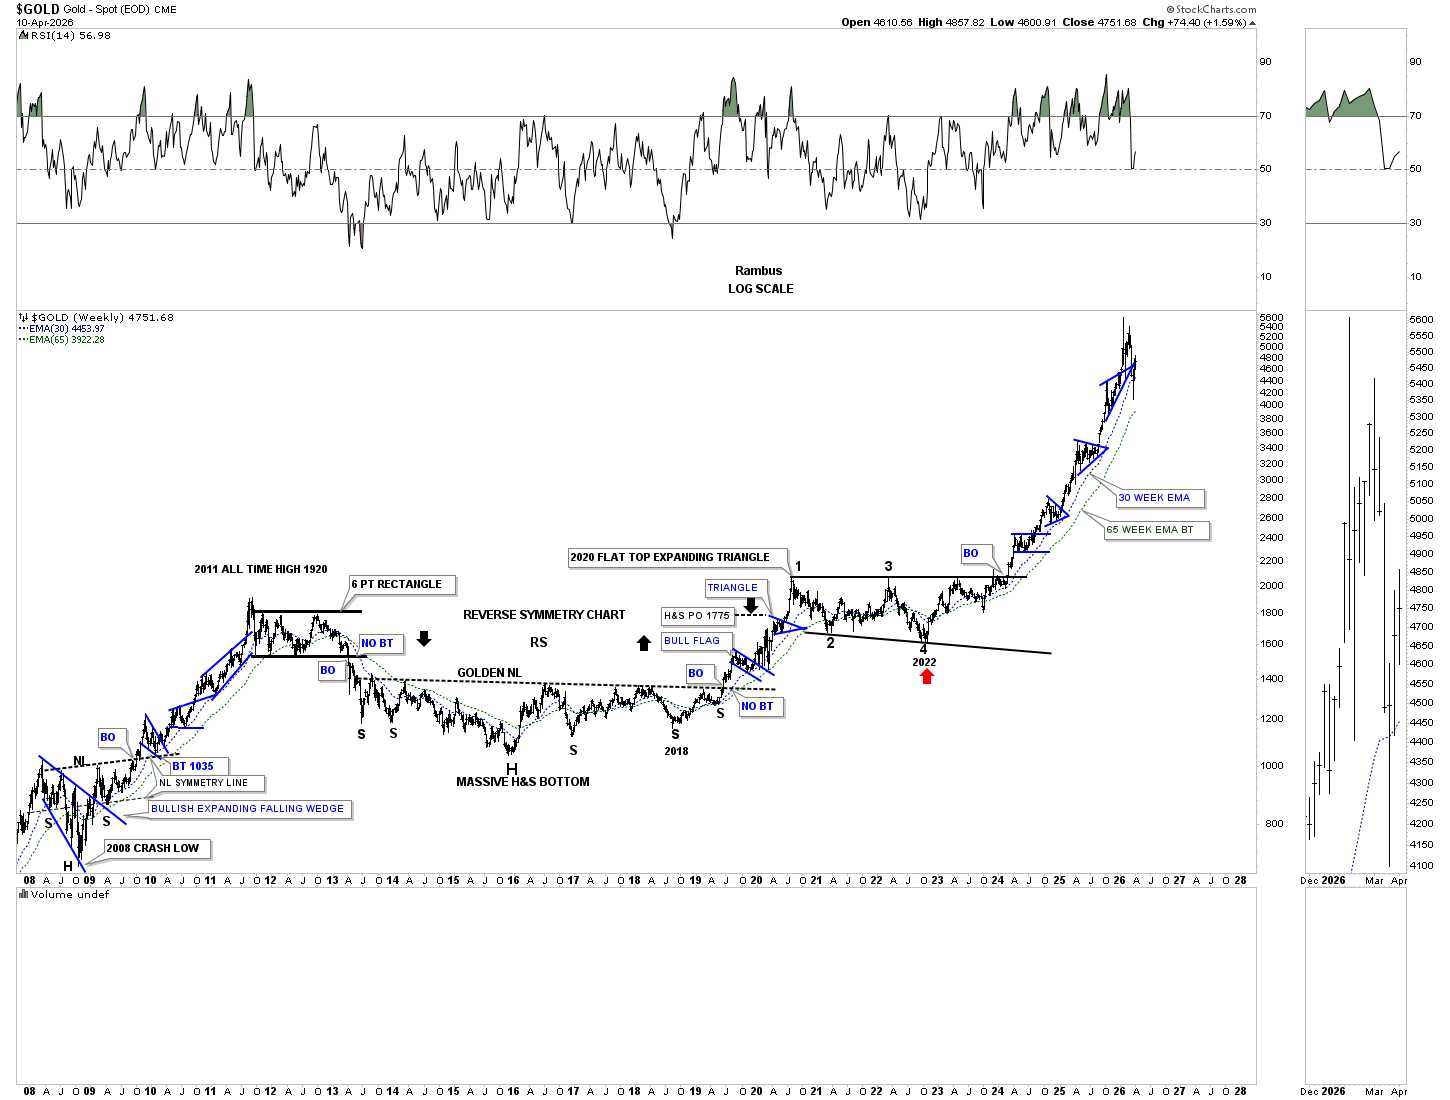
Let’s look at a long-term weekly chart for gold, which goes all the way back to the 2008 crash low, and shows you a good example of what we discussed above. The 2008 crash low formed a very bullish consolidation pattern, which is made up of two separate consolidation patterns – the blue bullish expanding falling wedge with the H&S consolidation pattern, two consolidation patterns for the price of one. Note the breakout from the blue bullish expanding falling wedge and backtest, which then led to the rally to and through the neckline. The backtest to the neckline formed the small blue bull flag, followed by an impulse leg up, followed by the small blue expanding triangle, followed by another impulse move higher, followed by the last consolidation pattern, the blue bullish rising wedge, to complete that leg of the 2000 secular bull market into the 2011 all-time high back then, that was a mouthful.
At the 2011 high, the short-term daily chart shows a small reversal pattern, which led to the formation of the 6-point rectangle consolidation pattern, which took close to two years to complete. The breakout below the bottom rail of the black rectangle took most of the precious metals complex investors completely off guard, but we knew that the rectangle formed below the all-time high, so the odds were very high that the breakout would come to the downside, which really kicked off the cyclical bear market within the secular bull market that began at the 2000 low.
As the cyclical bear market progressed over the coming years, we needed to see a reversal pattern to reverse the bear market that had been in place since the 2011 high. It was a long drawn-out affair, but gold built out a massive multi-year H&S consolidation pattern, in which I coined the phrase “GOLDEN NECKLINE” because after the 2016 low and first rally were in place, I was able to draw in the possible neckline, which would still take several more years to complete, but the setup was there. After the breakout from the golden neckline, gold rallied for about a year and a half, forming two small blue consolidation patterns, before topping out during the 2020 rally, which began the formation of the 2020 bullish flat-top expanding triangle consolidation pattern, which was another long drawn-out trading range, if you were following it in real time, as we did.
One of my favorite sayings when it comes to the markets is that a big trading range leads to a big move. After nearly four years of chopping sideways starting at the 2020 high, gold broke out with gusto with no backtest. As you can see, gold has formed one consolidation pattern on top of the previous one with an impulse leg between each blue consolidation pattern.
Since the January 2026 high, you can see the character of the massive impulse move off the 2022 low has changed. Instead of making new higher highs, gold has now made its first lower low, see the daily chart above. I’ve been suggesting since February 2nd of this year, when I put the “PM Stock Trades Portfolio” to 100% cash, that the odds were now very high that a high-level consolidation pattern was very possible, which could take many months to a year or longer to complete. The PM complex has now been trading sideways for 2 1/2 months so far.
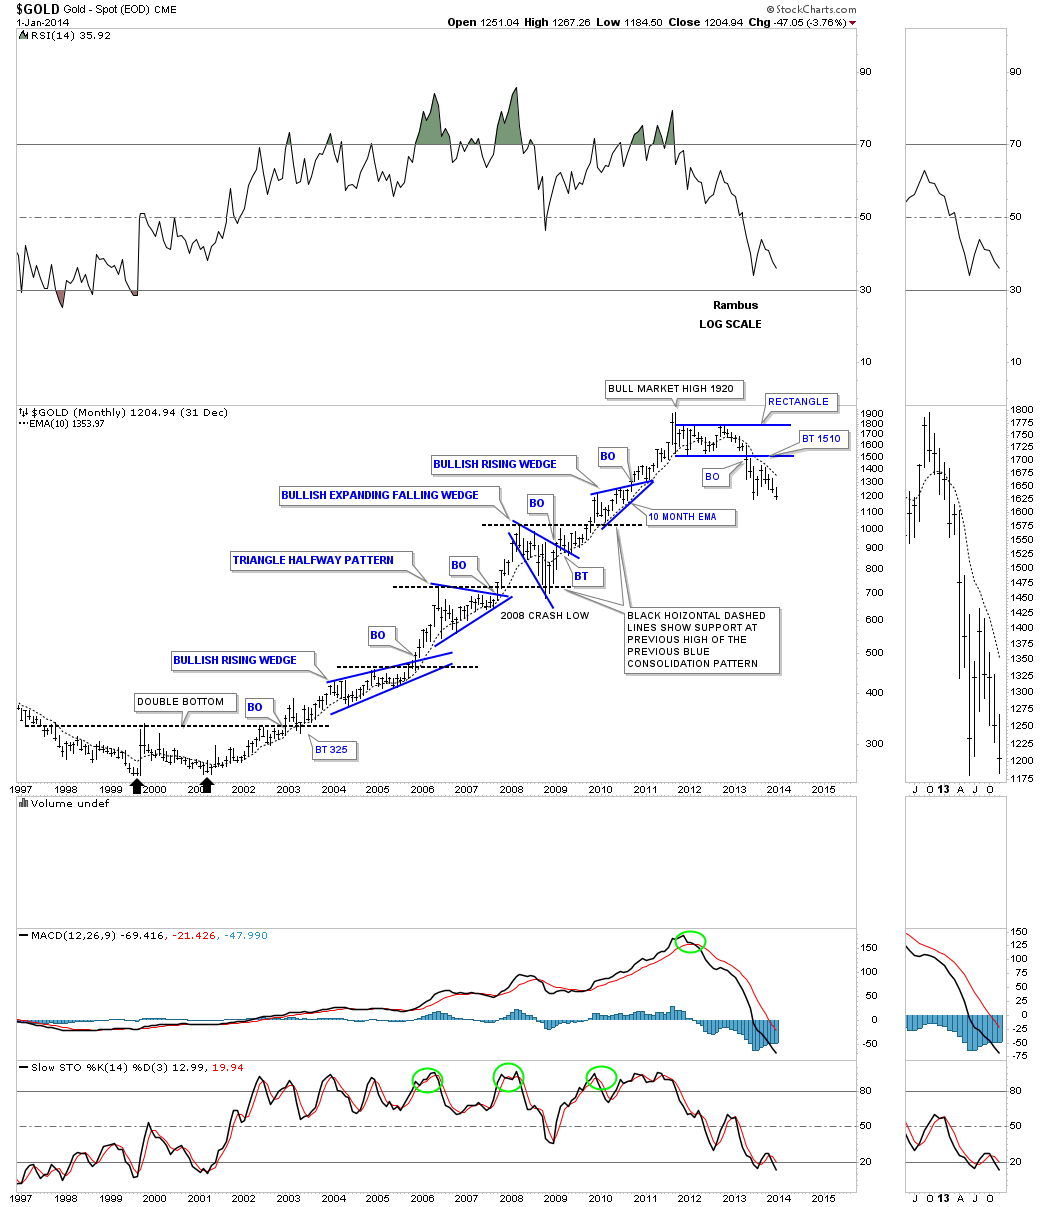
I would like to show you one more chart, which shows how a bull market on the long-term monthly chart should look, which, again, is relative to the timeframe you are looking at.
Below is the first leg up in gold’s secular bull market that began at the 2000 low after a 20-year bear market. After a 20-year decline, gold needed to form some type of reversal pattern to reverse the bear market to a bull market. Remember, big patterns lead to big moves, so that five-year double-bottom base suggested gold was launching a new multi-year bull market, which, back then, no one knew how long it would really last. As the bull market advanced, gold formed one blue consolidation pattern on top of the previous one with an impulse leg between each pattern. During that eleven-year bull market, gold formed three very bullish consolidation patterns – two bullish rising wedges with the 2008 bullish expanding falling wedge and one symmetrical triangle. The main PM stock index back at the 2000 low, the HUI, shows a very similar 2000 to 2011 bull market. Note how the top of the previous consolidation pattern would hold support once the impulse move was finished, black dashed horizontal lines.
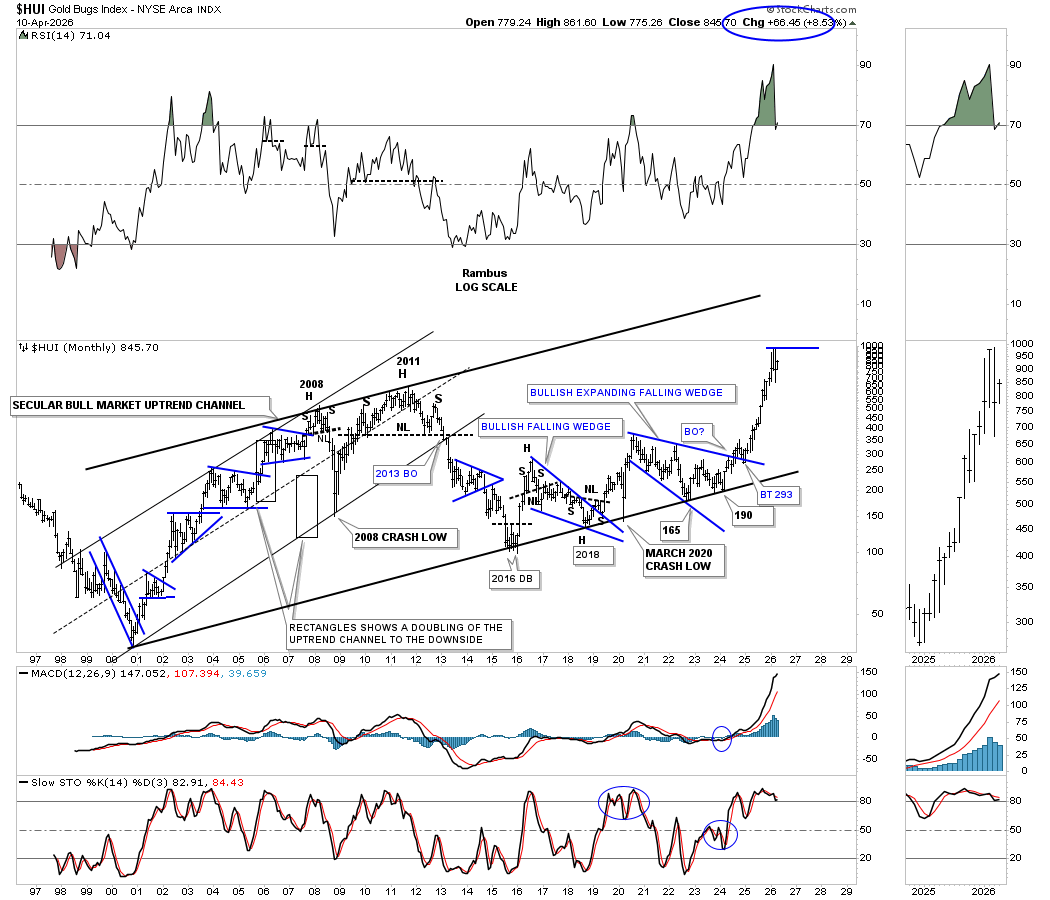
During the bull market years from the 2000 low to the 2011 high, the HUI formed a classic bull market uptrend channel with one blue consolidation pattern forming on top of the previous one with an impulse leg between each consolidation pattern. The first part of the secular bull market, which began at the 2000 low to the 2011 high, ended with the very symmetrical 2011 H&S top reversal pattern, which led to the cyclical bear market into the 2016 low.
Note the thin black rectangles that formed each half of the 2000 to 2011 uptrend channel, which I call measuring sticks. During the 2008 crash, I used the lower black rectangle to establish the bottom trend line of the uptrend channel, which helped me find that low. Somewhere, I still have the daily chart for the 2008 crash, which showed a bearish falling wedge halfway pattern that also nailed the 2008 crash low.
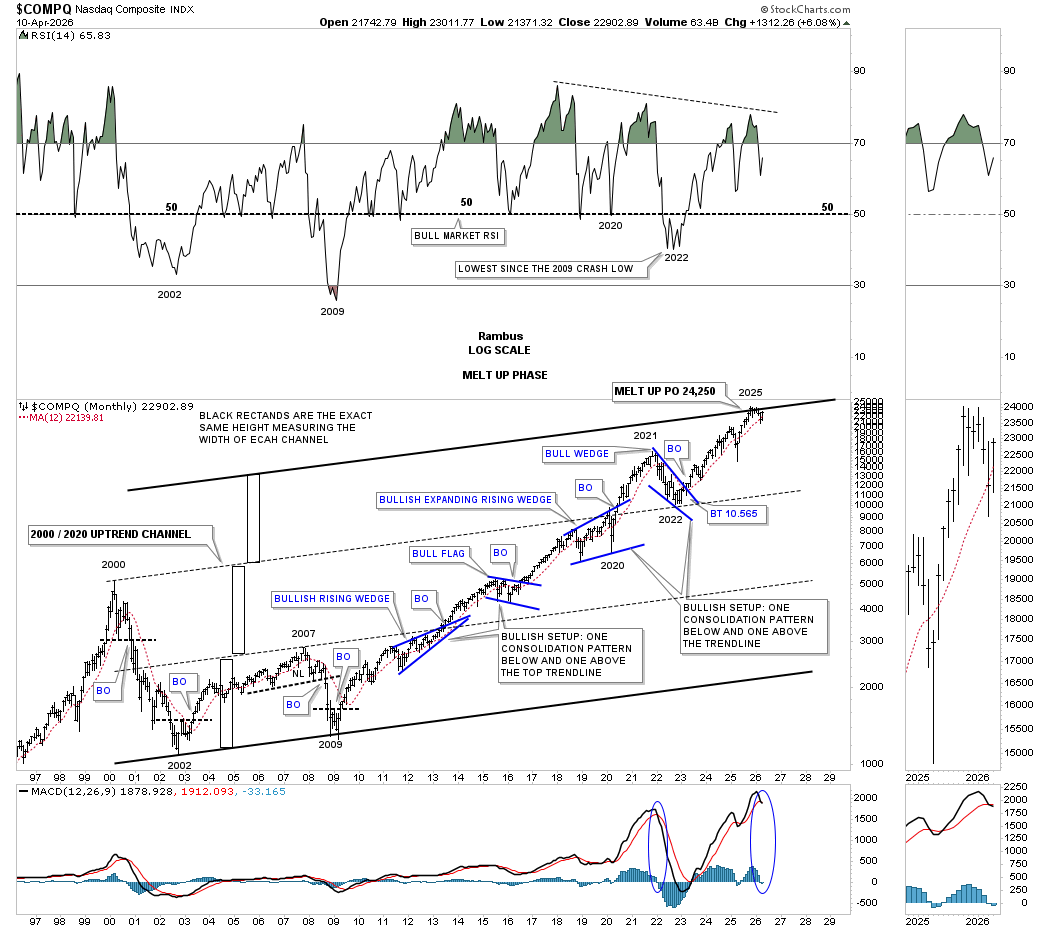
This next chart uses measuring sticks to show you how the doubling and tripling of the uptrend channel on the COMPQ has gotten us to the top of the secular bull market.
In the long term monthly charts above we looked at gold and the HUI’s first leg up in their secular bull market from 2000 to 2011 and the consolidation patterns they formed. Now I would like to show you the same principle in action we’ve been discussing for gold and the HUI looking at the COMPQ’s long term monthly secular bull chart that goes back to the 2002 crash low off the 2000 tech bubble high.
First, note the unbalanced double top that formed at the 2000 bull market high, which led to the nearly 85% decline into the 2002 bear market low, which formed an unbalanced double bottom reversal pattern. From the 2002 low, the COMPQ, along with the rest of the US stock markets, ground higher into the infamous 2007 high, which marked the beginning of the housing and banking crisis. Before the crash, the COMPQ formed a H&S top, which warned of something bad coming to the US stock markets. No one at the time knew what it would be, but a H&S top of several years duration is something you don’t take lightly. The COMPQ crashed into the 2009 double bottom low, which began the secular bull market we see today, which is now 16 years old.
Just like the monthly charts for gold and the HUI above, the COMPQ has completed four large consolidation patterns, two of which are very bullish chart patterns – the bullish rising wedge and the bullish expanding rising wedge, with one bull flag and one bullish falling wedge.
About a year or so ago, I built several charts which described how a melt-up phase to possibly end the secular bull market that began at the 2009 crash low could play out. There’s some nice Chartology on this chart that you won’t find in any textbooks, but we’ve discussed many times in the past. Note the thin black rectangles on the left side of the chart, which I call measuring sticks. From the 2002 low to where the COMPQ broke out from the blue bullish rising wedge in 2013, that marked the end of the lower channel and suggested a new leg was being born. To find out how high the COMPQ could rally, I put a measuring stick on top of the lower channel line, which gave us a long-term price objective up to the now center dashed line off the 2000 high.
Just below the 2000 uptrend line, the COMPQ formed the blue bullish expanding rising wedge, which could have been a reversal pattern, but when the price action broke out to the upside, we had another consolidation pattern in place within the secular bull market uptrend. Note where the blue bullish falling wedge found support during the 2021-2022 decline, right on top of the 2000 uptrend line at 10,565, which marked the beginning of the next impulse leg higher.
This is where it gets interesting. If you noticed, there are no touches of the top trend line until the all-time high was made in the fall of 2025, which so far is still holding almost six months later. The top trend line is drawn in from the measuring stick off the 2000 uptrend line, which shows another equal channel completing. This is one reason why I’ve been dollar cost averaging on the short side since late last year and earlier this year, looking for a possible backtest of the 2000 uptrend line, which will be quite a bit lower, cutting the COMPQ in half.
During the lean years for the PM complex, after the 2011 high, we were trading mostly the leveraged bull ETF’s for the stock markets, waiting for the cyclical bear market to end for the PM complex.
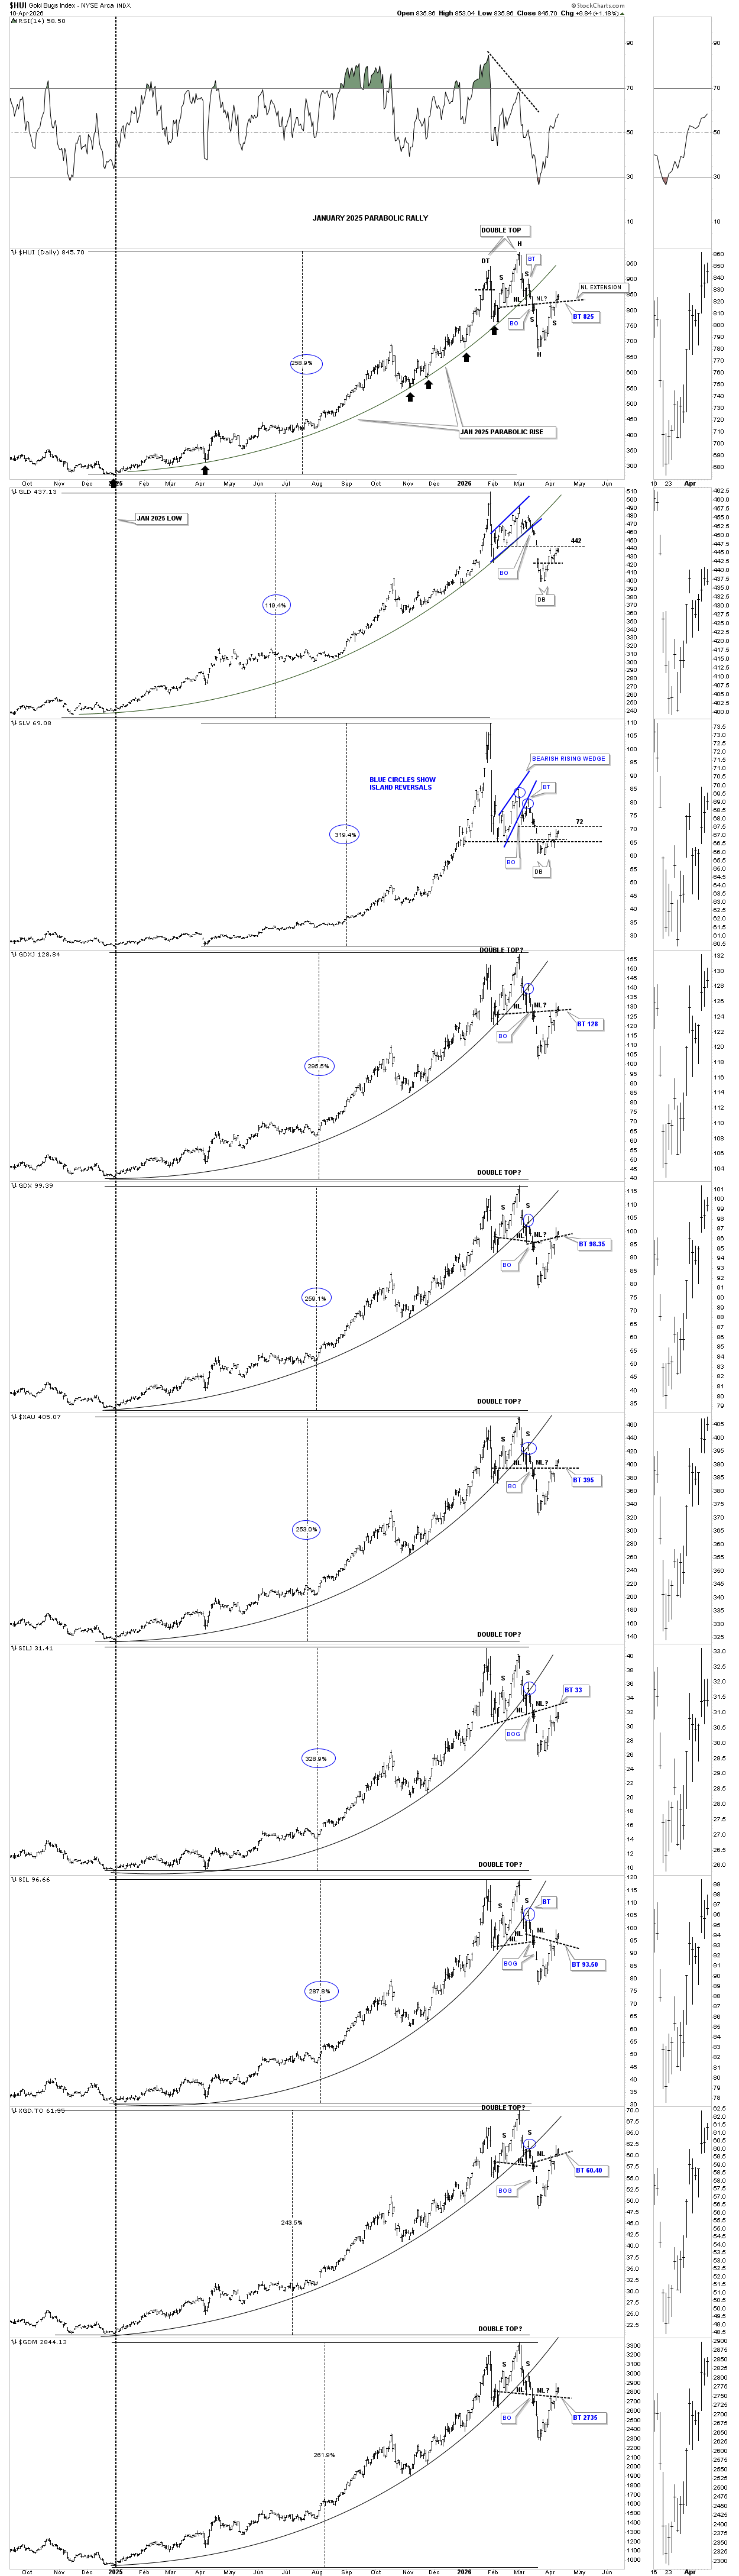
Let’s turn our attention back to the PM complex and look at some daily combo charts we’ve been following very closely. As you know, I’ve been looking at two possible scenarios for the intermediate term, which is the H&S bottom or the double top reversal pattern, which will give us two very different outcomes.
Below is the daily combo chart, which shows the parabolic arc that started to form at the January 2025 low and was broken earlier this year. If the small H&S bottom plays out, it’s strongly suggesting a rally up to the all-time high, which would complete the 2nd reversal point and the beginning of the 3rd reversal point to the downside, forming an intermediate-term high-level consolidation pattern after the 4th reversal point is finally established. So far, we can see a breakout gap above the neckline and the backtest to the neckline, which is still holding support, so nothing is broken yet.
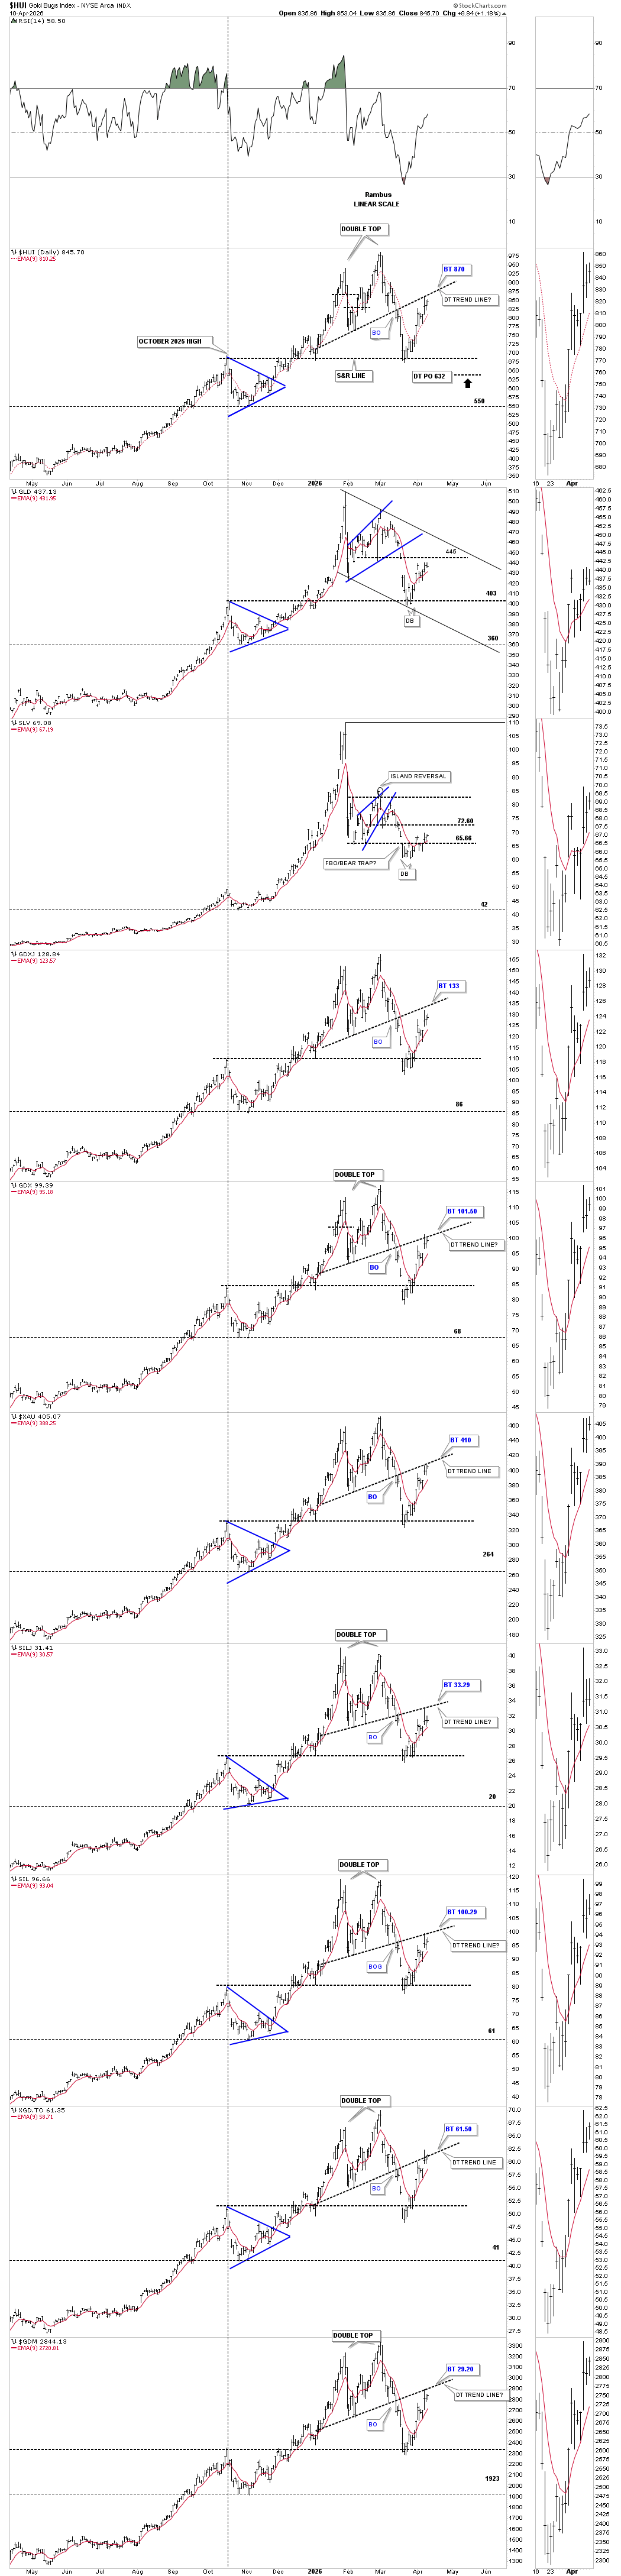
Now let’s look at scenario #2, which is still showing the possible double top reversal pattern, which is also still in play. To negate the possible double top scenario, we’ll need to see the price action trading above the double top trend line. From this perspective, nothing is broken either.
If the H&S bottom on the daily combo chart above plays out, then we will see a rally up to the all-time high, which will mark the end of reversal point #2 and the beginning of reversal point #3 to the downside, looking for the 4th reversal point low. If this scenario plays out, then you can see how another high-level consolidation pattern may look. In this best-case scenario for the PM complex, it will still take quite a bit of work to complete the consolidation pattern before the next important impulse leg to the upside can begin. It’s just how bull markets work, with an impulse move followed by a consolidation pattern, followed by another impulse move, until it’s time to form a much larger consolidation pattern to consolidate all the previous smaller impulse legs.
On the other hand, if the double top reversal pattern is in play, then, using the HUI as a proxy for the rest of the PM complex, the minimum price objective would be a bit lower at 632, where the possible 2nd reversal point low could be showing us the low for the consolidation pattern.
I have a monthly combo chart for the 2011 triangle consolidation pattern for the PM complex, but I’m just going to just show you the 2011 triangle for the HUI to keep things from getting too cluttered.
First, notice the 2000 to 2011 classic bull market uptrend that came to an end in 2011. From that 2011 high, the HUI began its cyclical bear market, which ended at the 2016 low. What that five-year bear market achieved was reversal point #1 and #2 in the massive 2011 triangle consolidation pattern, as shown by the red numbers. The 3rd reversal point formed at the 2020 high, which led to the last important decline into the 2022 low, reversal point #4, which launched the epic rally we enjoyed. In the apex of the 2011 triangle formed the very bullish expanding falling wedge, along with the H&S pattern, forming the particular doubly bullish consolidation pattern in one.
Note the small ping pong move between the top rail of the 2011 triangle, along with the top rail of the 2020 blue bullish expanding falling wedge and the neckline. Once the backtest was complete at 275, all the work was done, and the impulse leg that followed was of epic proportion. After such a massive rally, it only seems fitting for some type of consolidation pattern to start forming to consolidate those massive gains and build up the energy for the next leg up. Note where the measured move should take the HUI as shown by the back arrows.
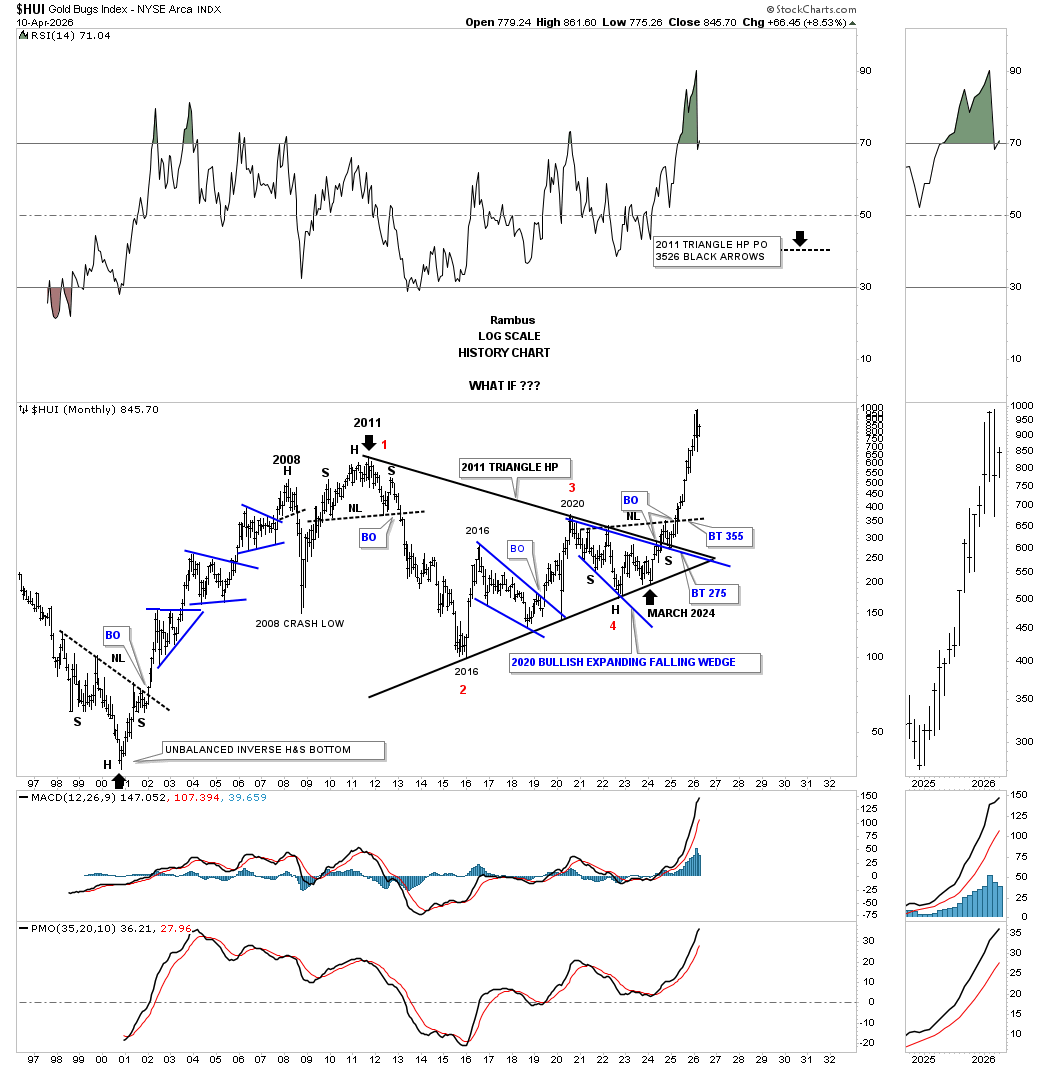
Let’s finish up by looking at some combo charts for the US stock markets, starting with this daily one-year bar chart, which shows the 2013 bearish rising wedge in many cases. At the beginning of April, we saw the first important low, where the small H&S bottom formed, suggesting a counter-trend rally was in the cards, which we’ve gotten. Now the question becomes, how much higher does the rally run?
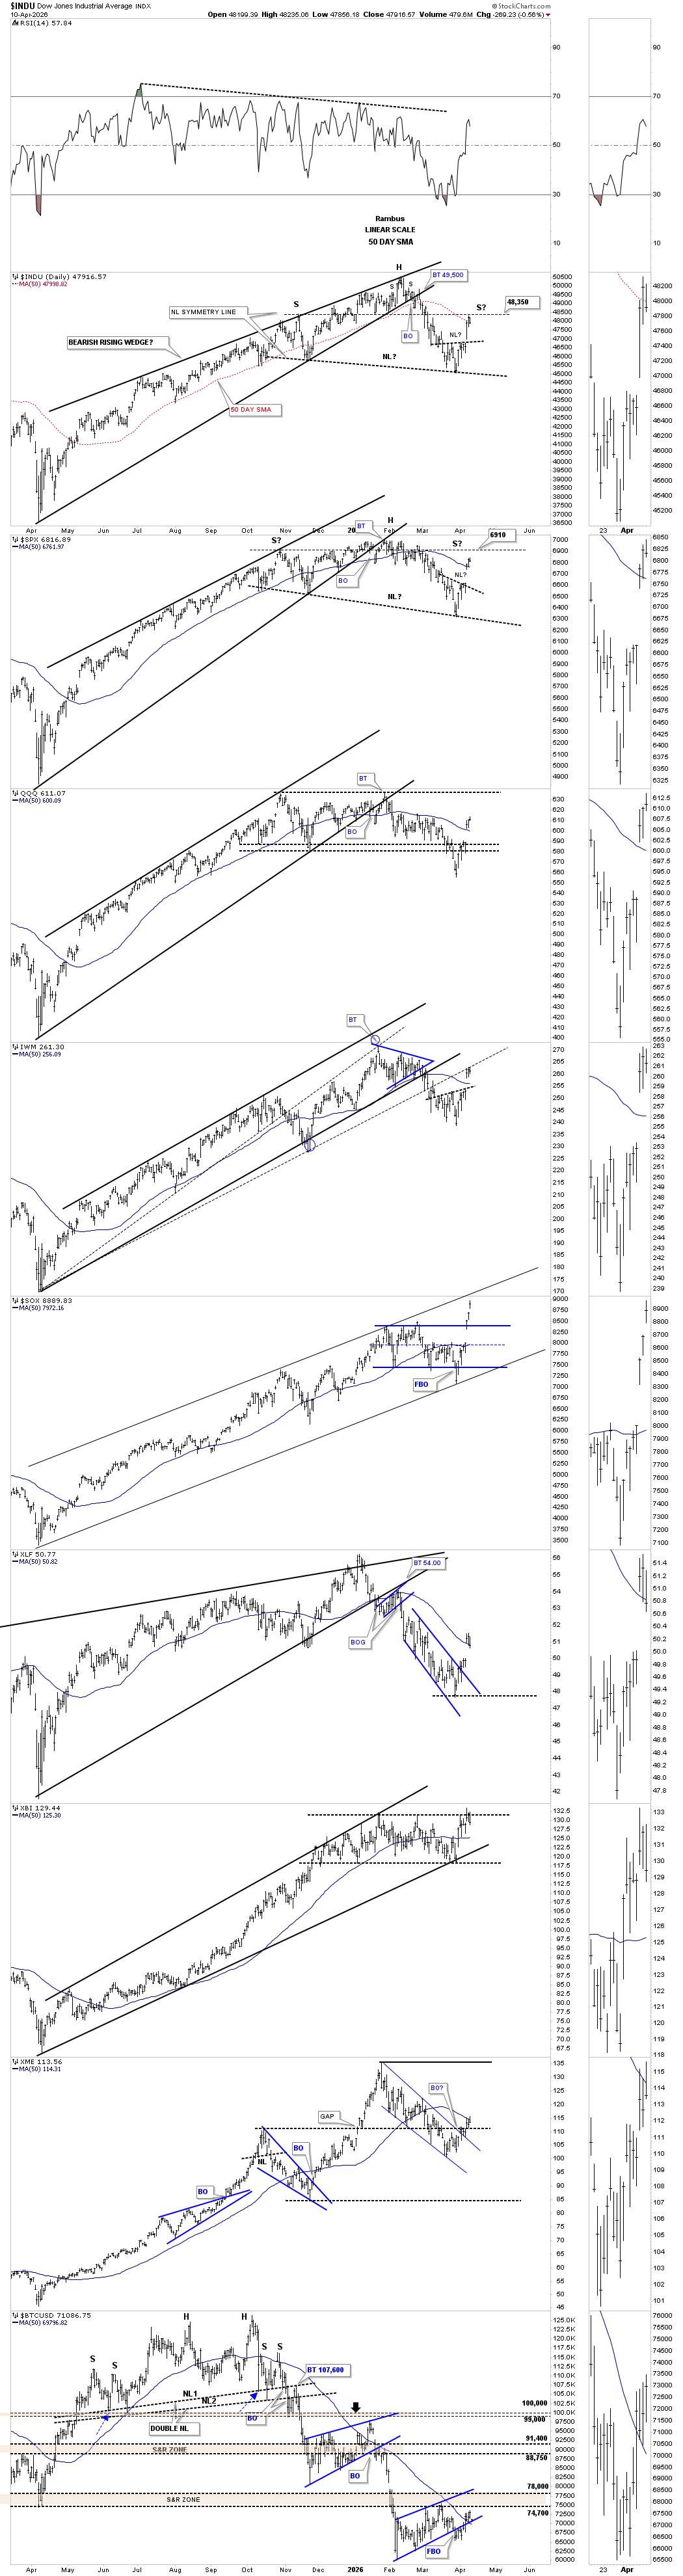
This second daily bar combo chart shows the small H&S bottom, in which I suggested at the time could lead to a 7% rally, which would be in the ballpark for a bear market rally. As you can see, some of the indexes have rallied more strongly than 7% vs the INDU and SPX, but they are also much more volatile. Note how the INDU and SPX have rallied up to the previous lows made on the way up, which should act as strong resistance now.
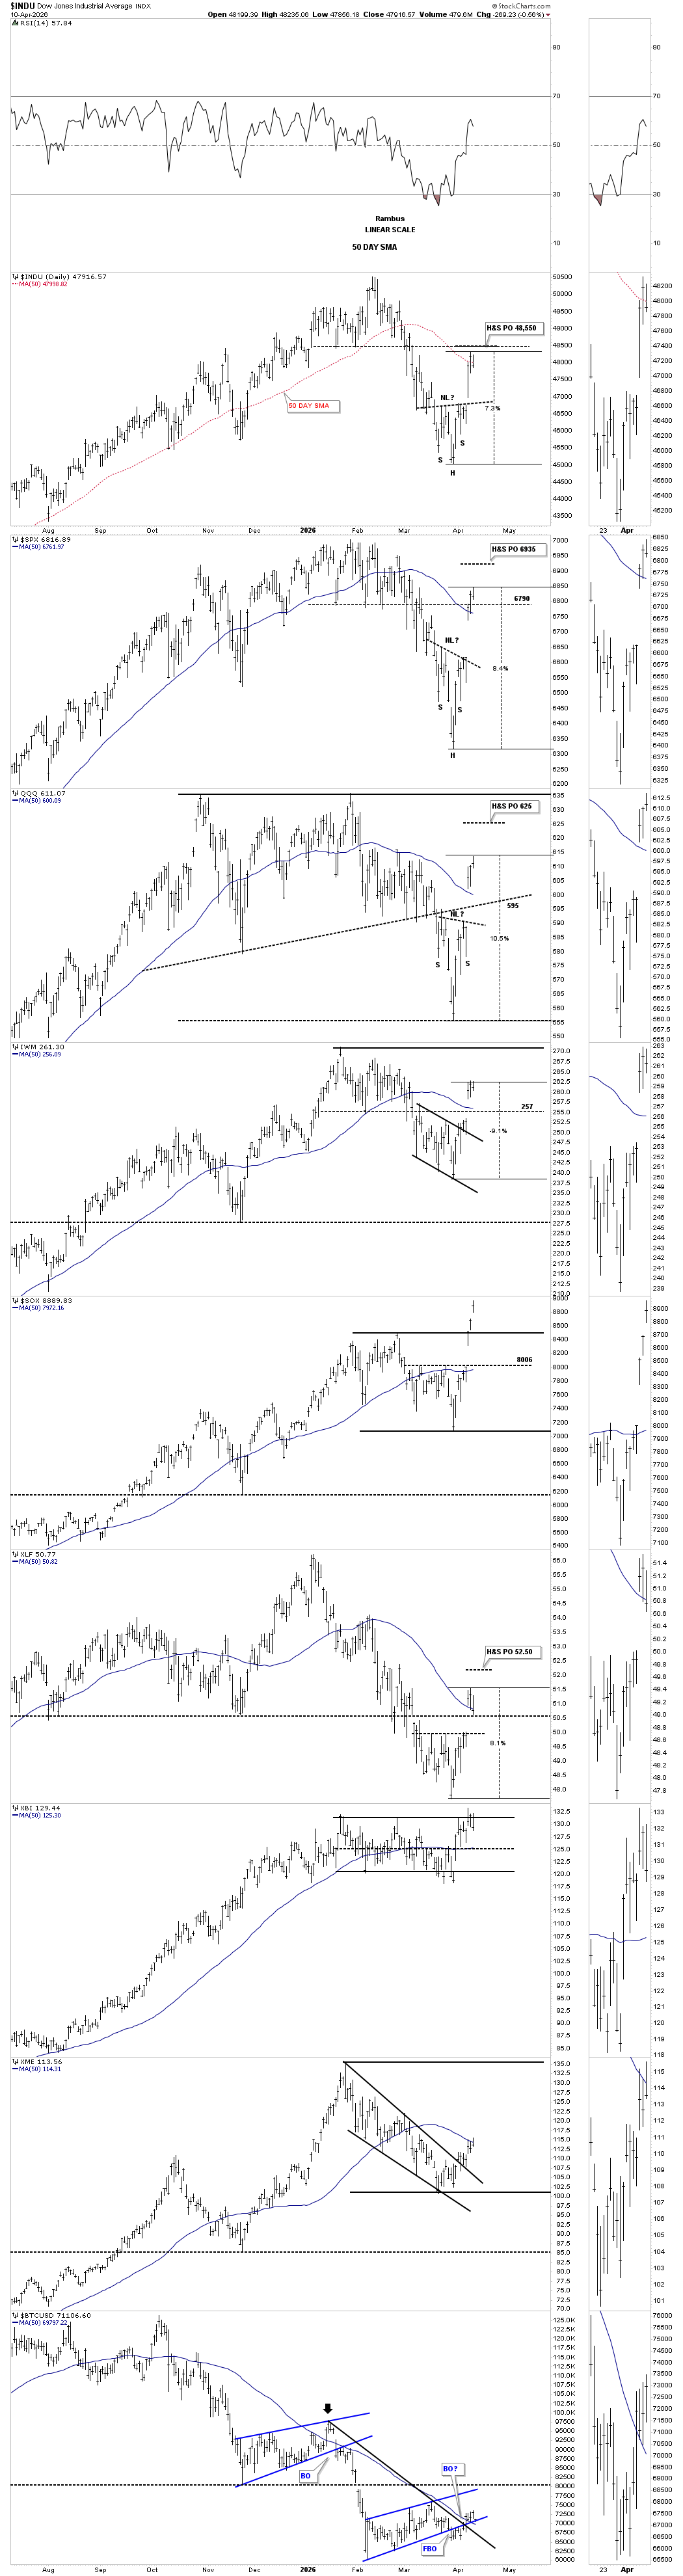
The real truth lies in the 2020 parallel uptrend channels, in many cases with the top trend line holding resistance since the all-time high made in October of last year. This first counter-trend rally began at the center dashed midline of the parallel uptrend channels or other important trend lines. You can also see the blue bearish rising wedge, which formed just below the top trend line of the larger black parallel uptrend channel.
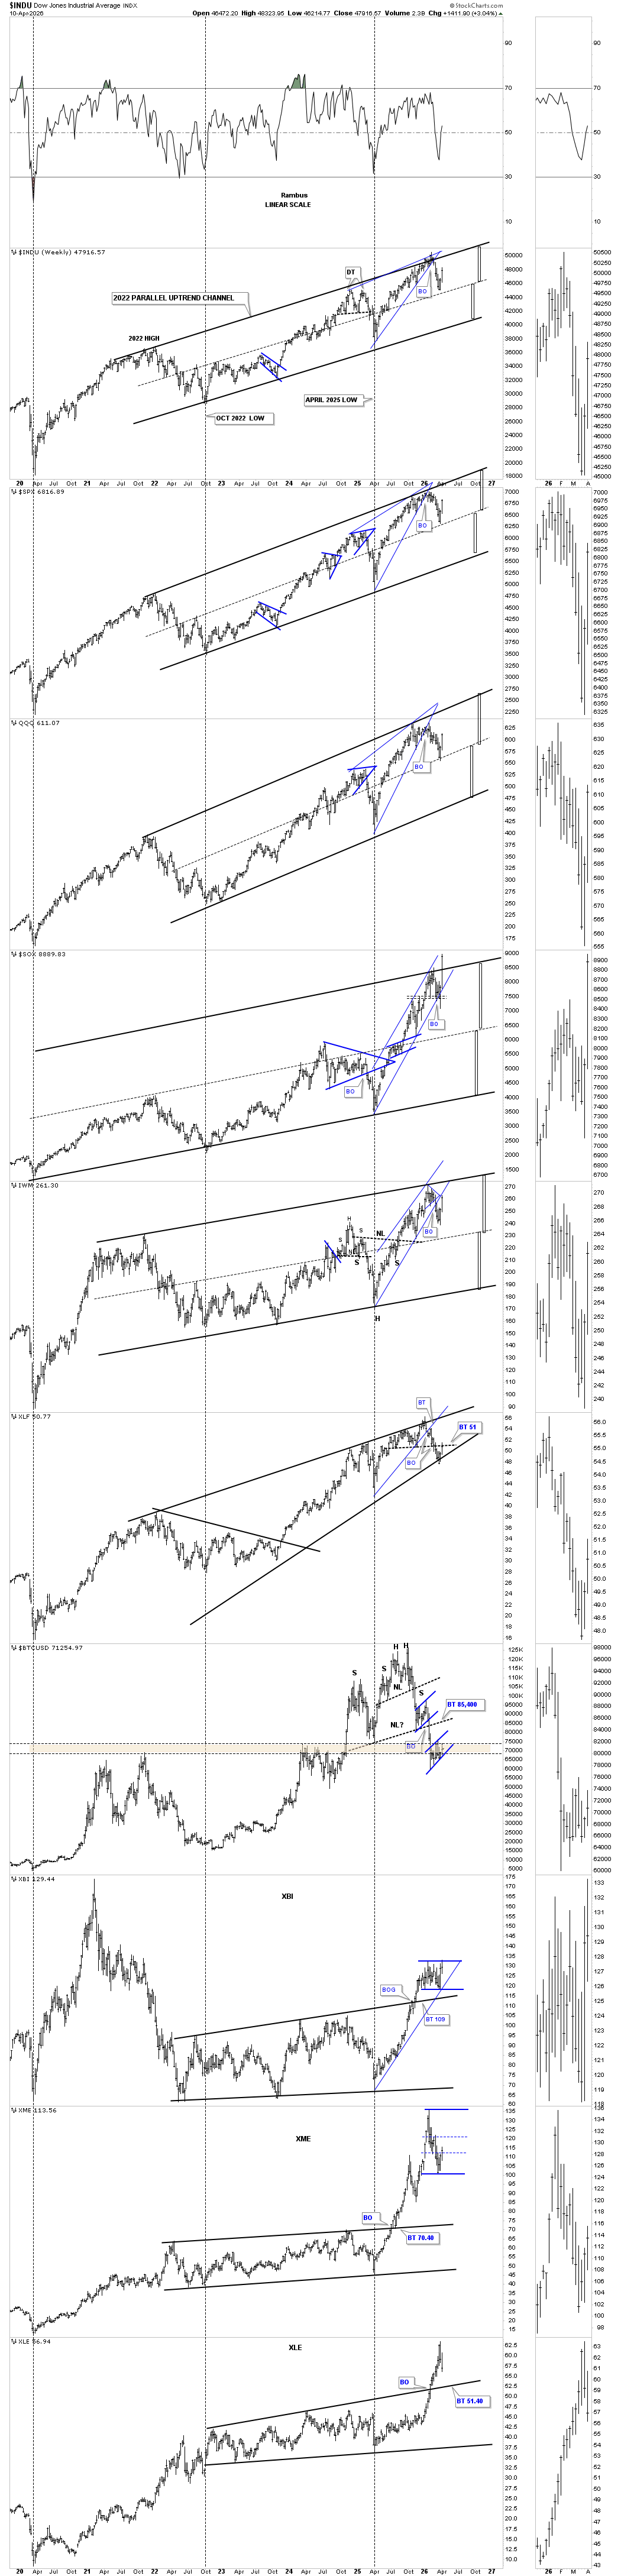
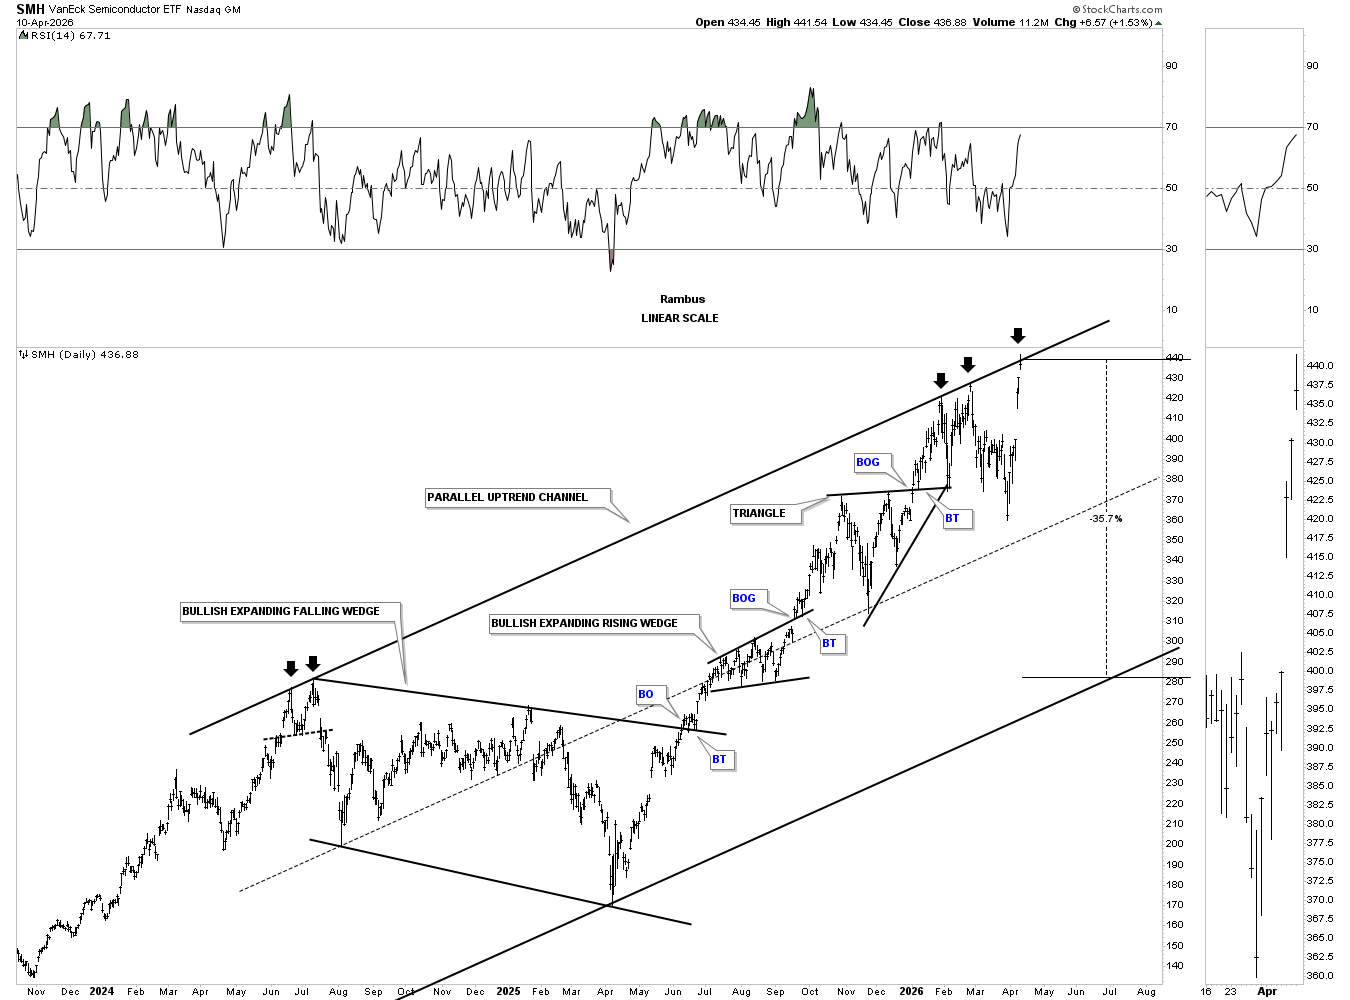
I would like to show you one more chart, which is the SMH semiconductor ETF, which is the strongest area in the markets right now. Last Friday, the price action reached the top trend line of the uptrend channel after being up for 8 days in a row. Last Friday’s touch of the top trend line made 5 hits, telling us the top trend line is very strong and to be respected. Now the question becomes, is this a blowoff top for the semiconductors?
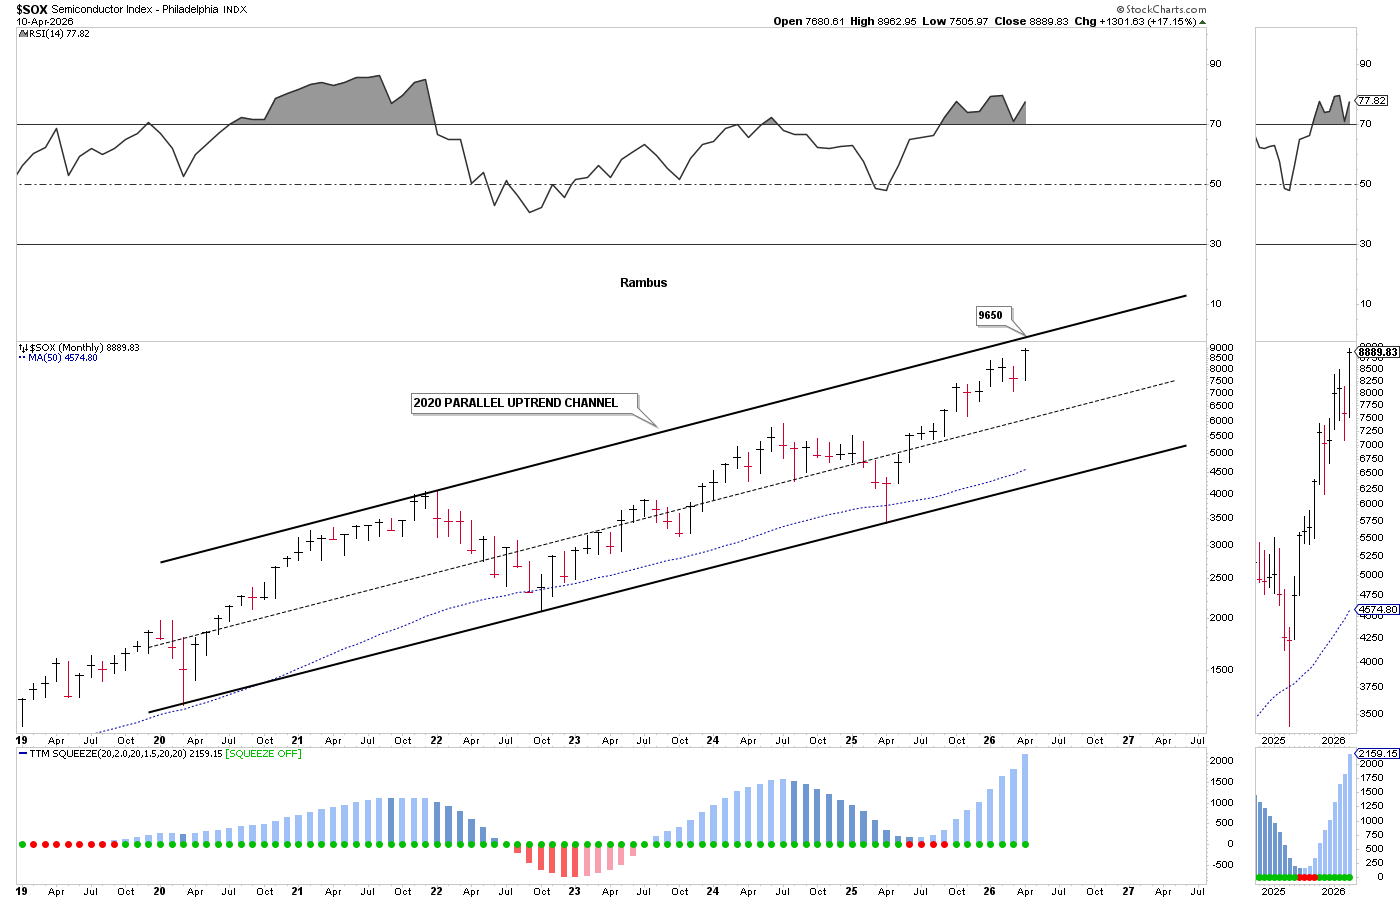
This last chart for tonight is the other semiconductors index we follow, which is the SOX. This monthly chart shows the parallel uptrend channel that starts at the 2020 pandemic crash low. From this perspective, the price action hasn’t quite made it all the way up to the top trend line, but is getting very close.
After tonight’s Weekend Report, you should now have a good understanding of how bull markets work, which is no great mystery. It’s an age-old process that has been going on since charts were first being made. Understanding this simple process can help you navigate the markets with a little more knowledge, which is always a good thing. All the best…Rambus
Related Reading:
Rambus: Blockbuster Chartology – January, 2026
Rambus: Blockbuster Chartology – October, 2025
Rambus: Blockbuster Chartology – July, 2025
Rambus: Blockbuster Chartology – January, 2025
Rambus: Blockbuster Chartology – October, 2024
Rambus: Blockbuster Chartology – July, 2024
Rambus: Blockbuster Chartology – April, 2024
Rambus: Blockbuster Chartology – January, 2024
Rambus: Blockbuster Chartology – October, 2023
Rambus: Blockbuster Chartology – August, 2023
Rambus: Blockbuster Chartology – May, 2023
Rambus: Blockbuster Chartology – January, 2023
Rambus: Blockbuster Chartology – October, 2022
Rambus: Blockbuster Chartology – July, 2022
Rambus: Blockbuster Chartology – May, 2022
Rambus: Blockbuster Chartology – February, 2022
Rambus: Blockbuster Chartology – October, 2021
Rambus: Blockbuster Chartology – July, 2021
Rambus: Blockbuster Chartology – April, 2021
Rambus: Blockbuster Chartology – January, 2021
Rambus: Blockbuster Chartology – October, 2020
Rambus: Blockbuster Chartology – July, 2020
Rambus: Blockbuster Chartology – May, 2020
Rambus: Blockbuster Chartology – January, 2020
Rambus: Blockbuster Chartology – October, 2019
Rambus: Blockbuster Chartology – July, 2019
Rambus: Blockbuster Chartology – April, 2019
Rambus: Blockbuster Chartology – January, 2019
Rambus: Blockbuster Chartology – October, 2018
Rambus: Blockbuster Chartology – July, 2018
Rambus: Blockbuster Chartology – April, 2018
2017 Annual Wrap Up – Does Your Pension Fund Have A Deep State Drain? – January, 2018
1st Quarter Wrap Up 2018 Web Presentation
Blockbuster Chartology with Rambus – October, 2017
Blockbuster Chartology with Rambus – July, 2017
Blockbuster Chartology with Rambus – May, 2017
Blockbuster Chartology with Rambus – January, 2017
Blockbuster Chartology with Rambus – October 20, 2016
Blockbuster Chartology with Rambus – July 21, 2016
Blockbuster Chartology with Rambus – April 21, 2016
Rambus: Are We in a Deflationary Spiral? – January 28, 2016
The Dollar, Gold & the S&P 500 with Rambus – October 15, 2015