
Become a member: Subscribe


































NTS Headlines
Headlines by Category
Headlines by Year
- Money & Markets
- Weekly Solari Reports
- Cognitive Liberty
- Solari Builders
- Ask Catherine
- News Trends & Stories
- Equity Overview
- War For Bankocracy
- Digital Money, Digital Control
- State Leader Briefings
- Food
- Food for the Soul
- Future Science
- Health
- Metanoia
- Solutions
- Spiritual Science
- Wellness
- Building Wealth
- Via Europa











































Solari’s Building Wealth materials are organized to inspire and support your personal strategic and financial planning.




Building Wealth
This 6-pillar curriculum teaches the basic literacy we need to be personally and financially successful and to do so in a manner in which together we evolve a culture that supports the emergence of an advanced human civilization.
















Missing Money
Articles and video discussions of the $21 Trillion dollars missing from the U.S. government

Connect with the wider network of like-minded Solari subscribers using our in-house social media platform, Solari Connect.











No posts
Rambus Blockbuster Chartology

By Catherine Austin Fitts
My “go to” website for technical analysis of precious metals, the US dollar & the US stock market is Rambus Chartology, where Rambus (that’s his handle – he’s the founding technical analyst) leads a discussion with extensive charts of what the markets are saying.
In January 2016, Rambus launched his quarterly Solari Report with a Blockbuster Chartology. You can find links to the entire series of quarterly and annual Blockbuster Chartologies at the end of this latest piece.
One of the reasons that Rambus is so good at his craft is that he focuses on “staying on the right side of the major trend.” The challenge of doing so at this time is that it is tempting to look for bottoms or to assume that the trend upwards in the US dollar or stock market may be over. However, Rambus consistently brings us back to the discipline of the Chartology. What does price tell us? As he describes so aptly, we are dealing with psychological warfare.
Sitting back once each quarter to get this perspective offers invaluable insight. So, here we go for the 2024 1st Quarter Wrap Up Blockbuster Chartology!
Blockbuster Chartology Quarterly Report
By Rambus
~ 2024 1st Quarter Wrap Up ~
Gold’s Confirmed Breakout
Commodities & Inflation
Melt Up Or Secular Bull Market Rally
Gold : Before And After Pictures
Gold’s Confirmed Breakout
I know the title of this Weekend Report may sound a little bold, but after tracking the 2020 trading range from every imaginable point of view I can say with a strong vote of confidence that the beginning of the next important advance in its secular bull market for Gold, that began at the 2000 low, is underway.
We could still see a backtest to the breakout point, but that would just be part of the breaking out and backtesting process.
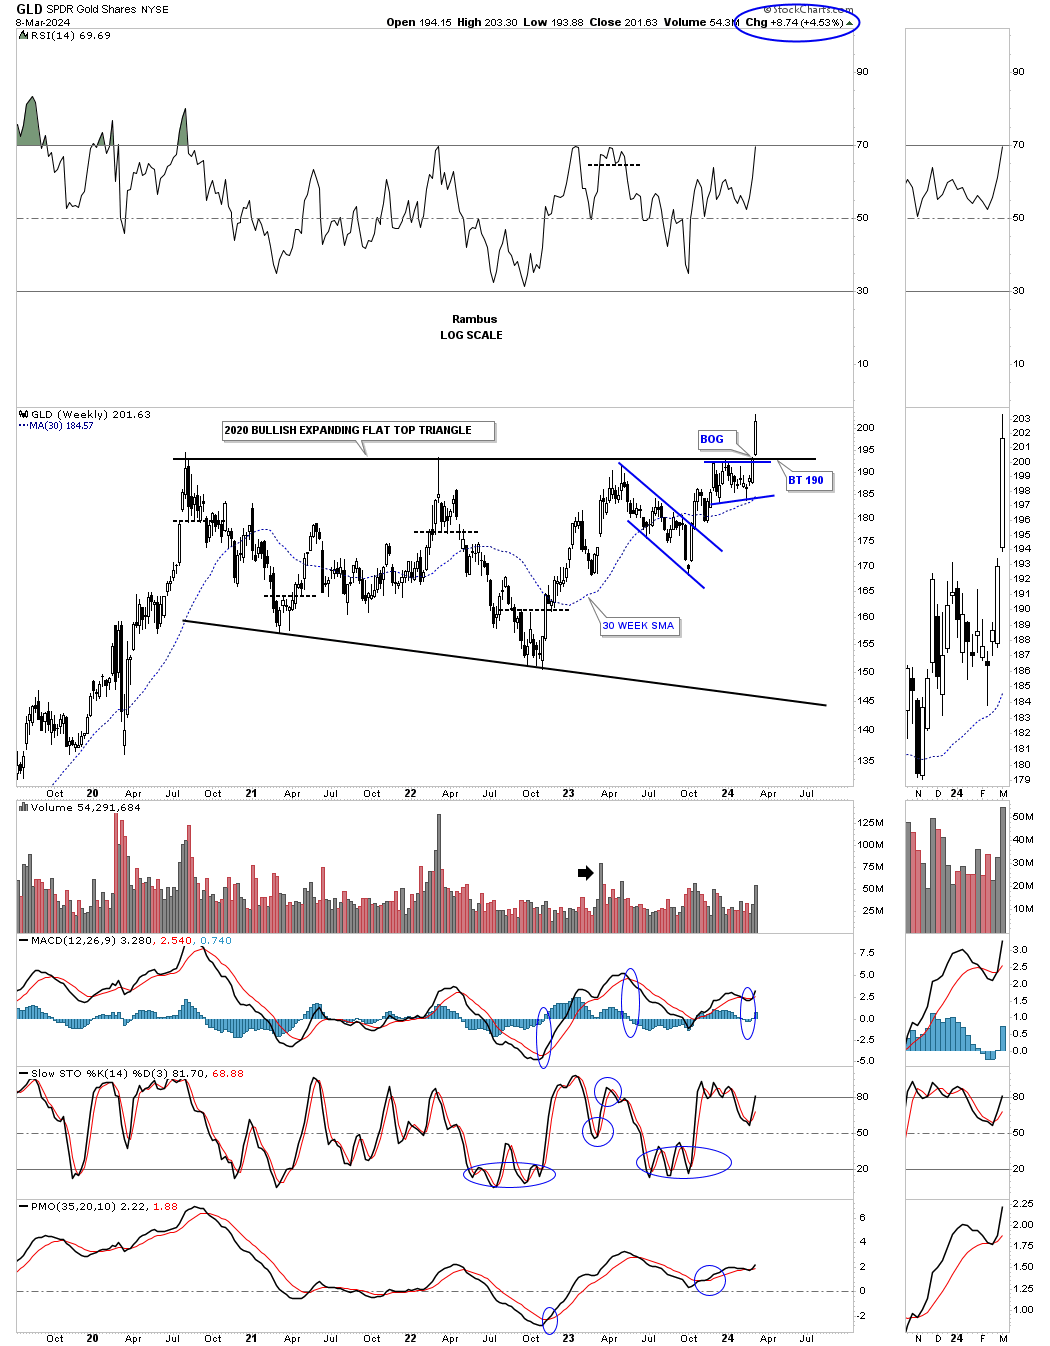
Lets start with the weekly chart for the GLD which shows the 2020 trading range which I’ve labeled as a flat top expanding triangle. This nearly 4 1/2 year consolidation pattern can also be called a cup and handle or a H&S consolidation. At this point it’s just semantics.
Last Monday March 4th you can see the breakout from the 2020 bullish expanding falling wedge. Its a bit hard to see on this long term weekly chart, but if you look at the thumbnail on the right sidebar you can see the breakout gap that occurs on Monday. The top trendline of the 2020 trading range has always been tough to figure out exactly where to draw it, you know one was there, but there were several different ways it could have been drawn. With the breakout gap last Monday there is no doubt on how the top rail can now be applied.
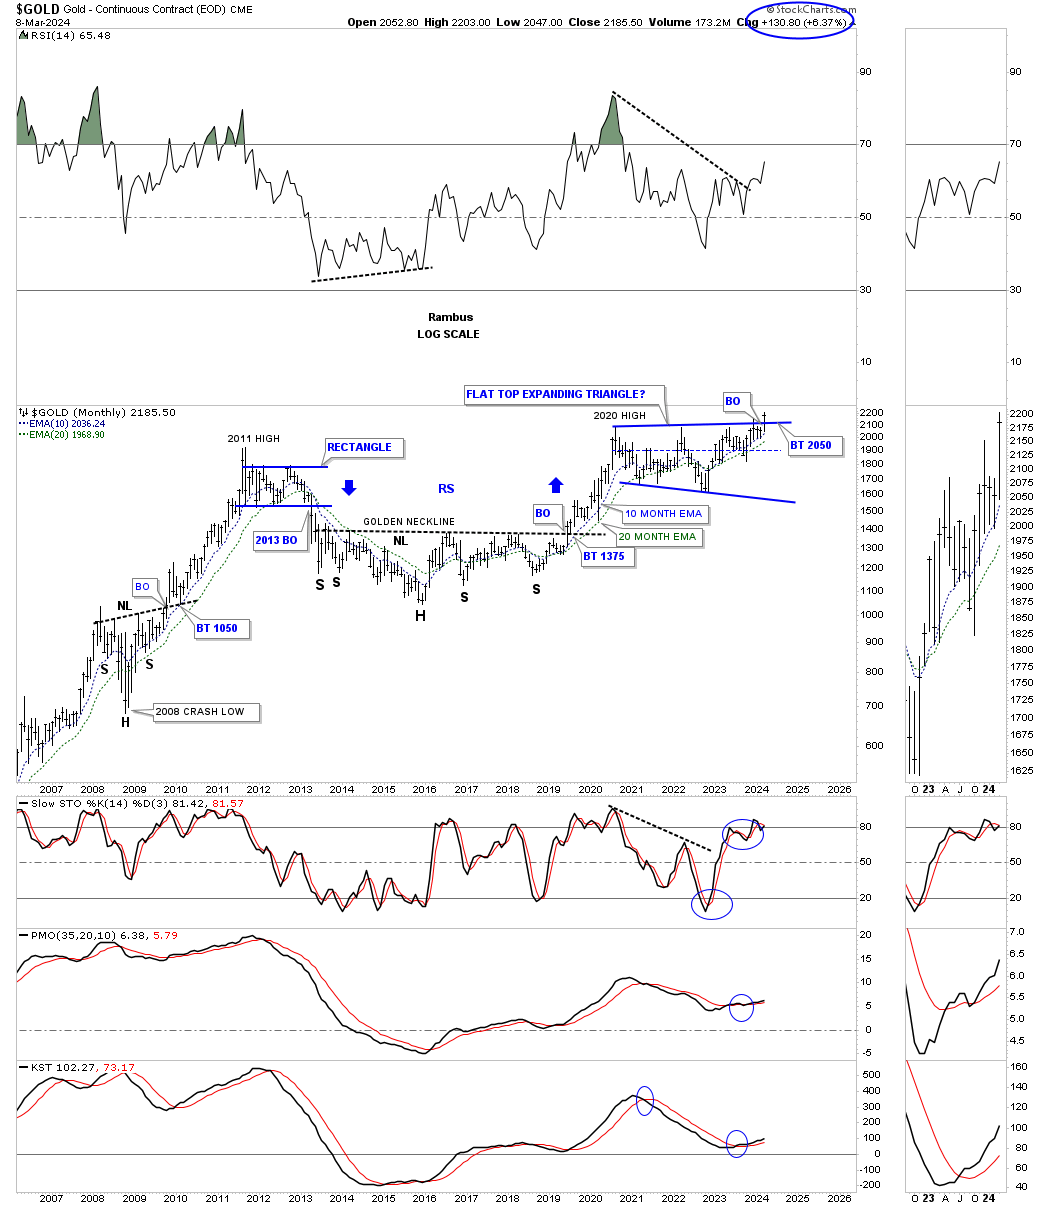
Next is a longer term monthly chart which puts the 2020 trading range into perspective. This chart starts at the 2008 crash low where Gold formed a beautiful H&S consolidation pattern which launched Gold on its way to the 2011 all time high.
Next came the bear market which bottom in 2016 which created the head of the very large 2016 H&S consolidation pattern. The breakout from the 2016 H&S consolidation pattern led to the next important impulse move which topped out just above the 2011 high in 2020.
Keep in mind the job of a consolidation pattern is to sow doubt in your mind about the validity of the bull market and after 4 1/2 years few will have a hard time adjusting to the new paradyme shift that is now taking place from consolidation to impulse. Also the bigger the consolidation pattern the bigger the impulse move.
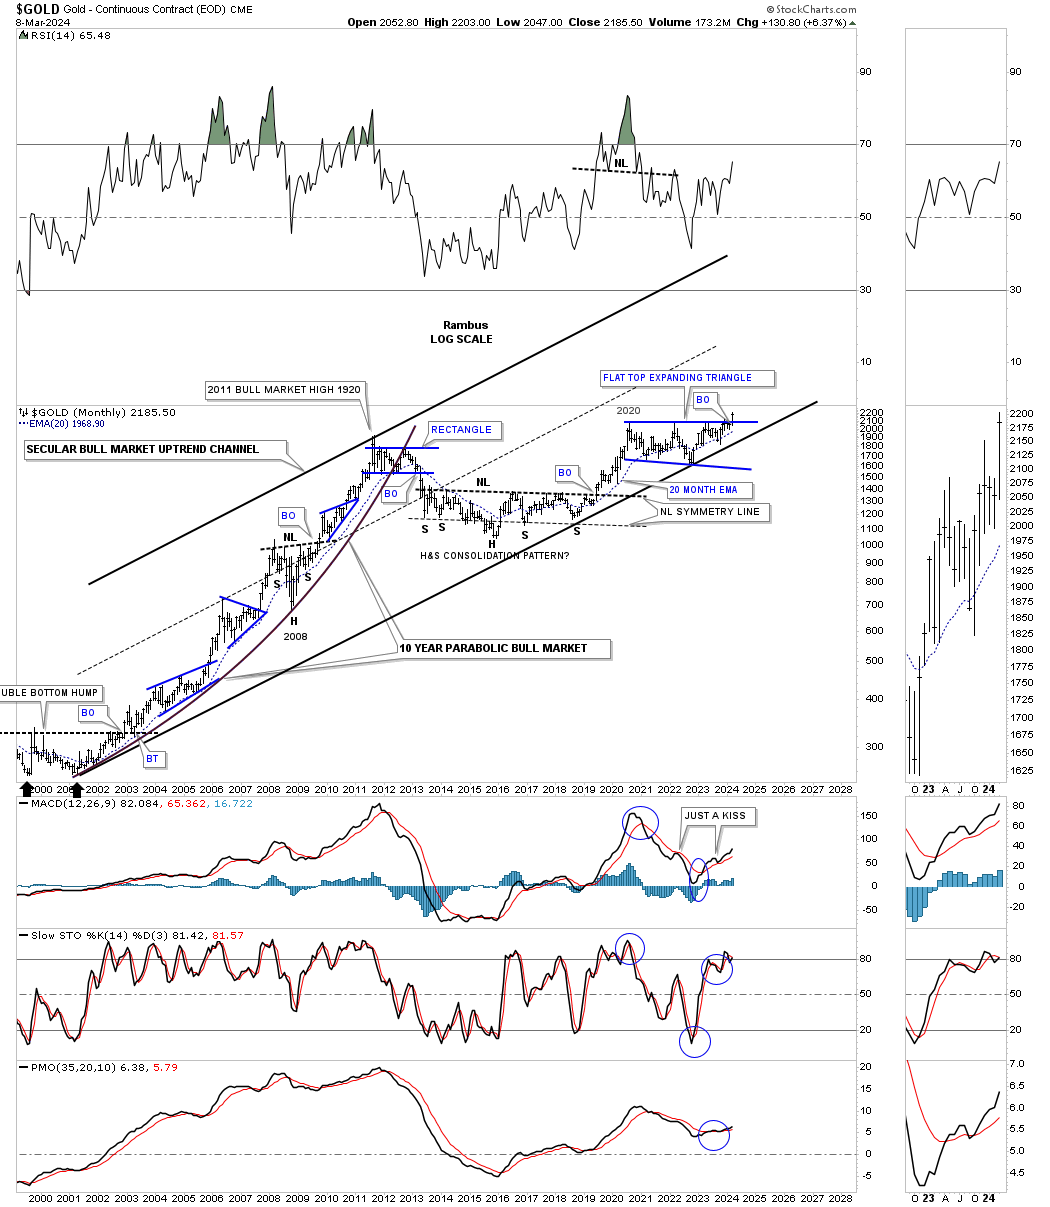
In Friday’s Market Update I mentioned how the QQQ has overtaken the beautiful Chartology of the bull market consolidation patterns that Gold had made during its 2000 to 2011 bull market run with one consolidation pattern forming on top of the previous one as shown on the chart below. Even on this log scale chart you can see the bull market was going parabolic into the 2011 high.
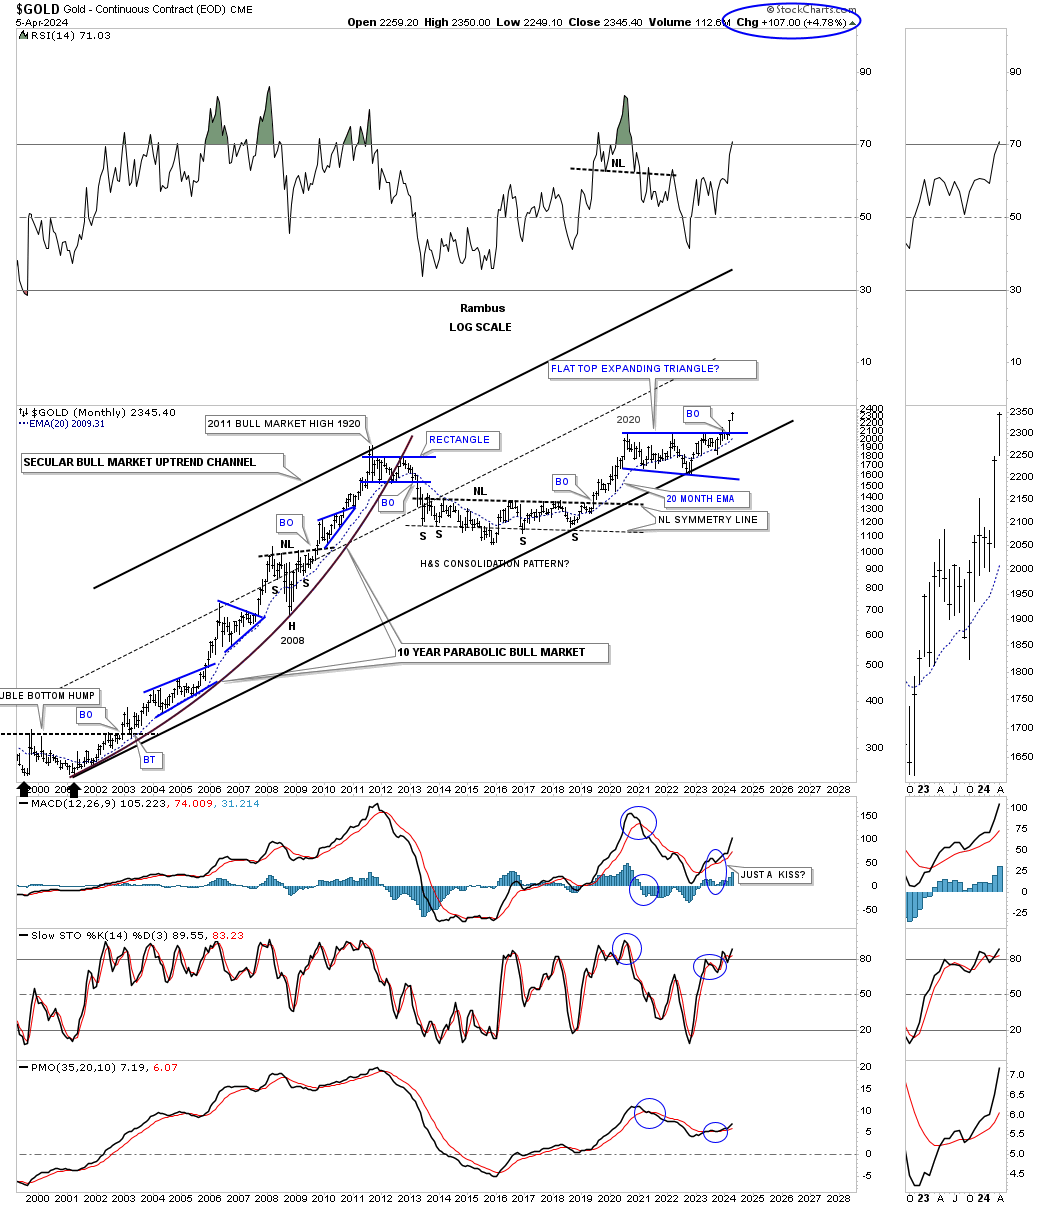
As you can see the bottom trendline of the 2000 secular bull market uptrend channel has been tested on several occasions with the last one being the October 2022 low. Now we can see the monthly bar all by itself above the top rail of the 2020 trading range. Also note how well the 20 month ema has held support during strong advances.
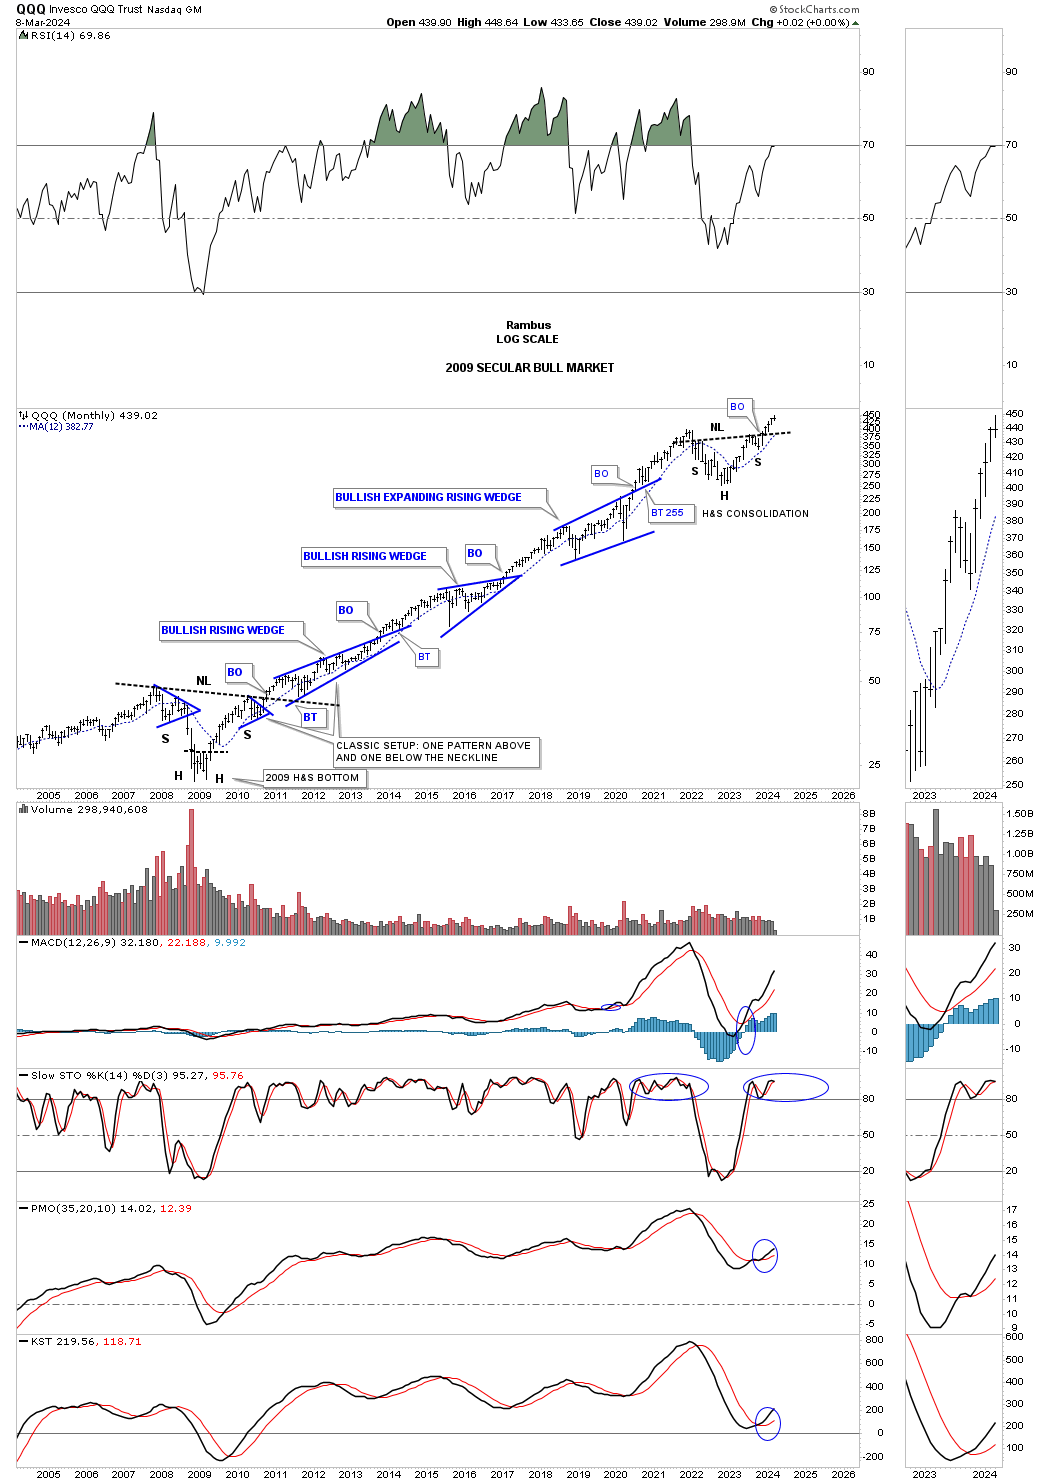
This monthly chart for the QQQ shows its secular bull market that began at the 2009 crash low and the beautiful Chartology with one consolidation pattern forming on top of the previous one and now holds the crown for the best looking secular bull market vs the Gold 2000 to 2011 bull market.
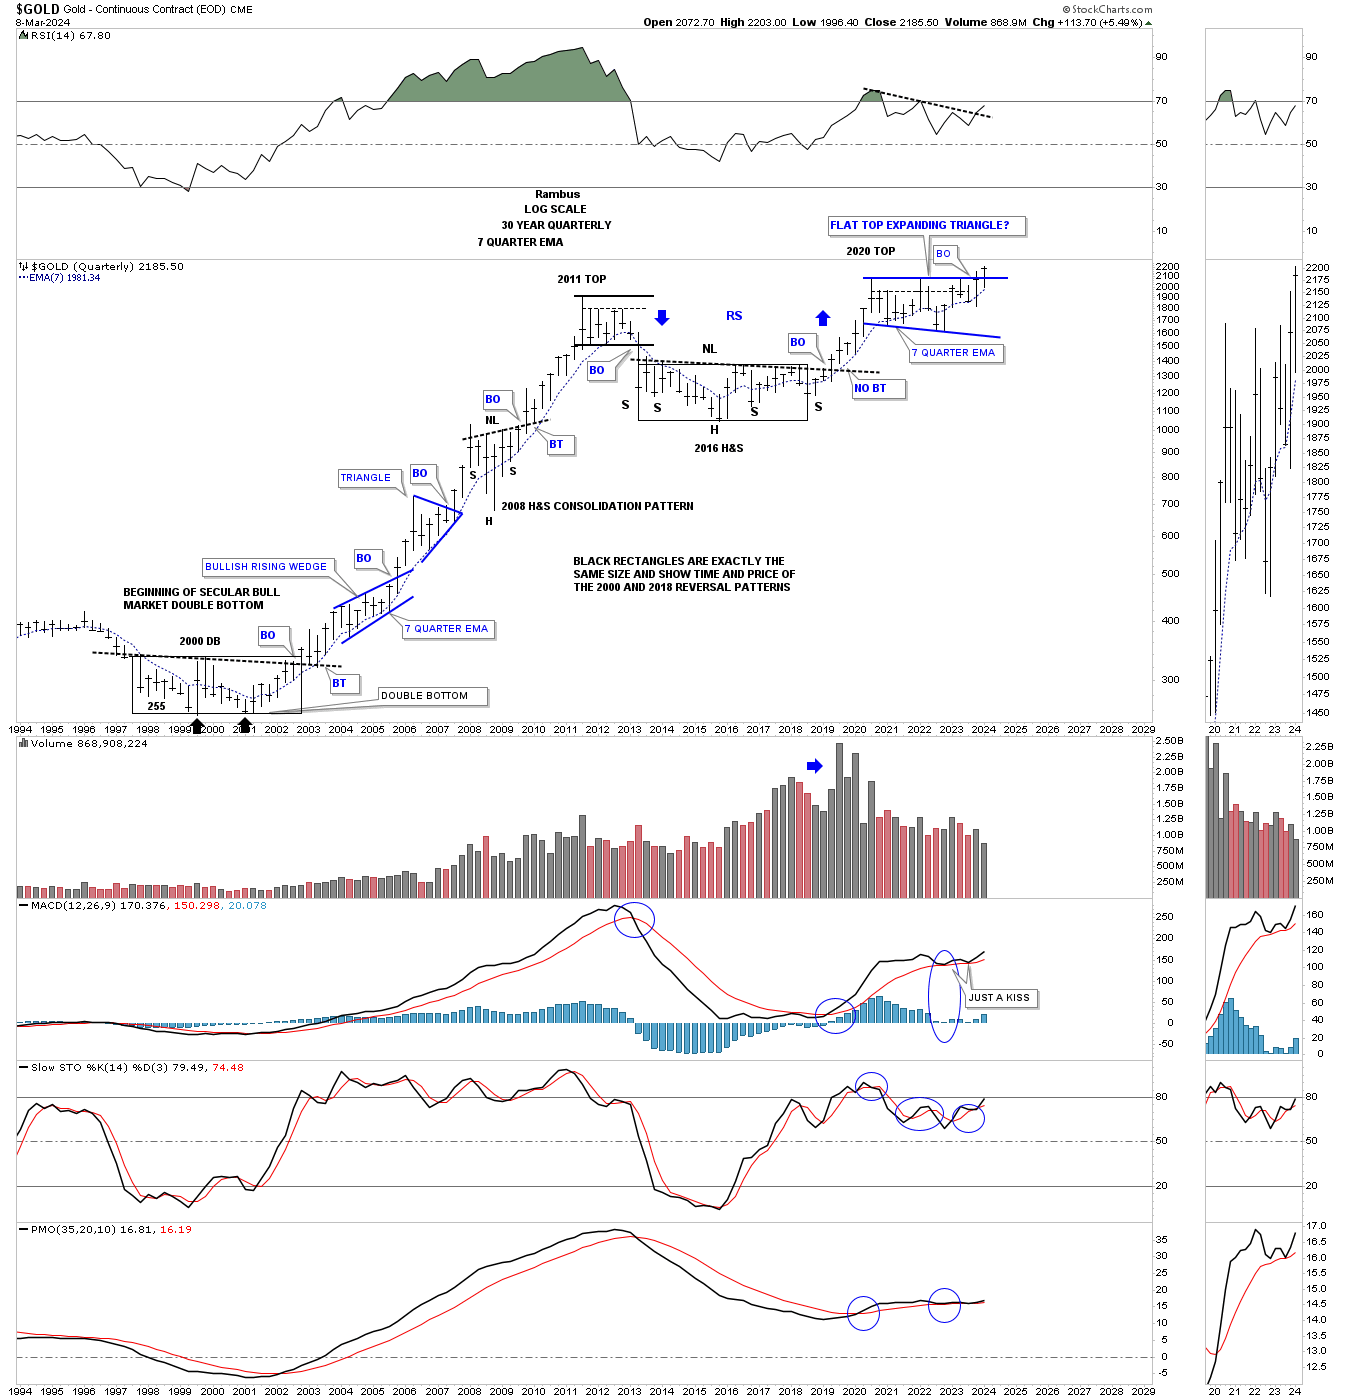
This 50 year quarterly chart compares the 2000 base to the 2016 base with both rectangles being exactly the same size measuring time and price. It the 2000 base was large enough to launch an eleven year bull market it would make sense that the 2016 base should be big enough to launch a similar bull market.
The first consolidation pattern that formed when Gold broke out of the 2000 double bottom base was the blue bullish rising wedge. The first consolidation pattern to have formed since the breakout from the 2016 base is the 2020 blue flat top expanding triangle. Note the impulse moves when a consolidation or reversal pattern is complete.
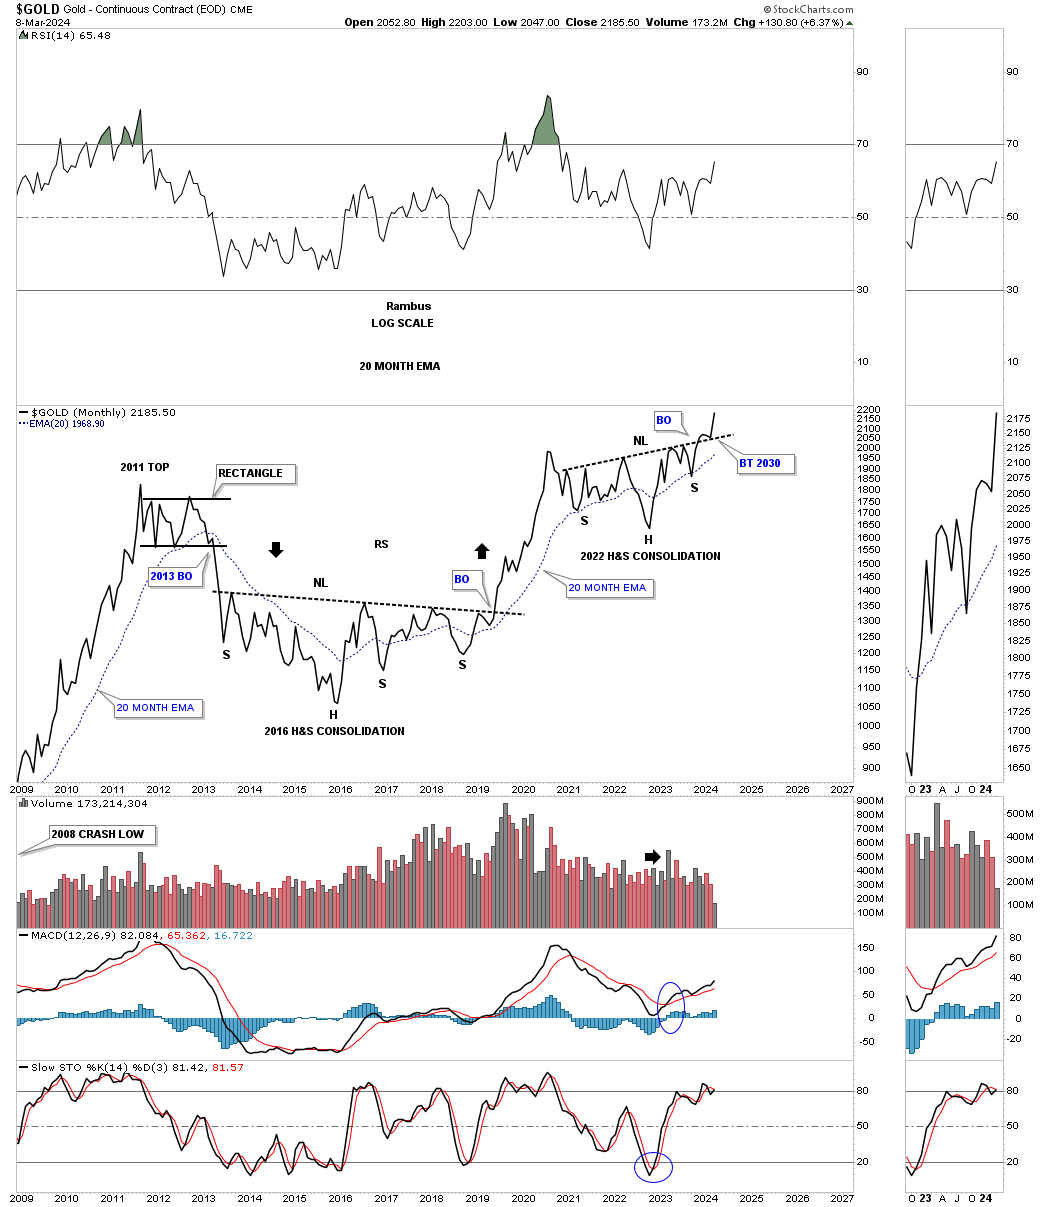
From a monthly line chart perspective you can see the 2016 H&S base and the 2022 H&S consolidation pattern which now shows a breakout and backtest to the neckline with the new impulse move beginning.
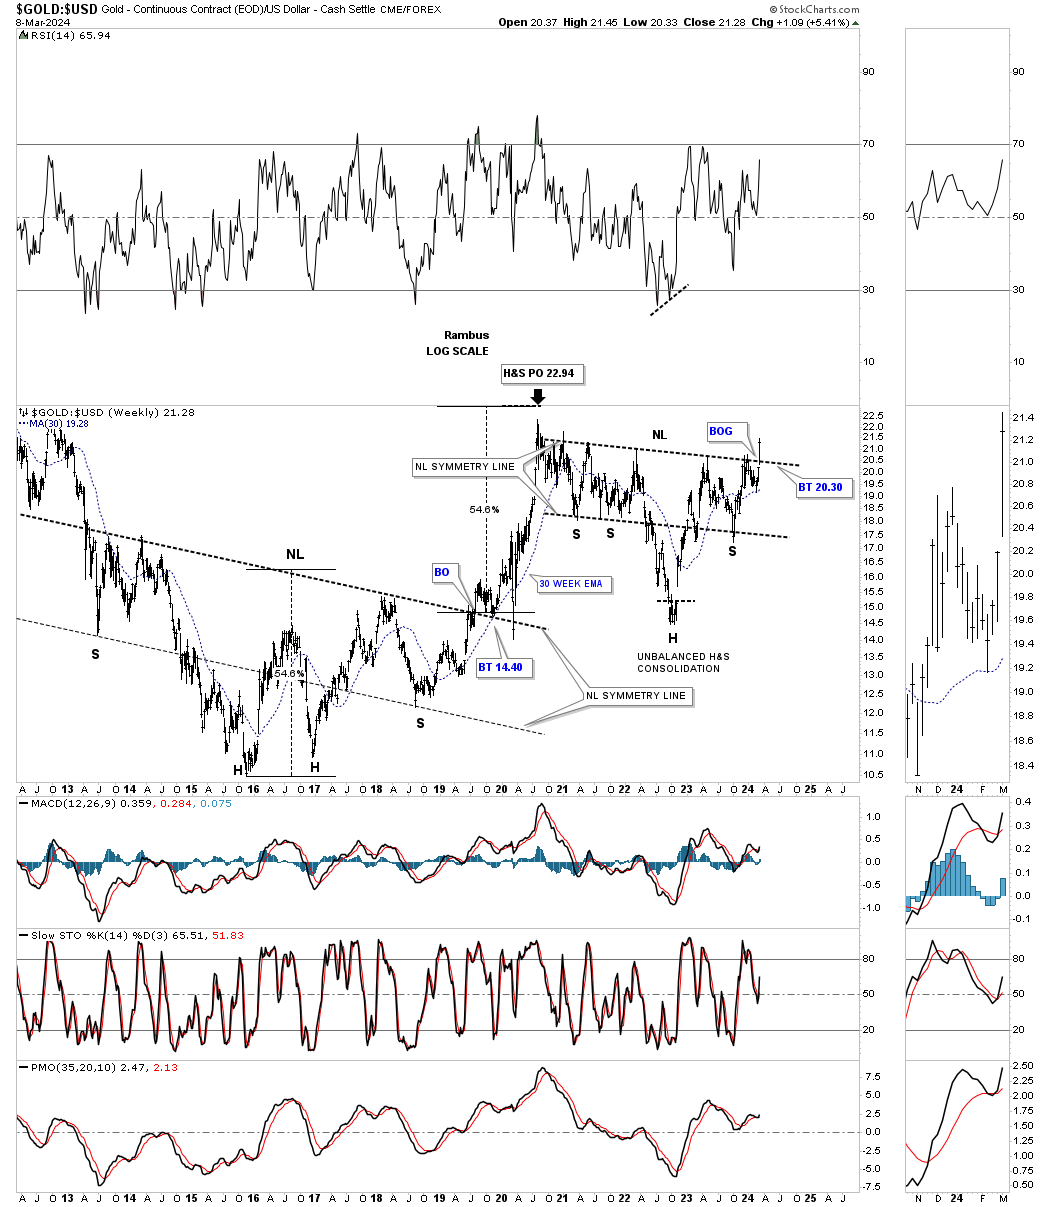
Another big clue that the 2020 correction is over for Gold is this ratio chart which compares Gold:US dollar. Note the very large H&S bottom that formed when Gold was building out its own 2016 H&S base. The neckline symmetry line showed us the low for the right shoulder. You can also see how close the price objective was to the actual high that was made at the 2022 high. Again, last Monday you can see a breakout gap above the neckline of the unbalanced H&S consolidation pattern, see thumbnail on right sidebar of the chart for a better view. We need to see Gold outperforming the US dollar, the stronger the better. Also note how the 2022 neckline symmetry line showed low once again for the right shoulder.
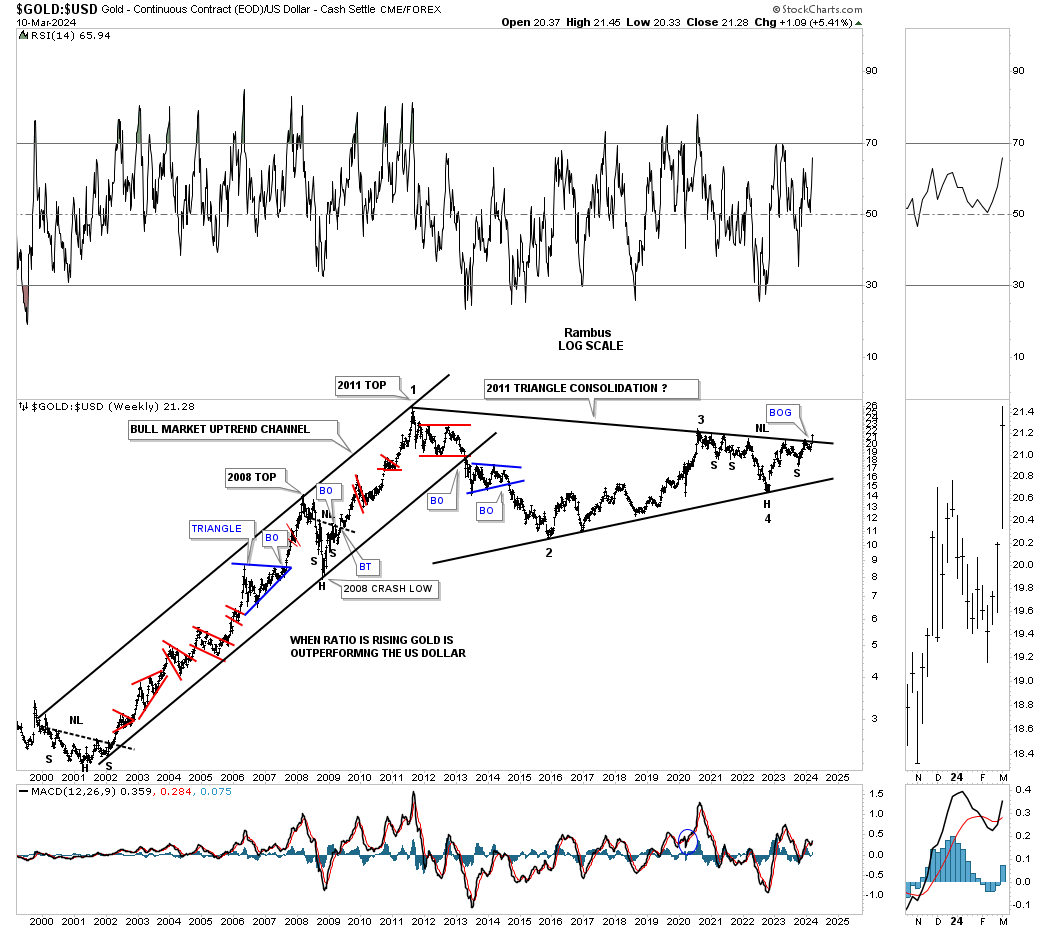
Lets take the Gold:USD ratio a step further and go all the way back to the 2000 low. As you can see Gold outperformed the US dollar for eleven years with only small consolidation patterns along the way.
Once again look at the thumbnail on the right sidebar which shows the breakout gap from last Mondays breakout move above the 2011 triangle consolidation pattern. We’ve literally been following this massive triangle for several years and to finally see it come to fruition it’s pretty rewarding. Big patterns lead to big moves.
Note the H&S consolidation pattern on the chart above. You can see how it fits into the apex of the 2011 triangle which was strongly suggesting the top trendline was going to give way.
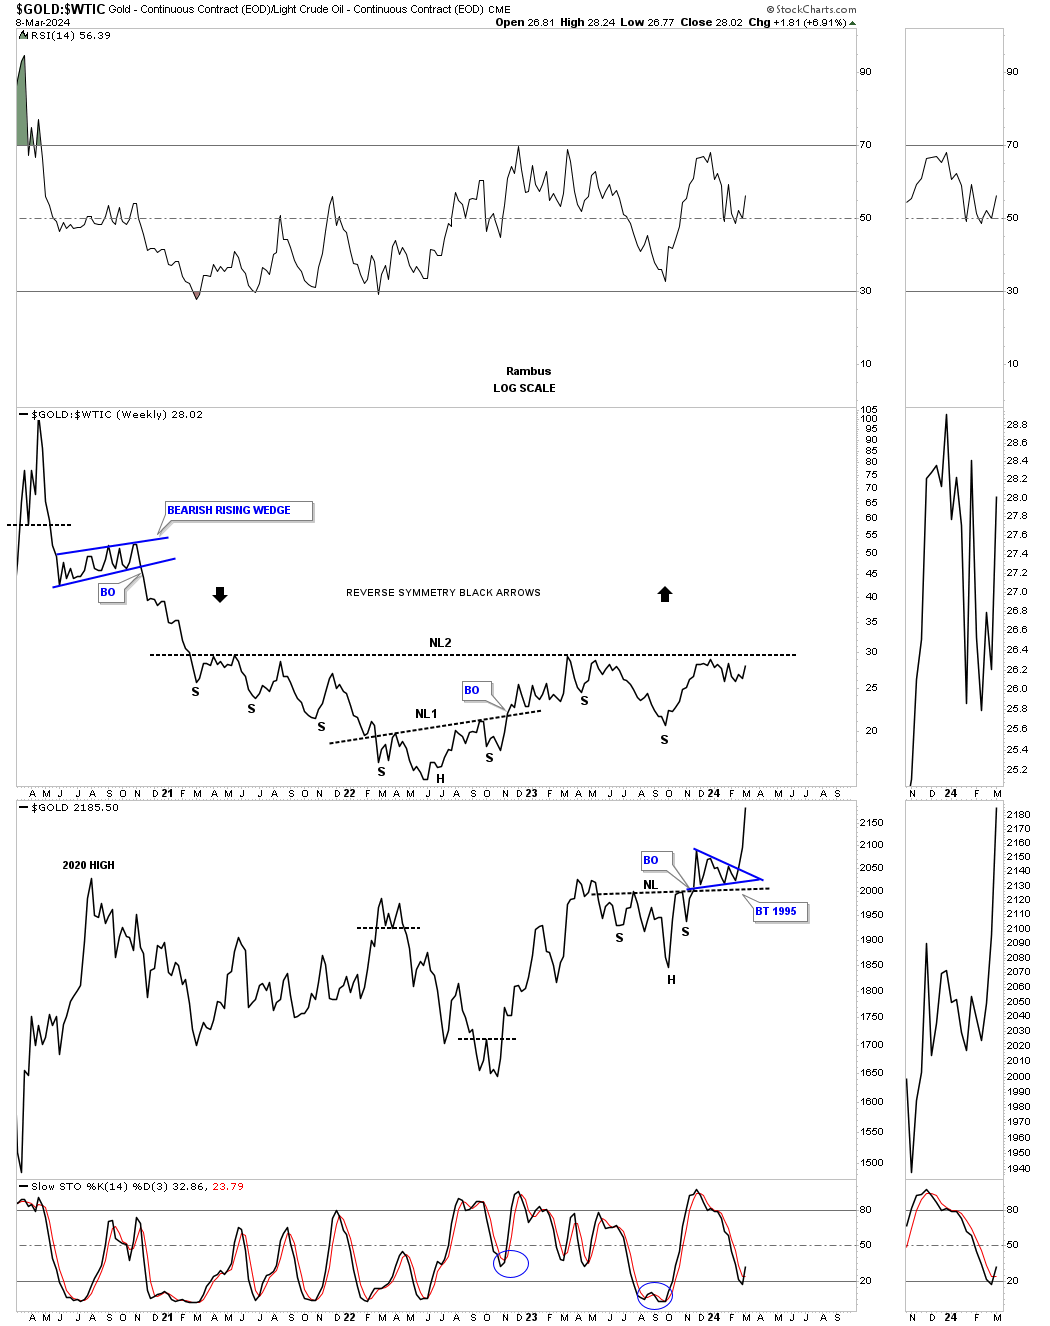
Below is a ratio combo combo chart with the Gold:WTIC on top with Gold on the bottom. There is still a bit of work to do on the ratio chart, but if the neckline is taken out to the upside that should be a good tailwind for the entire PM complex.
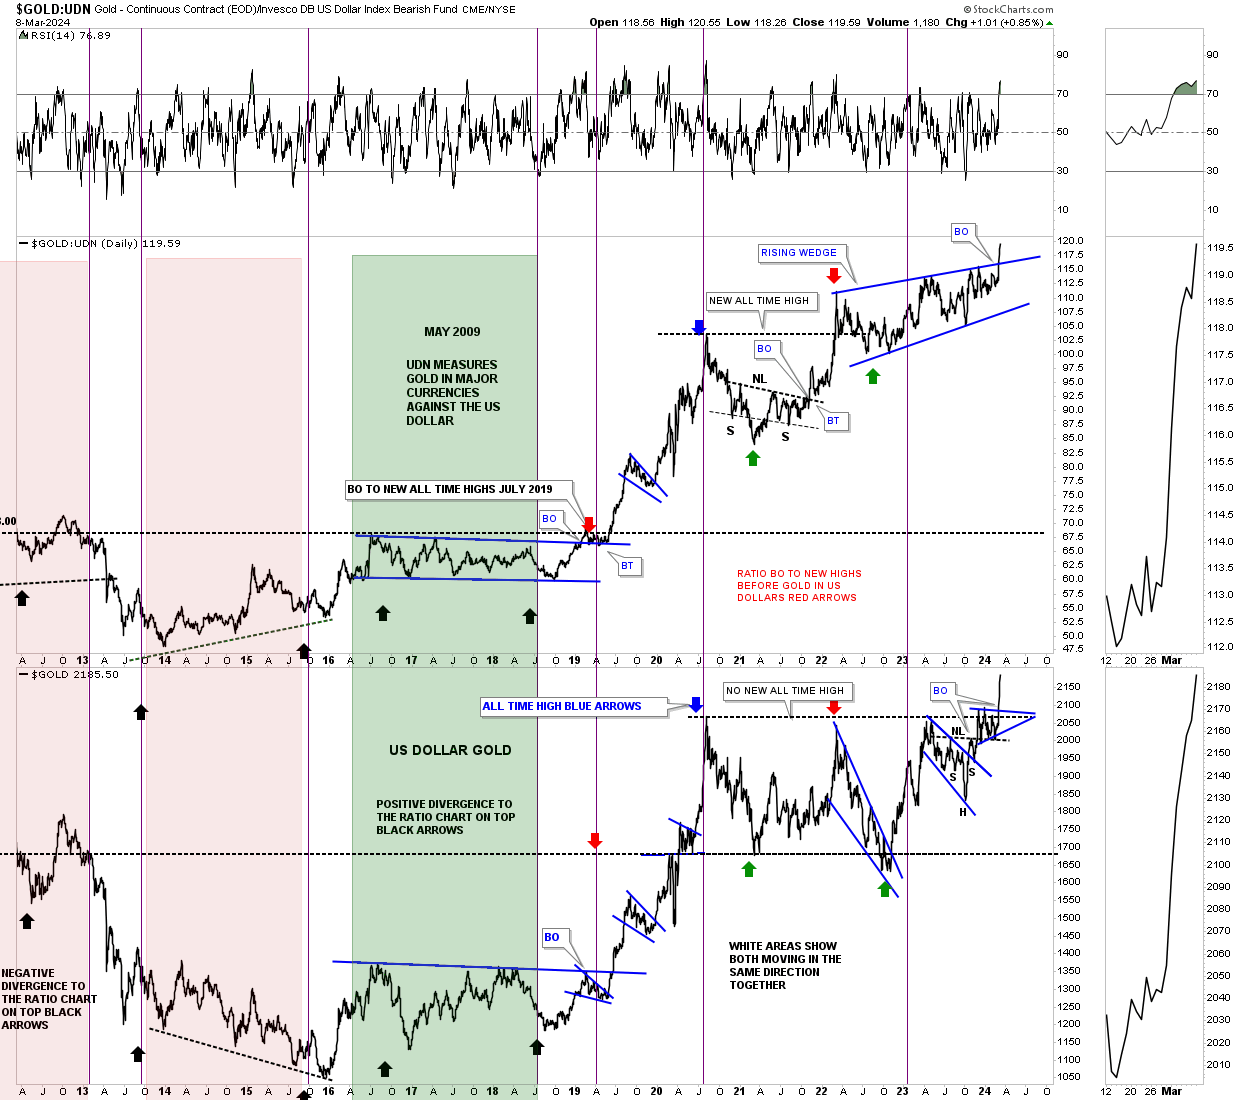
Another major clue took place last week on this ratio combo chart which compares Gold:UDN on top with Gold on the bottom. The Gold:UDN ratio shows how Gold is performing in many of the important currencies of the world ex the US dollar. As you can see the 2022 blue bullish rising wedge broke out into new all time high territory. It doesn’t happen all the time, but Gold in US dollars on the bottom chart also broke out into new all time high territory. Your best rallies in Gold come when both are moving up together.
Gold can have its strongest rallies when it’s outperforming the SPX. Since the 2011 high you can see, compared to the SPX, Gold has been declining even though it is at record highs. There could be a possible bright spot at the bottom of the chart where the ratio may have completed a false breakout below the blue rectangle which could now setup as a bear trap. Since the ratio is trading back inside of the blue rectangle the breakout is negated for now.
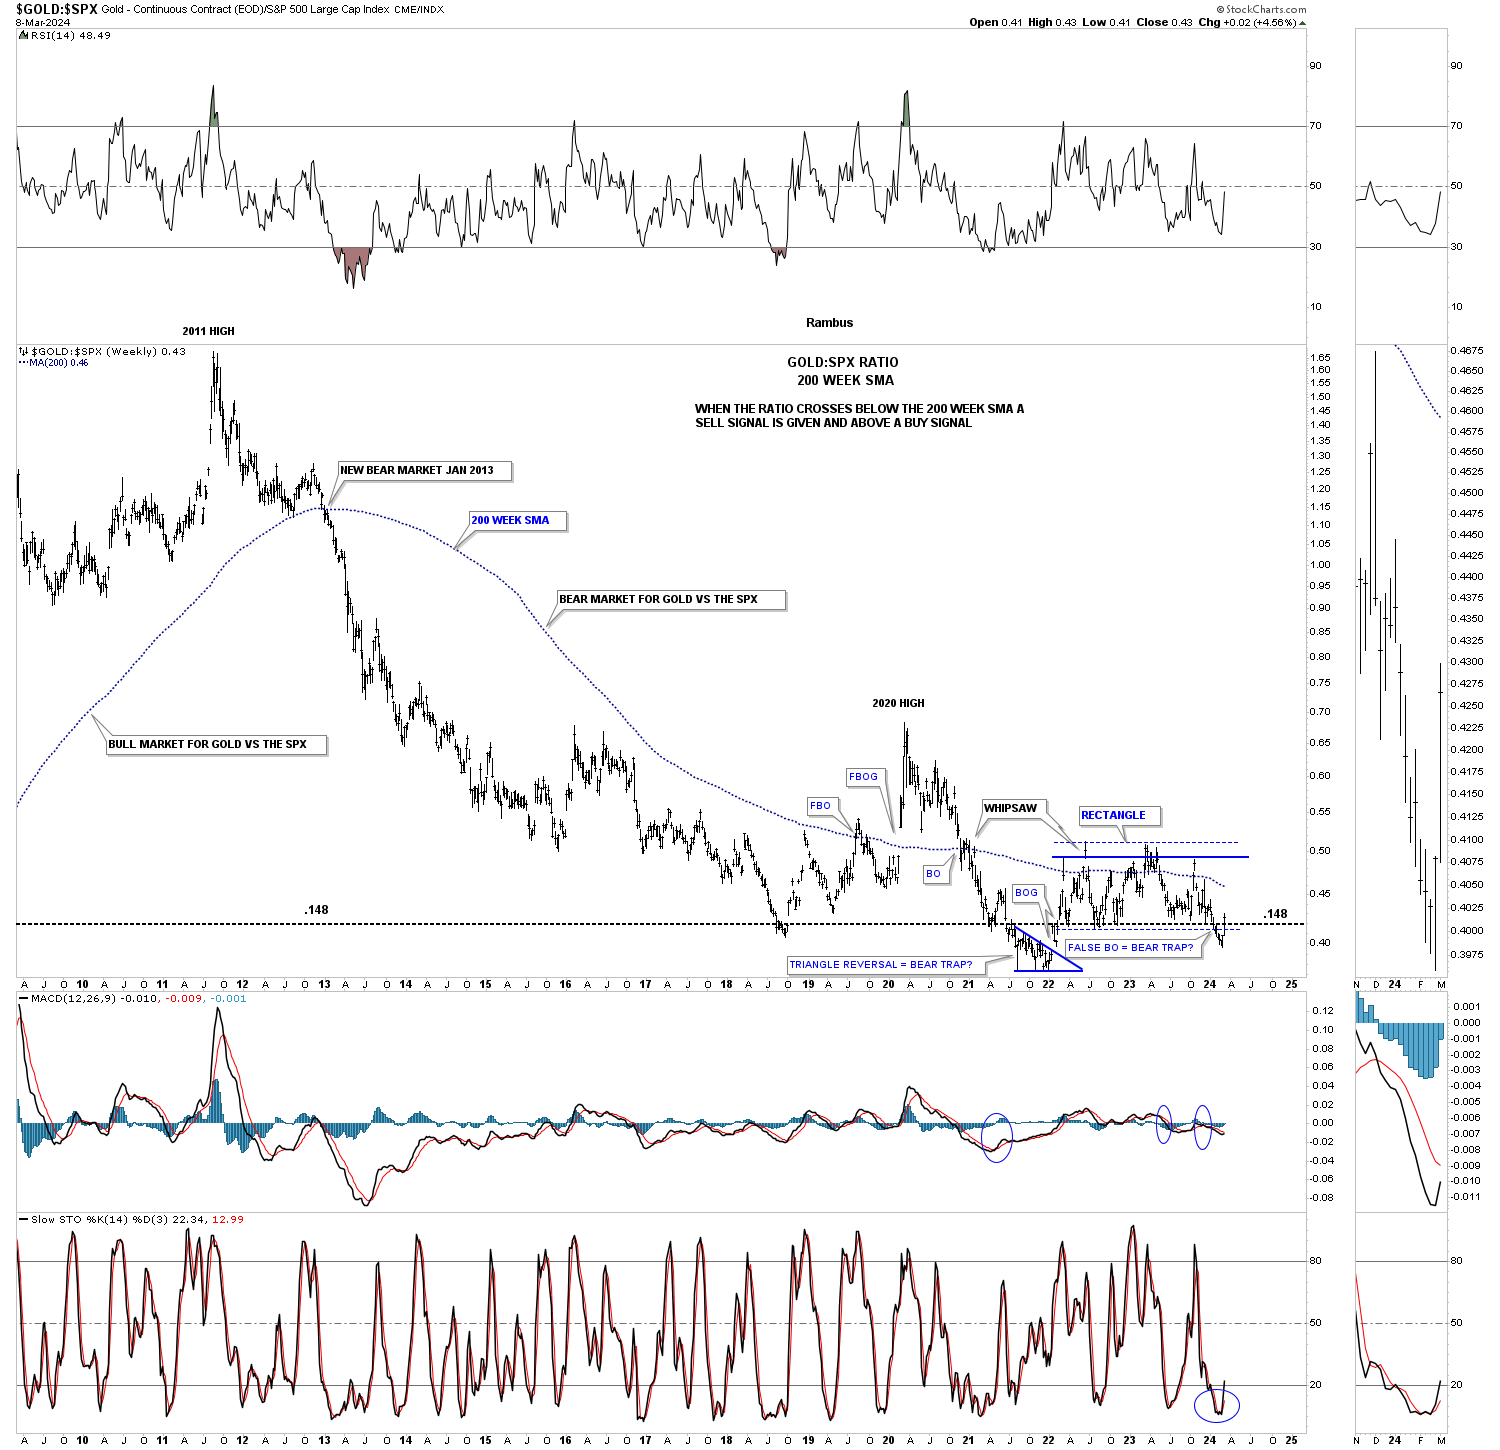
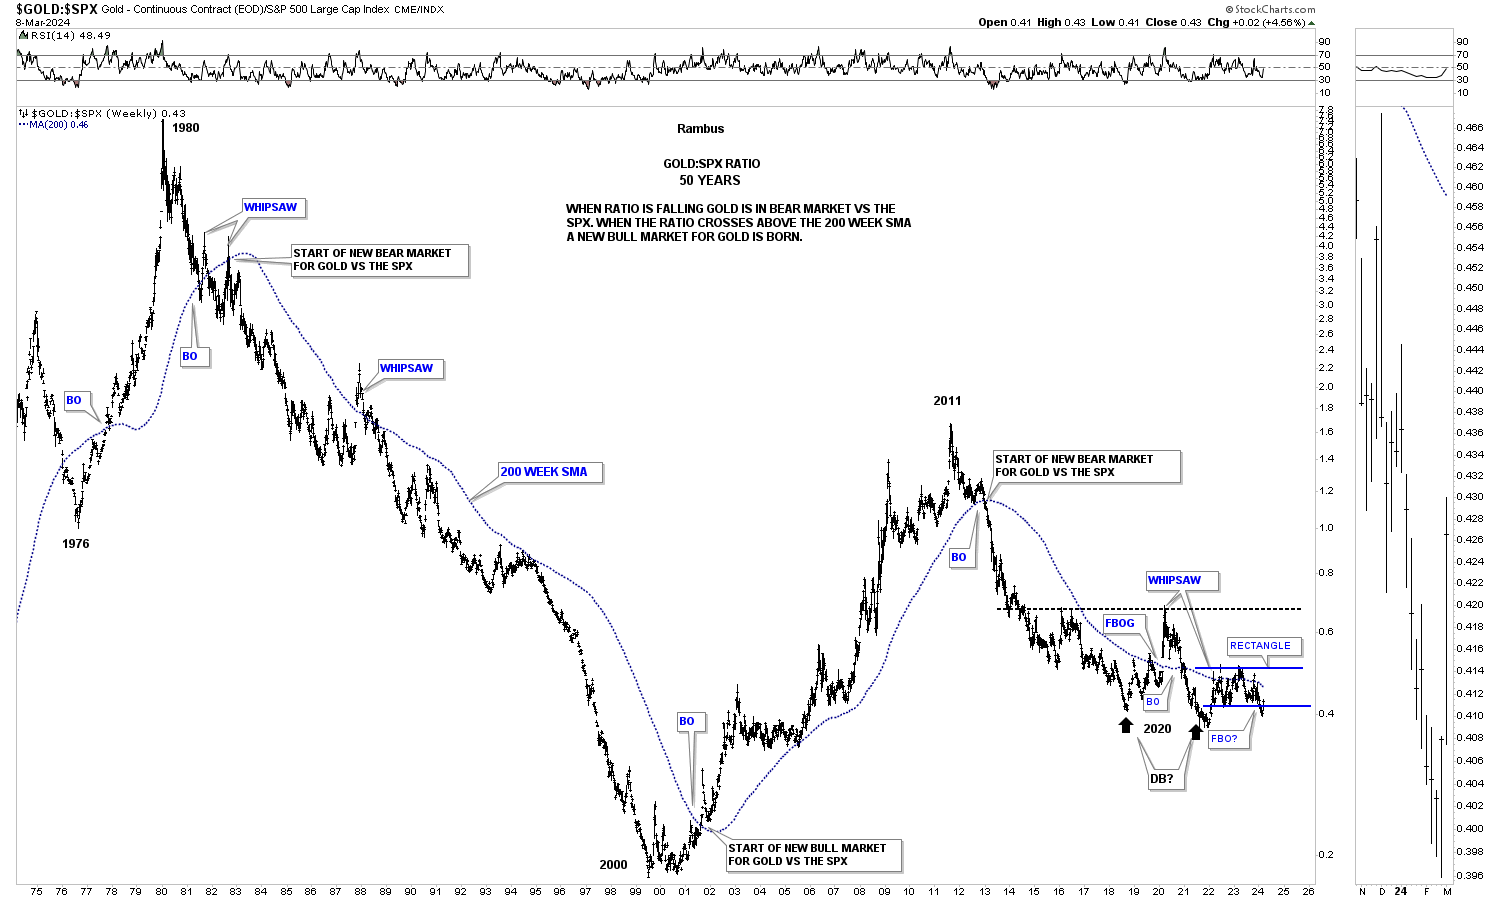
Below is a much longer term 50 year chart for the Gold:SPX ratio using the 200 week sma. The 200 week sma does a very good job of keeping you on the right side of the trend. When the ratio is falling the SPX is outperforming Gold and vise versa in the other direction. There is an occasional whipsaw, but the 200 week sma lets you know who’s stronger Gold or the SPX.
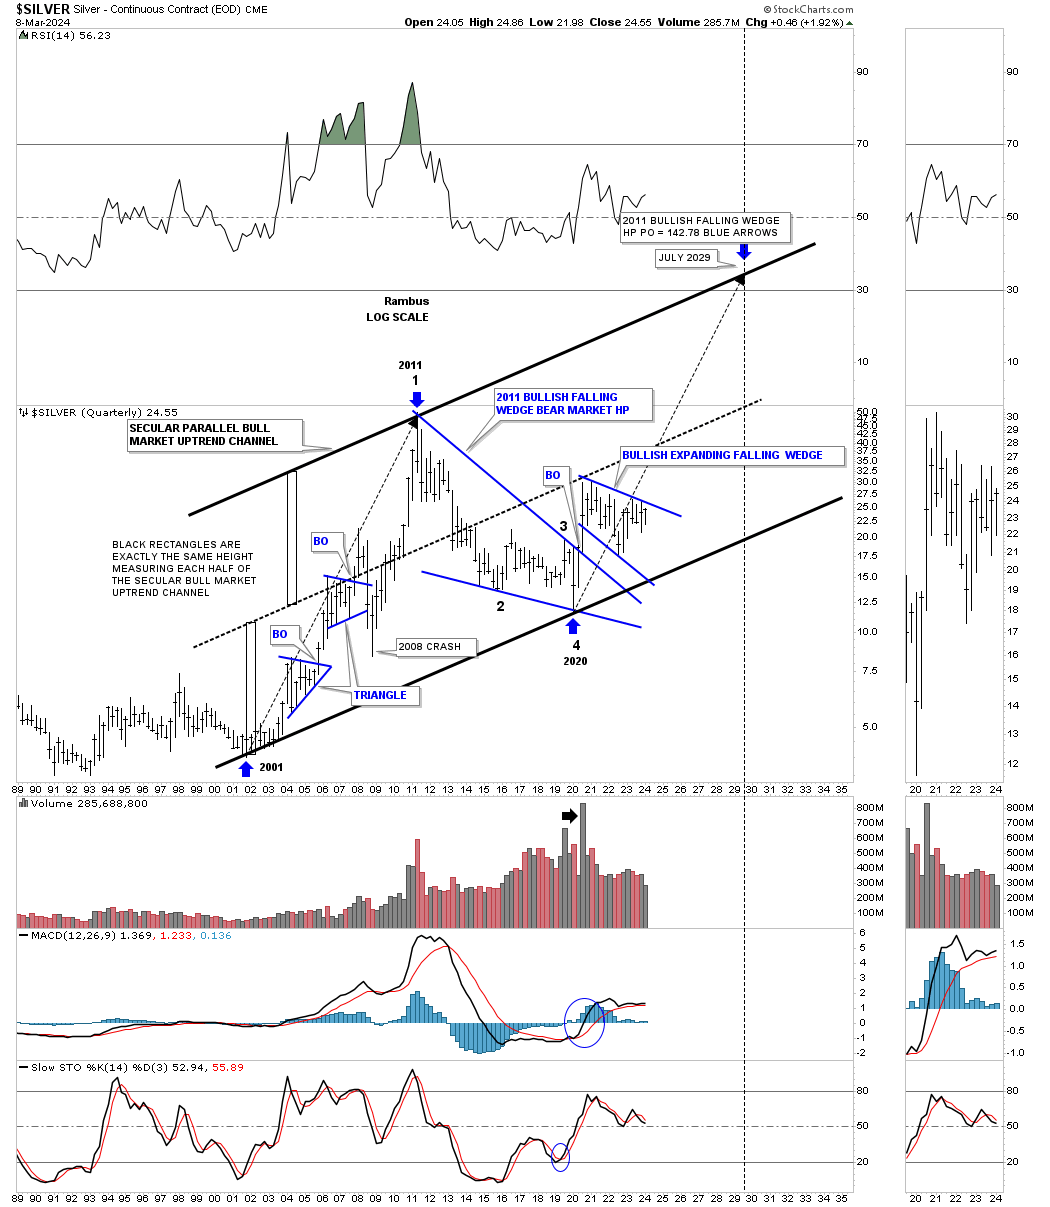
Lets take a quick look at Silver’s secular bull market which began a few years later than Gold’s. Unlike Gold which is trading at all time highs Silver is not even halfway back up to its all time high at 50. Its 2020 trading range shows the blue expanding falling wedge with the top trendline coming into focus once again after several previous touches.
The two long back arrows measure time and price. After topping out in April of 2011 Silver went on to form the 2011 falling wedge which I view will be a halfway pattern to the upside. The fractal nature of the markets suggests that the second leg up, which is now in progress since the last touch of the bottom trendline could be similar in nature to the first leg up into the 2011 all time high. The first big clue the secular bull markets is still alive and well would be to see the 2020 blue expanding falling wedge breakout to the upside.
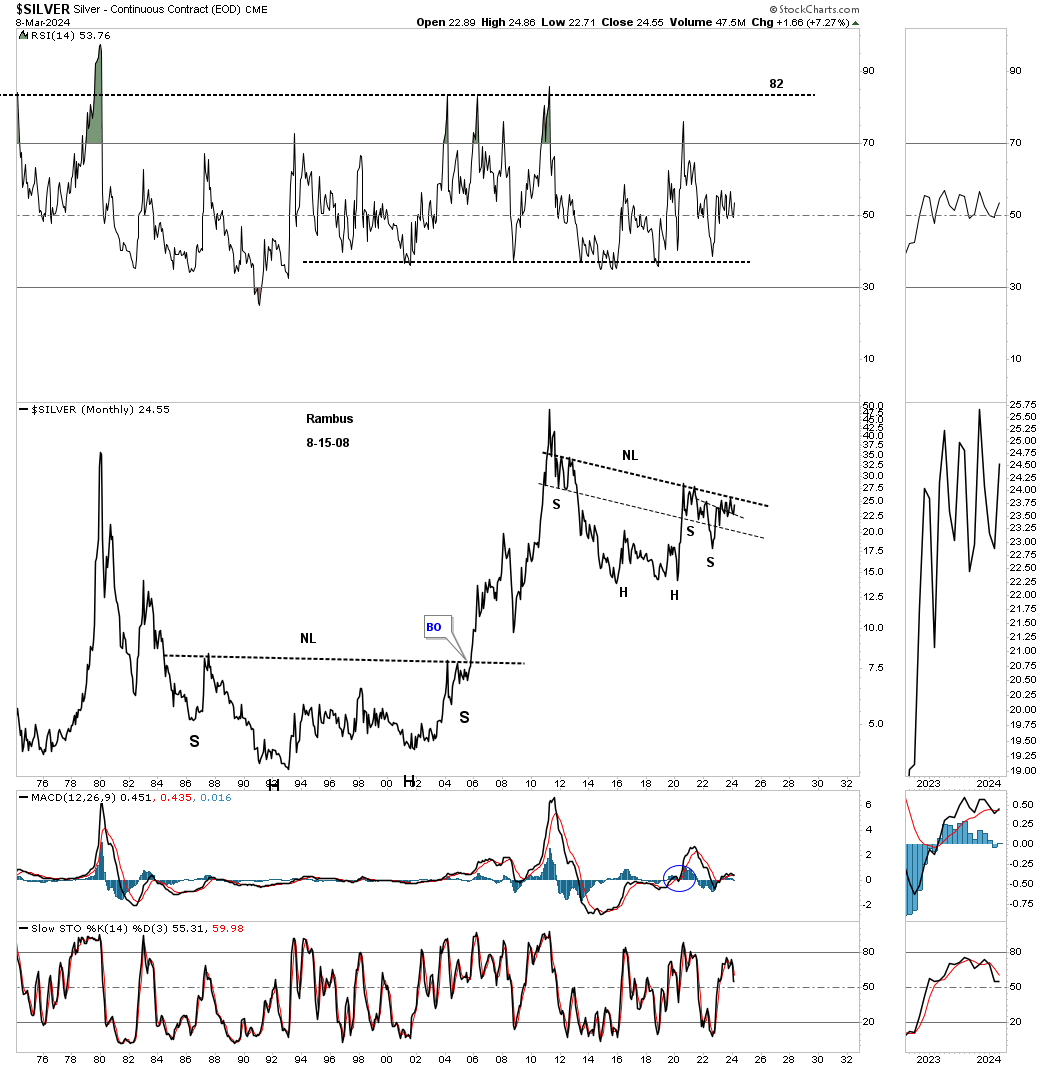
There is another pattern I’ve been following on Silver for several years which is the possible very large H&S consolidation pattern from the monthly line chart perspective. I’ve heard so many times through the years that you can’t trust a long term trading range and they are irrelevant. Note the massive H&S base that formed after the 1980 all time high that took nearly 20 years to complete before the neckline was finally taken out. Gold also formed a very similar 20 year base before its 1980 bear market came to an end in 2000.
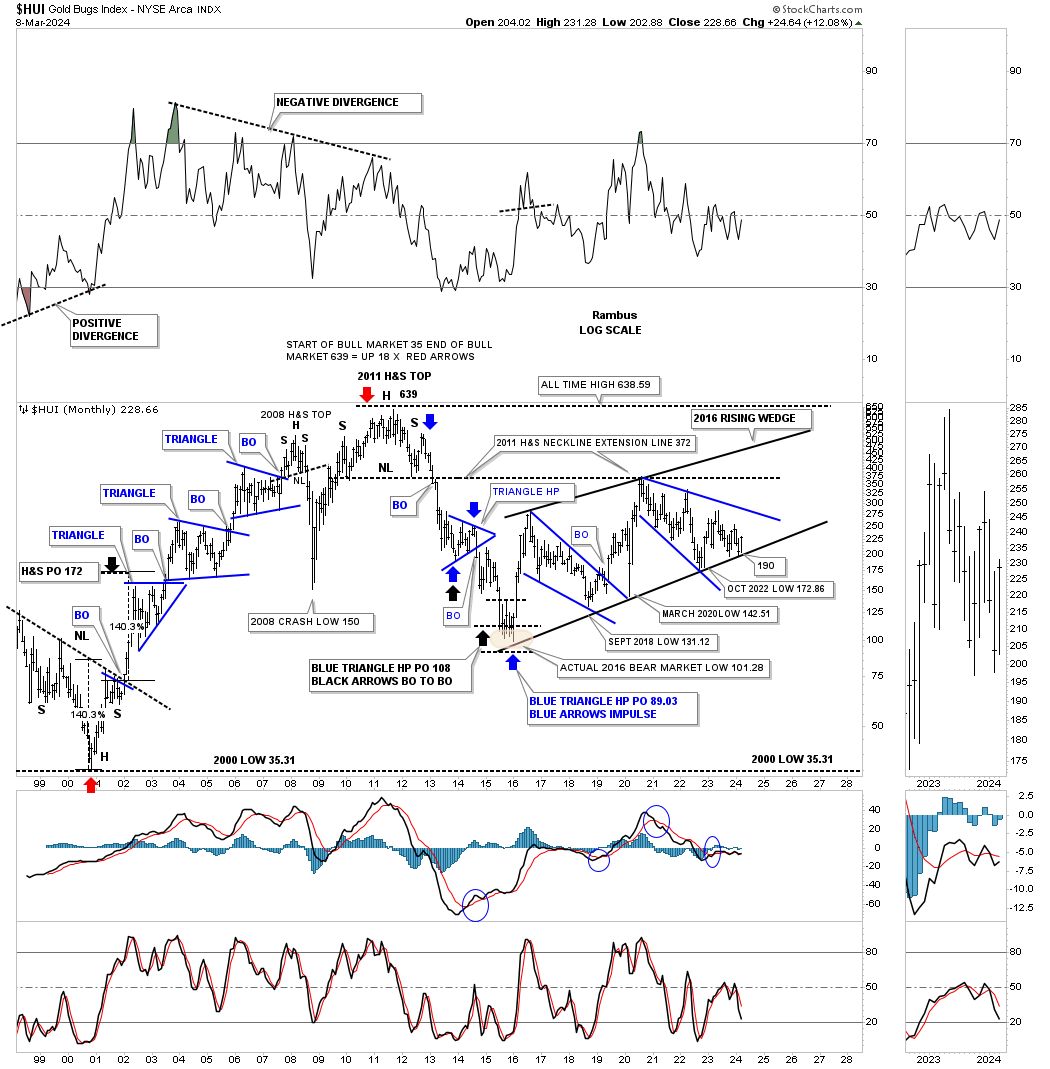
Lets take a quick look at the HUI which shows most of its history going back to the 2000 bear market low and the bull market that followed. Back then was the time to be invested in the PM stocks as one consolidation pattern formed on top of the previous one with a nice impulse move between each consolidation pattern. The HUI’s bull market came to an end when the head of the very symmetrical multi year H&S top formed in 2011.
Note the bottom trendline on the 2016 uptrend channel which has defined the bull market, if you can call it that, up to the present. It is an uptrend channel because the HUI has made higher highs and higher lows. Note that last monthly bar that just touched the bottom rail at the end of February with March showing us a nice rally right where we were hoping to see it.
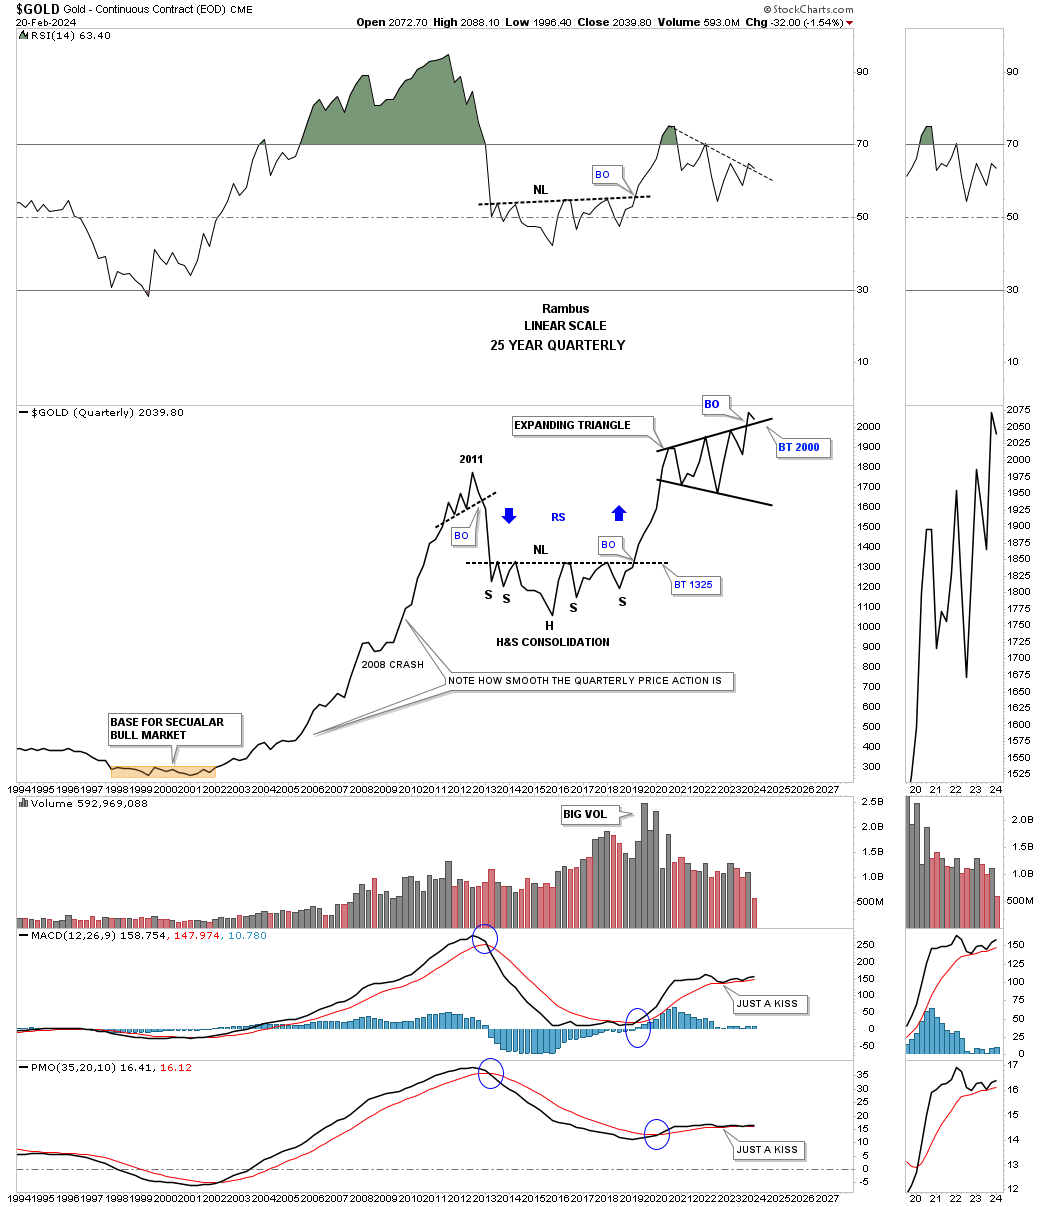
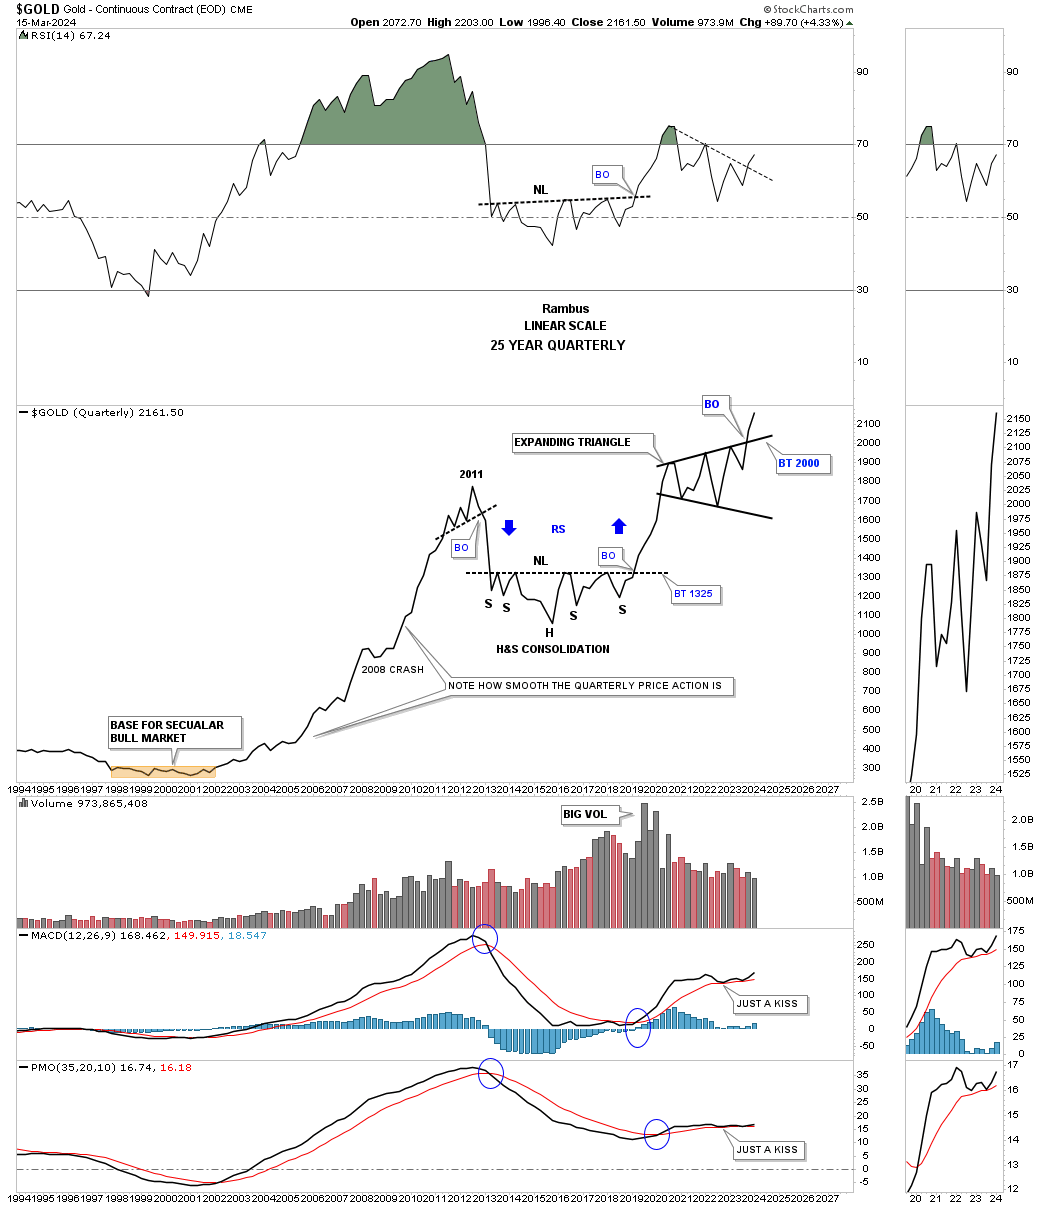
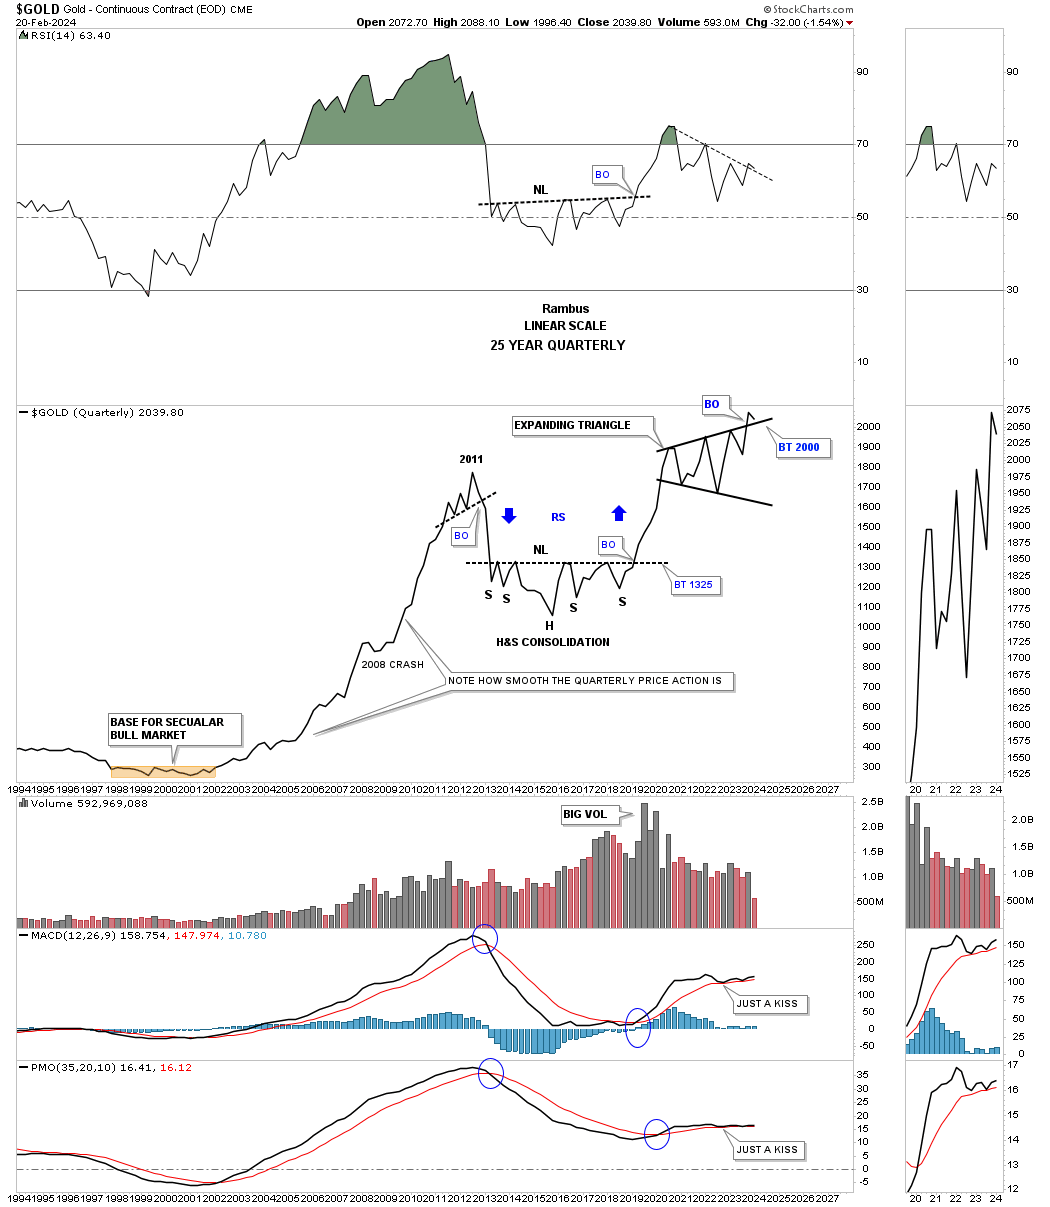
There is a consolidation pattern I’ve been following on Gold which shows up on the quarterly line chart. For several years we’ve watch the price action touch the top tendline from below and fail to breakthrough. Back on February 20th I posted this chart in a Markets Update.
This is what I wrote on February 20th in regards the the 2020 black expanding triangle.
February 20th:
With less that six weeks left of trading for the 1st quarter of 2024 Gold has tested the top rail of the black expanding triangle. A bullish sign would be to see no backtest at the end of March, but a new higher high
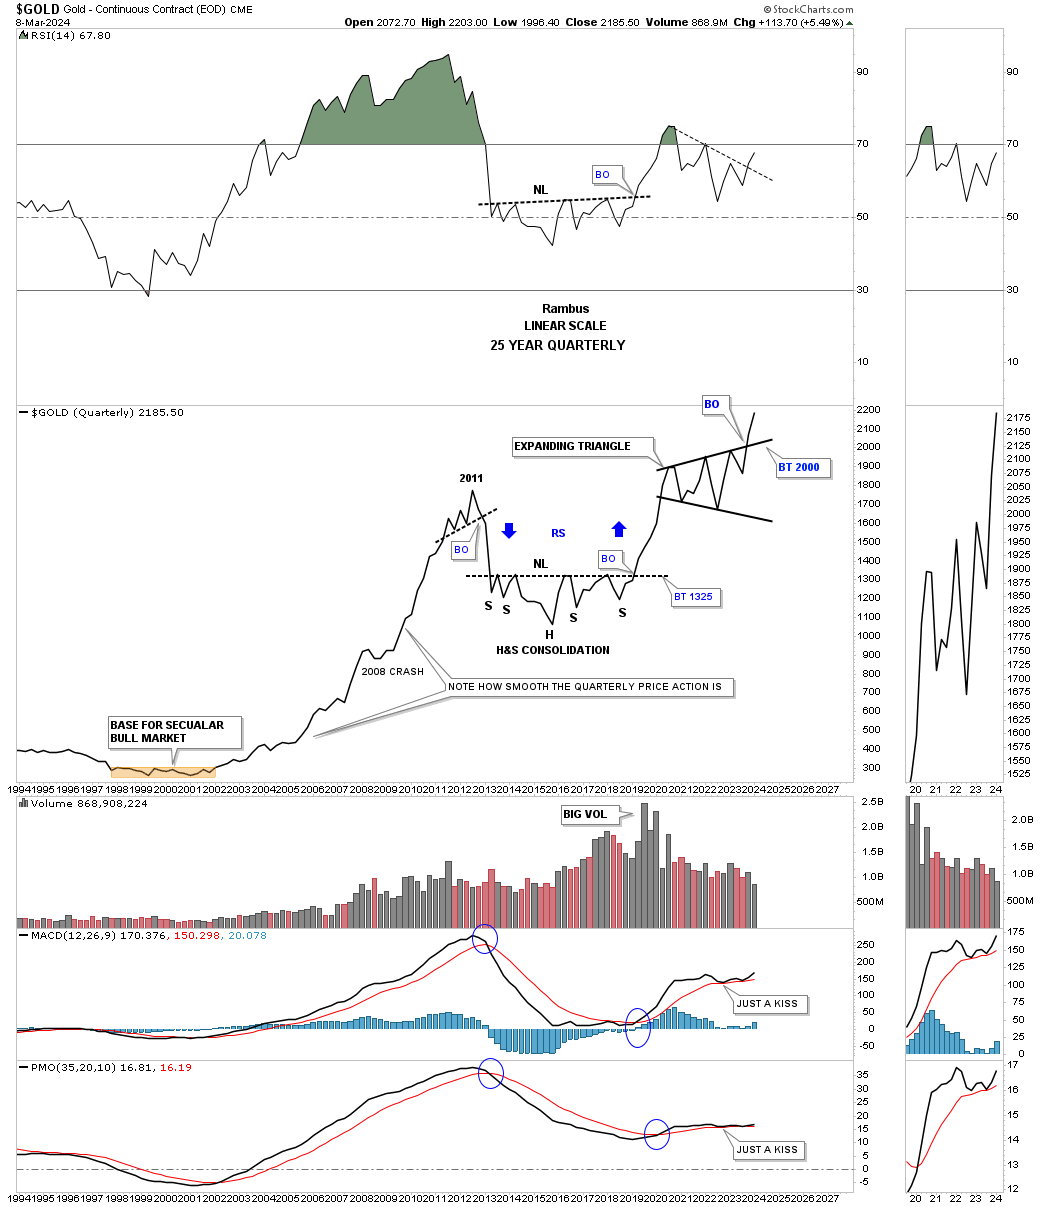
Today March 10th:
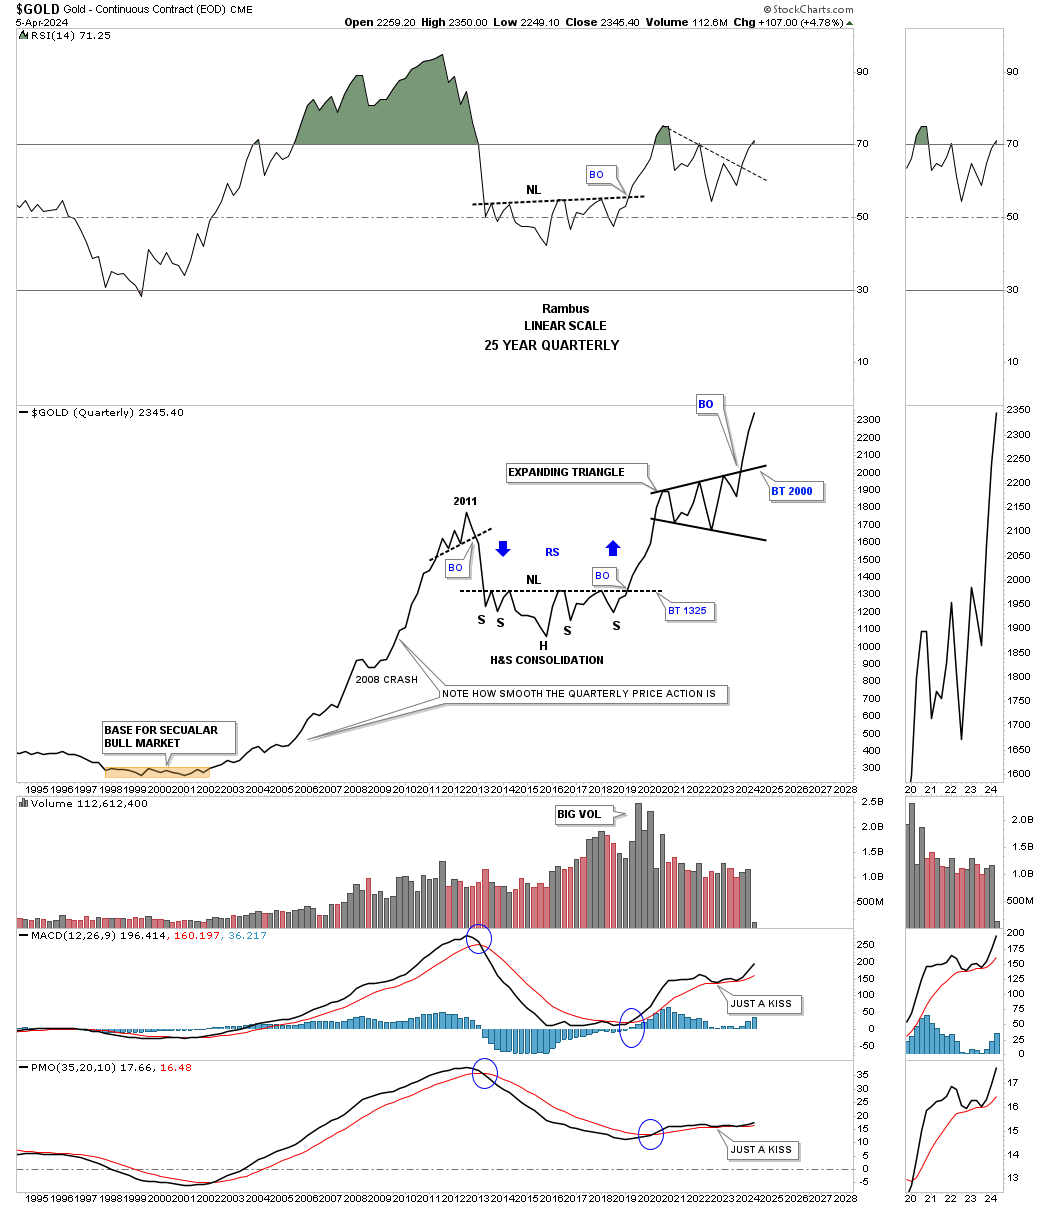
When looking at Gold from the quarterly line chart perspective you don’t see many trading ranges and when you do you know they are important. Compare the exact same chart above to this one below. We still have three weeks of trading for March, but you can now see a higher high with the breakout looking more pronounced.
Also note for the quarterly line chart perspective how the bull and bear declines show almost a straight line. During the entire bull market from 2000 to the 2011 high you can see just a couple of modest one quarter declines with the biggest one being the 2008 crash low. Note how the reverse symmetry looked over the same area on the way down from the 2011 high to the first reversal point in the black expanding triangle as shown by the blue arrows.
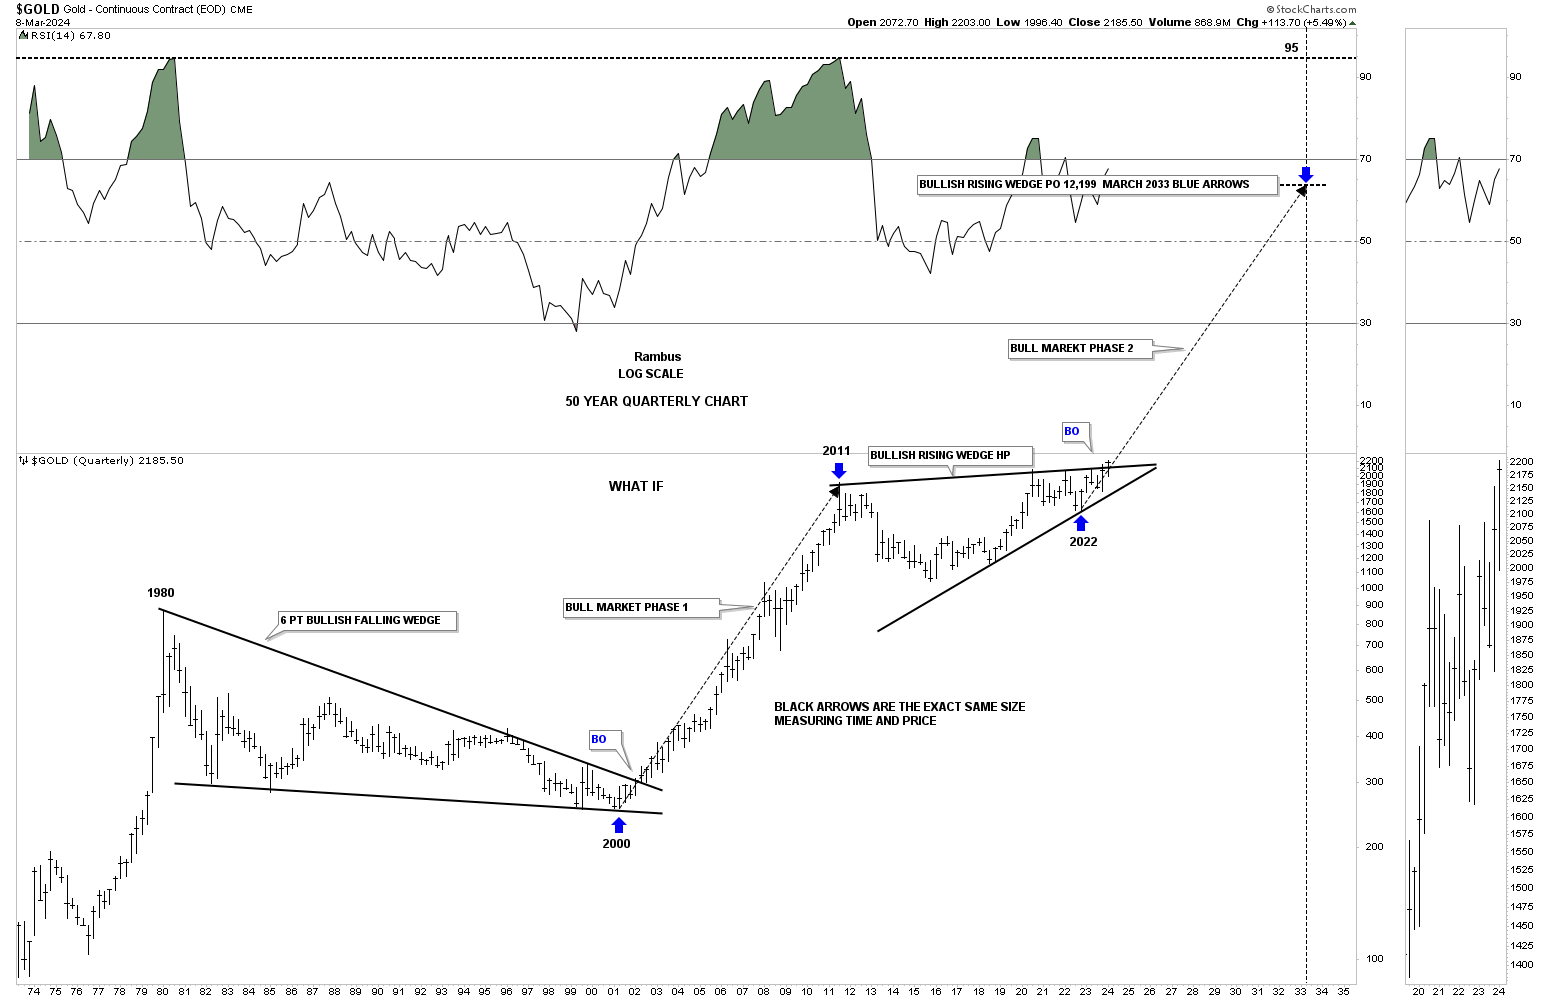
We’ve looked at some long term charts tonight so lets look at one more I have been following for some time, but was waiting for the right time to post it. Through the years we’ve heard analyst calling for 10,000 gold or 20,000 gold which I thought were crazy price objectives.
If you go back up to where I posted the Gold:USD ratio which shows the 2011 triangle consolidation pattern that is the chart I got the idea for this possible scenario below which I know will sound ludicrous.
If we start at the 1980 all time high to the 20 year bear market low in 2000 you can see a nearly perfect 6 point bullish falling wedge. How do we know it is a 6 point bullish falling wedge, just look at the eleven year bull market that followed the breakout.
Just about every Gold analyst knows about the 2020 trading range with each giving the consolidation pattern their own name. I took it a step further and connected the 2011 high to the 2020 high to get the top trendline and then the two lows for the bottom trendline which shows a bullish rising wedge with the breakout taking place this month. Again, markets are fractal in nature so if the 2000 to 2011 bull market is one massive impulse move and the 2011 bullish rising wedge is the halfway pattern we can measure the price objective that I like to use as shown by the blue arrows.
I’m not saying this is absolutely going to play out, but it is something that I can now watch to see how the second leg of the secular bull market tracks the first leg up into the 2011 high.
From a Chartology perspective I’m strongly suggesting that the next impulse move higher is now underway where there will be consolidation patterns that form along the way but they will be buying opportunities. As they say, we’ll know in the fullness of time. All the best…Rambus
Commodities & Inflation
During the pandemic just about everything crashed and burned going into the 2020 crash low and I mean just about everything. Commodities were no exception. If you recall oil went negative for a brief period of time which seems incomprehensible now. That 2020 low also marked the beginning of inflation that had been pretty dormant for so many years.
For the next two years inflation came roaring back based more on shortages than anything else at that time. Most commodities rallied in a near vertical move which was the initial thrust of a possible much longer environment for inflation that will be punctuated with some pockets of weakness.
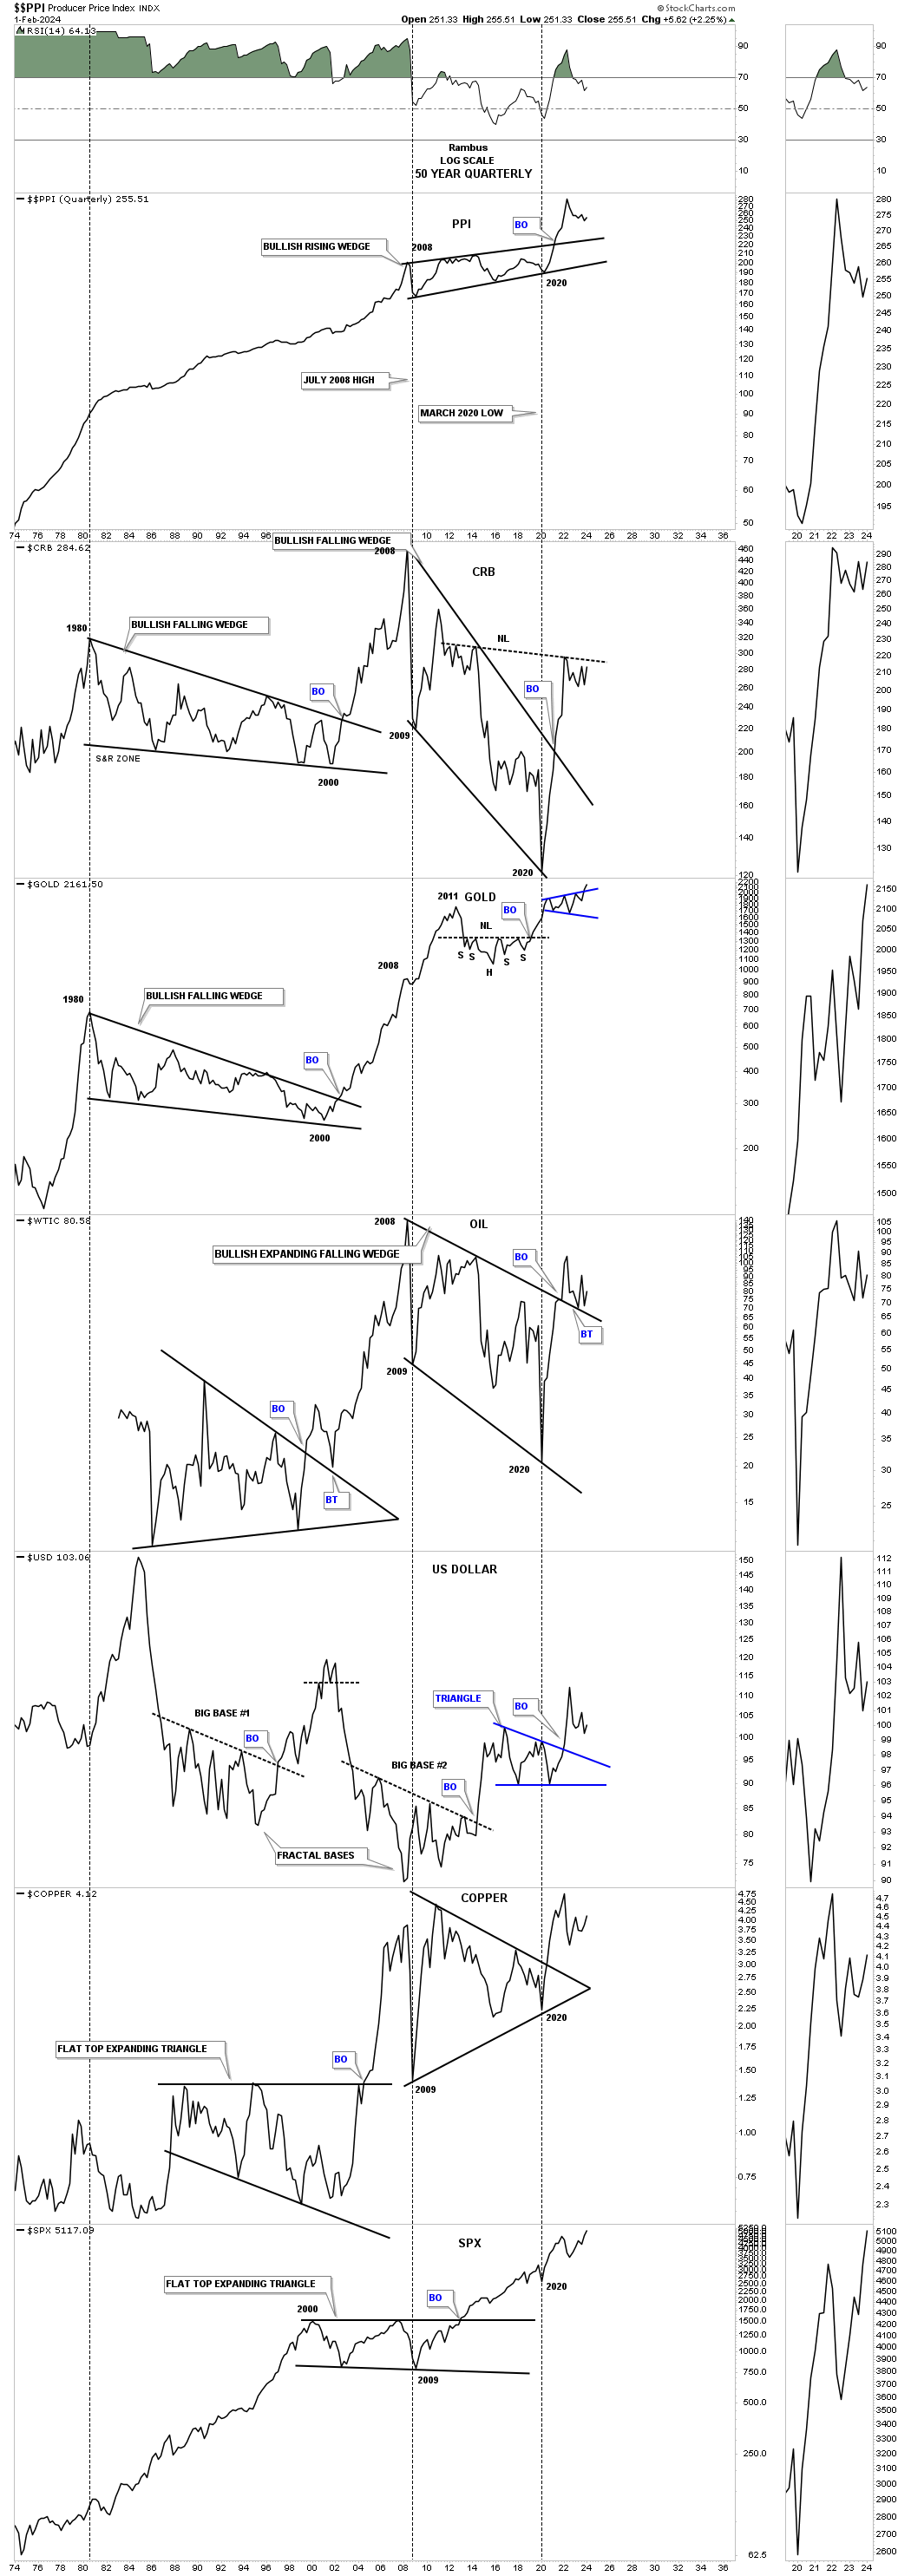
Below is a long term quarterly line chart which has the PPI, Producer Price Index, on top with some commodity related indexes below. You don’t have to be a genius to know that the PPI has been rising steadily for the last 50 years when you compare what a house or car cost back in 1974 on a relative basis to the present. Its been just a fact of life.
The PPI bottomed in the spring of 2020 like just about everything else and marked the 4th reversal point in a very large bullish rising wedge. Again, like many commodities when the two year rally finally came to an end the PPI has been slowing declining showing inflation cooling off a bit.
Below the PPI is the CRB index which has broken out from the massive bullish falling wedge and is forming a possible H&S bottom. Gold has broken out from its blue expanding triangle and actually held up better than most. WTIC could be in backtest mode while Copper has been trading sideways. The SPX on the very bottom held up the best and has made new all time highs. What is interesting is that the USD also bottomed later in 2020 and has been rising with everything else for the most part.
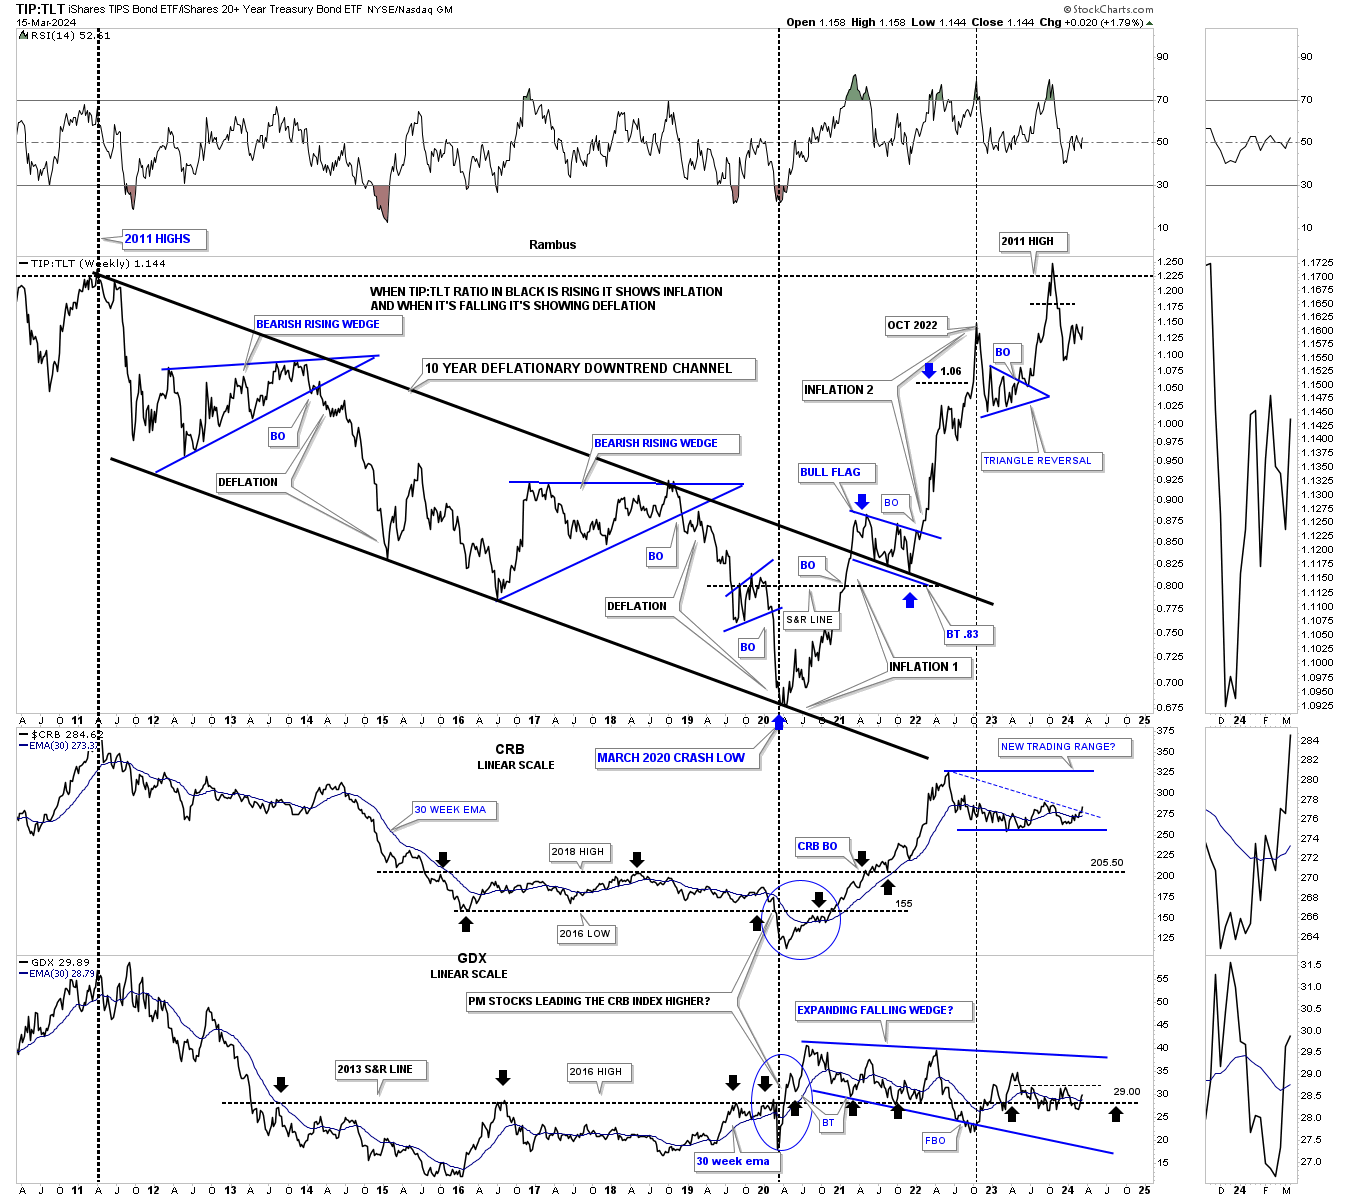
Next is the ratio combo chart which has the TIP:TLT ratio chart on top which I use to help me gauge whether we are in an inflationary or deflationary environment. Below the ratio chart is the CRB and the GDX. As you can see from the 2011 high when the ratio on top, CRB index and GDX topped out, the ratio chart formed a parallel downtrend channel to the 2020 low which was pretty much a deflationary period. That all changed at the 2020 crash low where inflation began to take hold in a big way in three separate bouts which finally halted at the old 2011 high. Since then it has slowly been declining most likely carving out some type of trading range.
The old adage that Gold often leads commodities higher first, and then commodities will follow, held true initially at the 2020 low. You can see the ratio chart, the CRB, and the GDX all bottomed in 2020. The ratio and the CRB rocketed to the upside, but the GDX, after a decent bounce, failed to follow suit and began forming its long drawn out 2020 expanding falling wedge.
When looking at the overall view this ratio combo chart appears somewhat neutral at the moment. You have the ratio on top beginning to move sideways below its recent high while the CRB is finding support at its previous low along with the GDX at its 2013 S&R line, black arrows. If the CRB index is building a much bigger sideways trading range it’s suggesting a possible rally could take place toward the top blue trendline in the intermediate term.
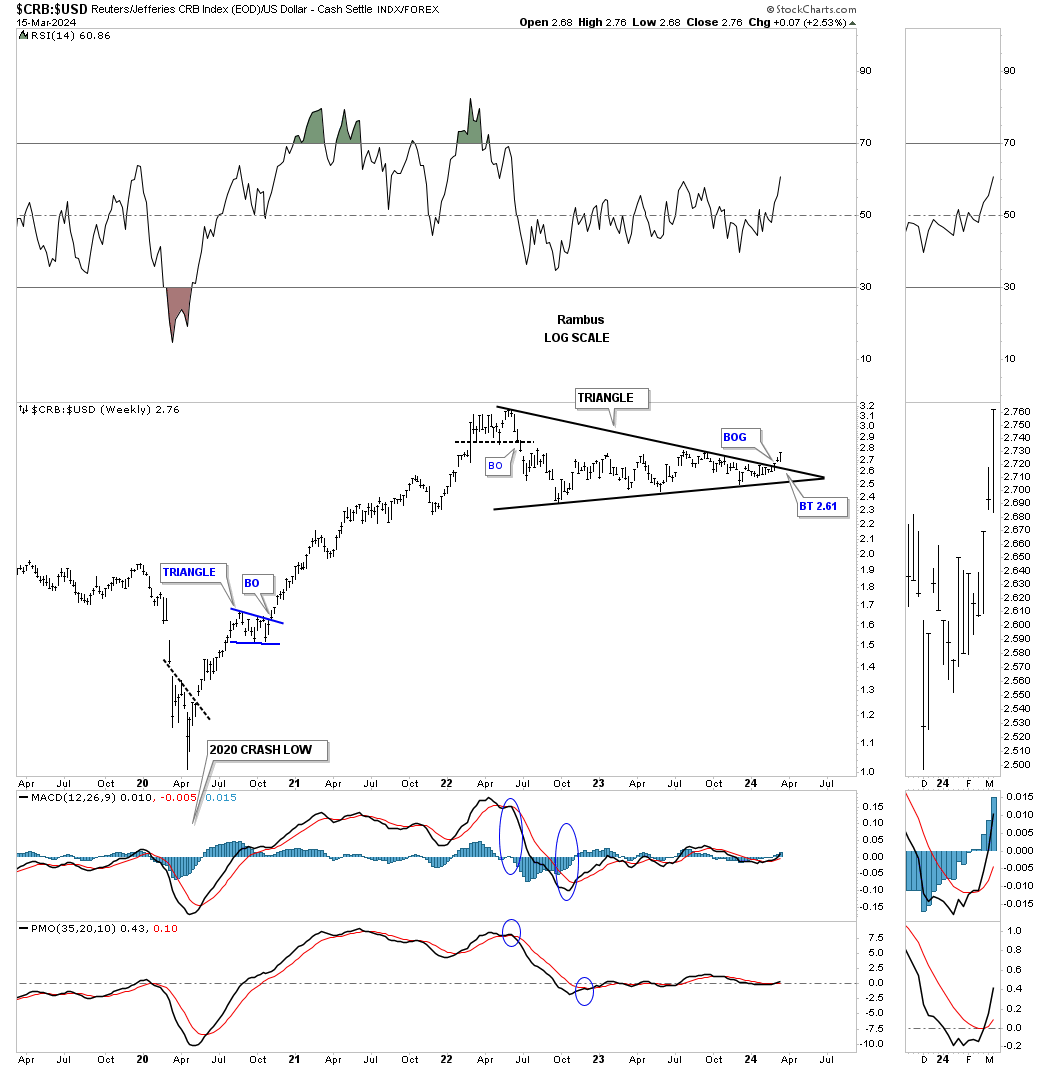
If the CRB index is going to move higher in the intermediate to the longer term then it will need to outperform the US dollar. Two weeks ago the CRB:USD ratio formed a breakout gap above the top rail of the 2022 triangle.
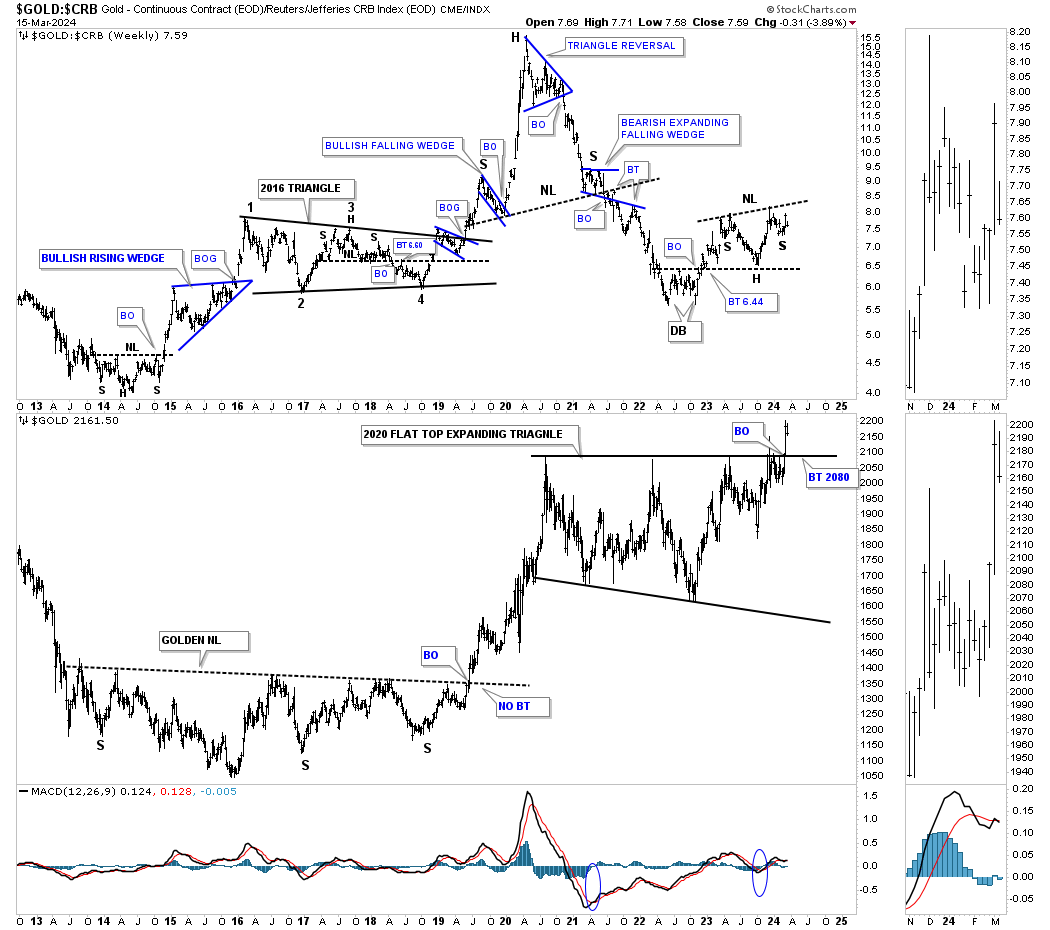
This next ratio combo chart below has the Gold:CRB on top with Gold on the bottom. Both the ratio chart on top and Gold on the bottom can move higher together, but the rising ratio is showing Gold is outperforming the CRB index which in tern is suggesting a possible bout of inflation could be in the cards with Gold leading the CRB index as was suggested in the TIP:TLT ratio chart above.
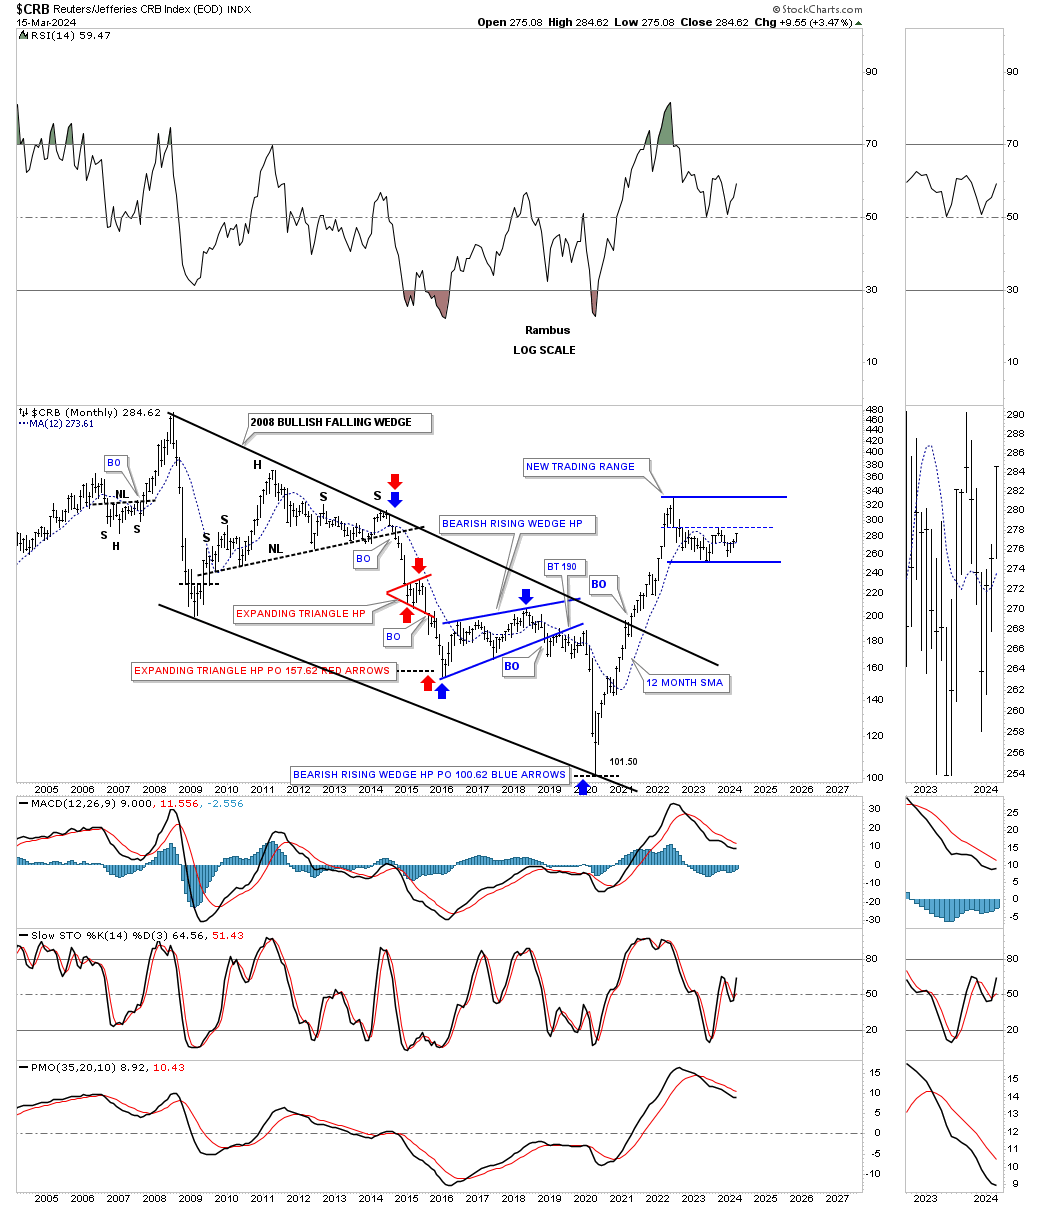
The reason I’m being a little cautious on an outright massive inflationary spiral to the upside, at this point in time, is that after the two year near vertical rally in the CRB and other commodities a consolidation period should be expected. What this monthly chart below shows is a possible new trading range under construction. So yes we could now see some inflation coming into the picture as the CRB completes its next reversal point to the upside somewhere toward the top blue trendline, but then see it cool down once again as the next reversal point to the downside begins to take shape. Keep in mind we have to have a minimum of four reversal points to create a consolidation pattern and it is always the 3rd and 4th reversal points that so many get wrong.
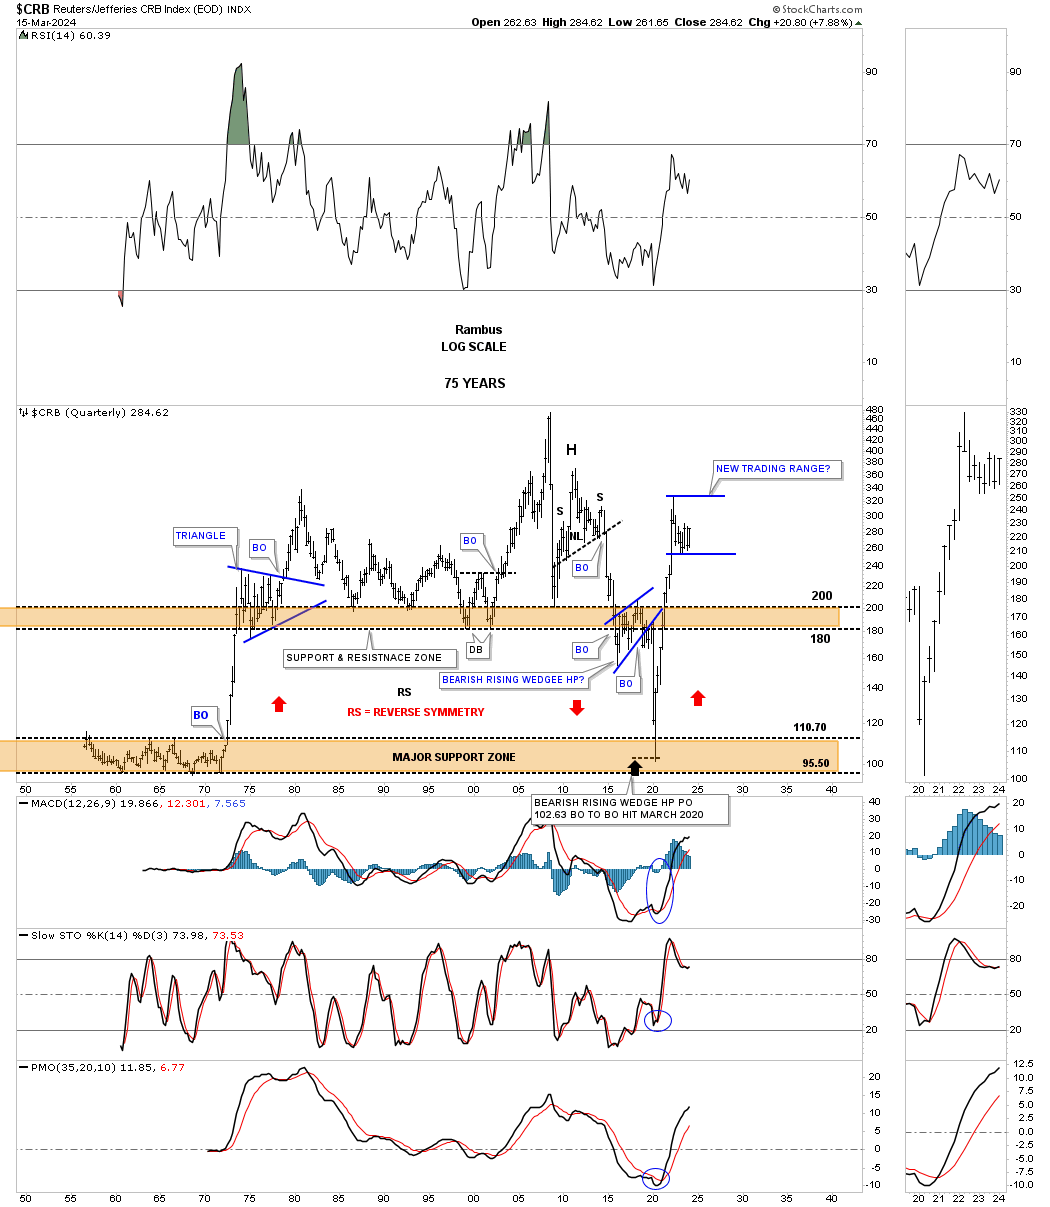
From the quarterly chart perspective you can see the 2020 crash low and the vertical rally that ensued. Note the blue triangle that formed back in the 1970’s after that vertical rally.
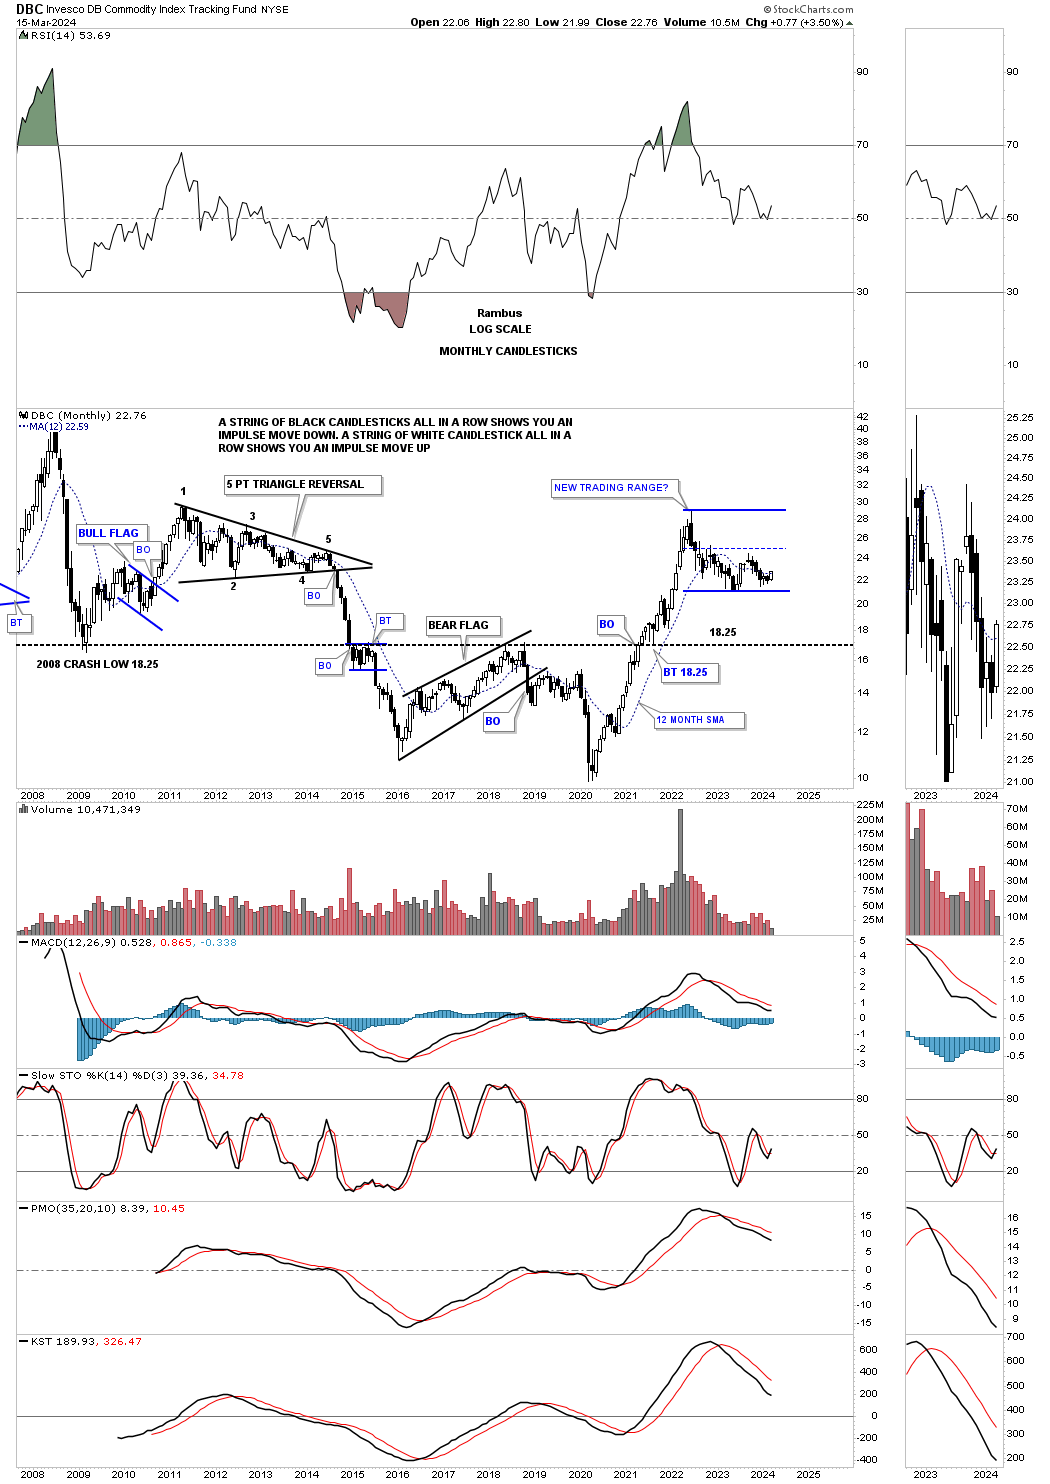
Below is the DBC commodity index which is more widely followed for the most part showing a similar new trading range. Note all the white candlesticks all in a row during the 2020 rally. Then note all the black candlesticks all in a row during major declines.
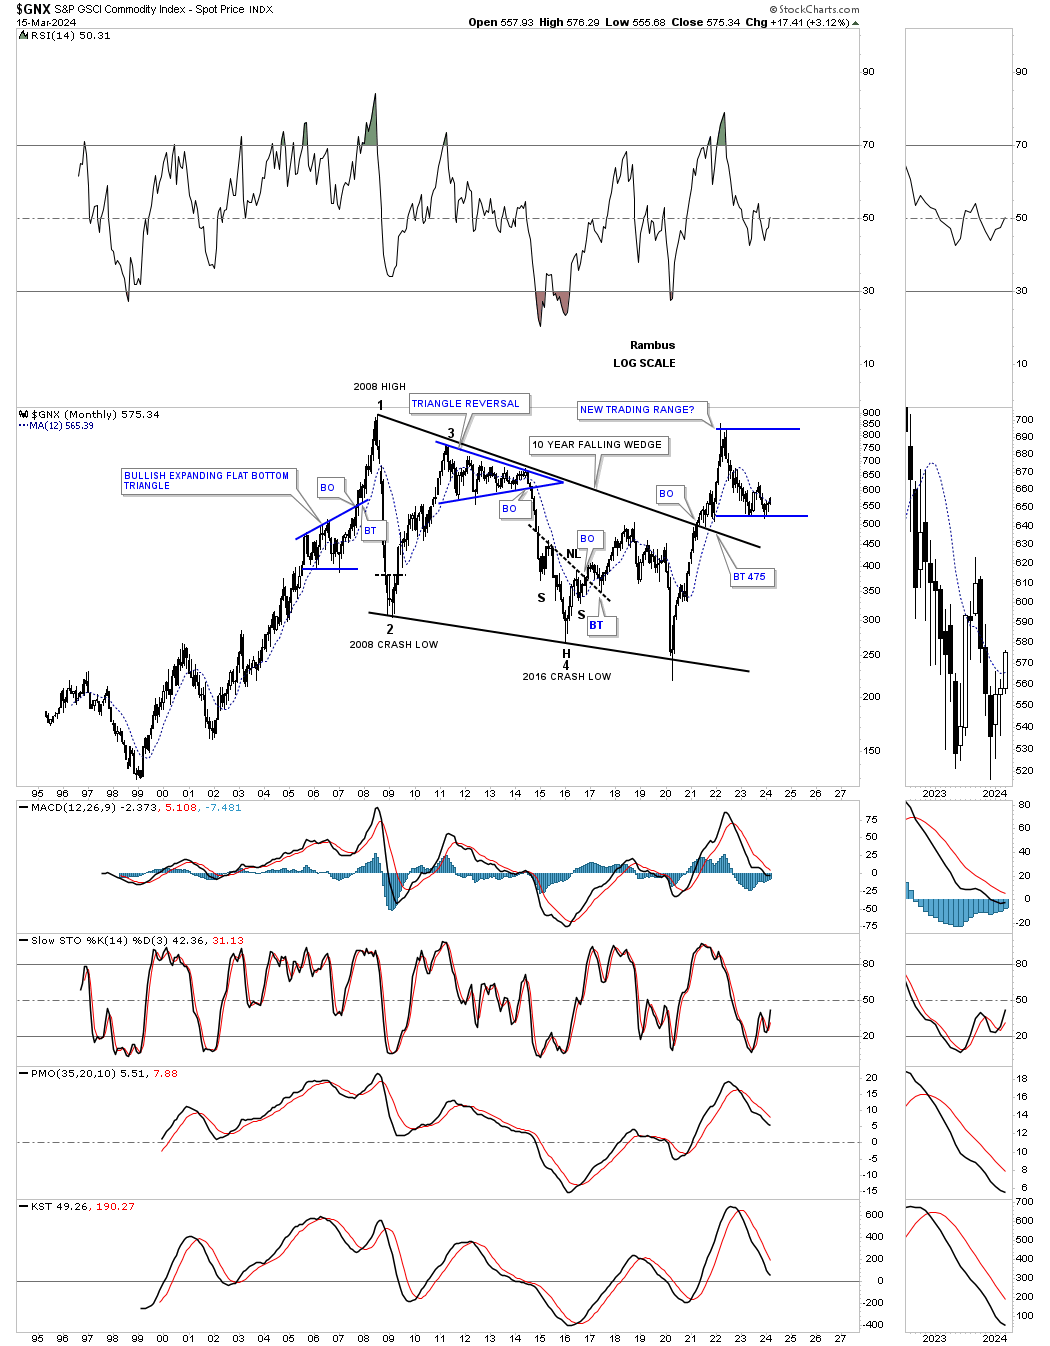
The GNX is another commodity index which broke out from its large bullish falling wedge and has been trading sideways since the 2020 inflationary spike.
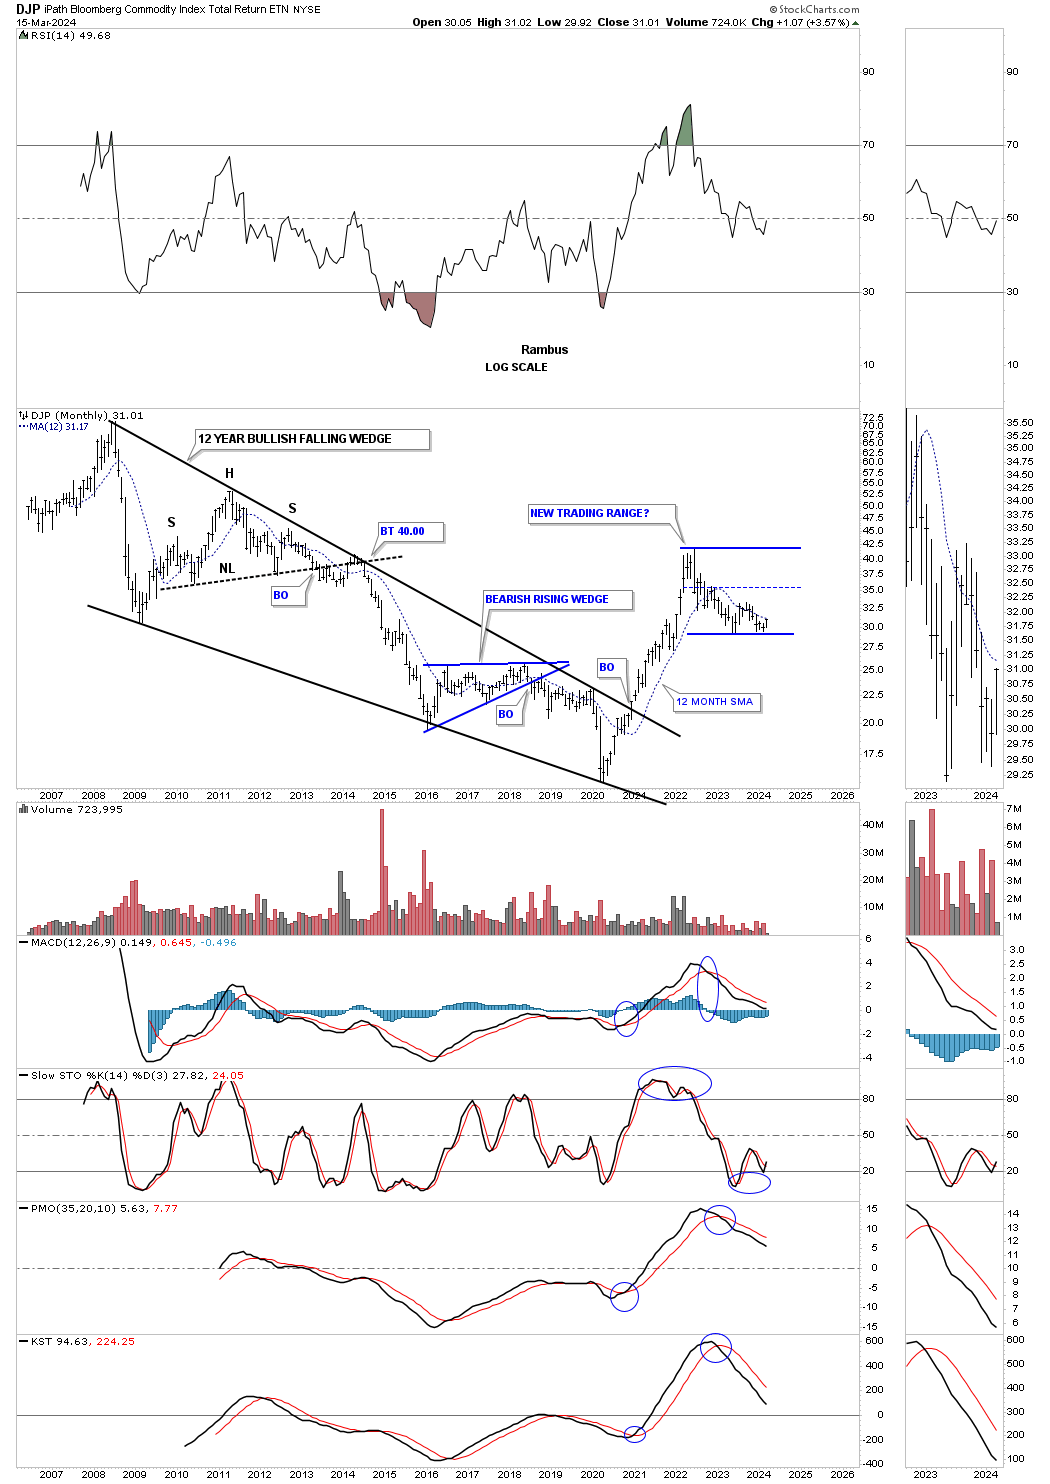
The DJP also broke out from a very large bullish falling wedge and is also trading sideways. Keep in mind though that the bullish falling wedge has been broken to the upside and is strongly suggesting that inflation will be something too reckon with once we see how the new blue trading range plays out.
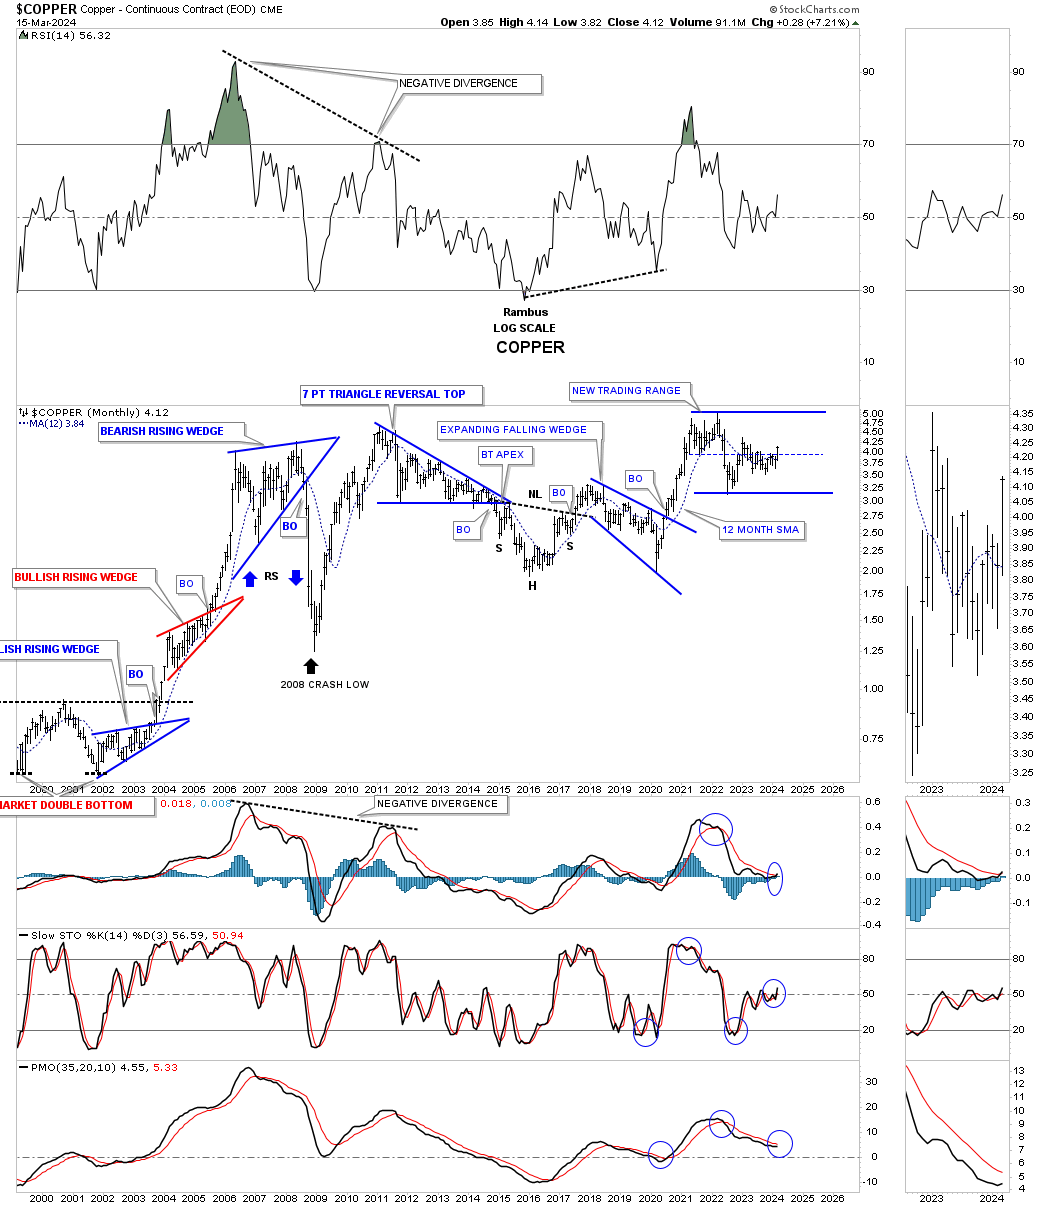
Copper is showing a very similar trading range to the other commodity indexes above, but it is forming at the all time highs. So whatever consolidation pattern finally shows its self Copper will trade into new all time high territory when the time is right.
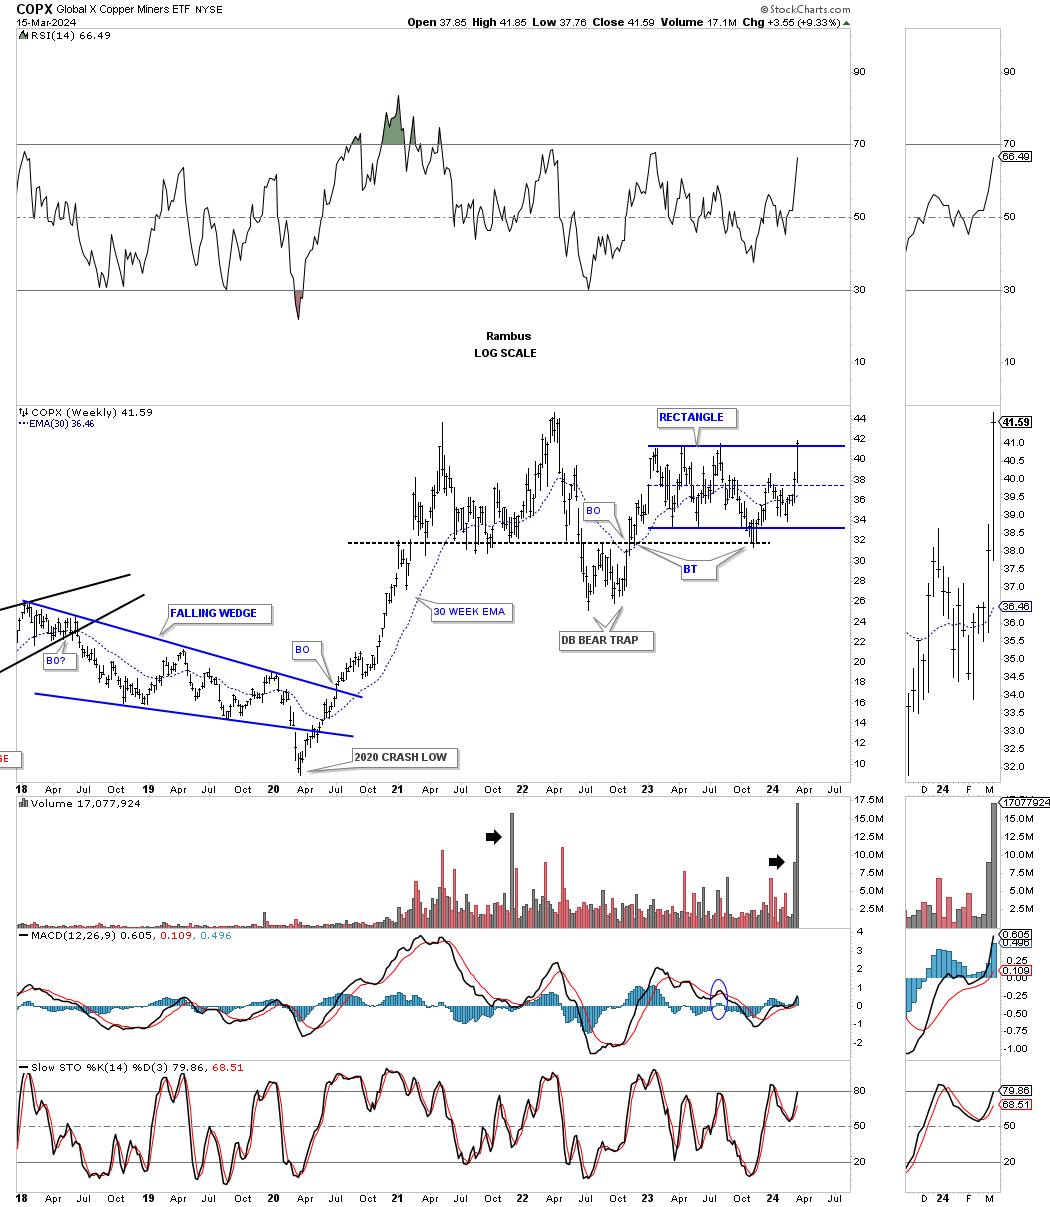
The COPX, Copper miners etf, has now completed the 6th reversal point in its blue rectangle which unlike Copper could breakout into new all time highs while Copper, the metal, moves up to the top rail of its blue trading range.
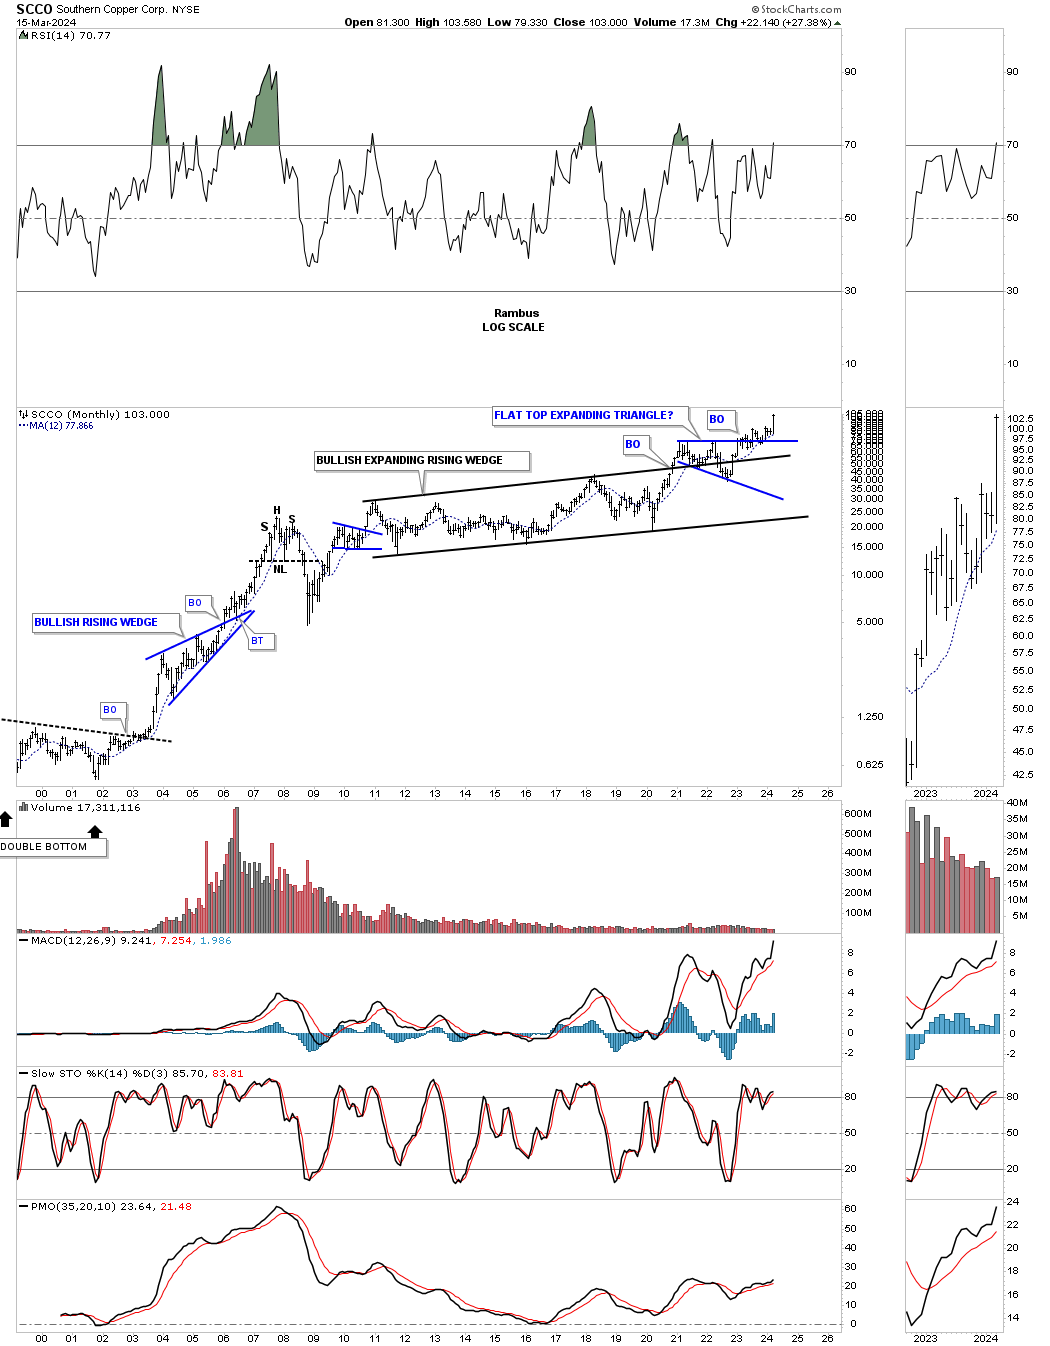
The SCCO is breaking out into new all time highs as it has always been the leader.
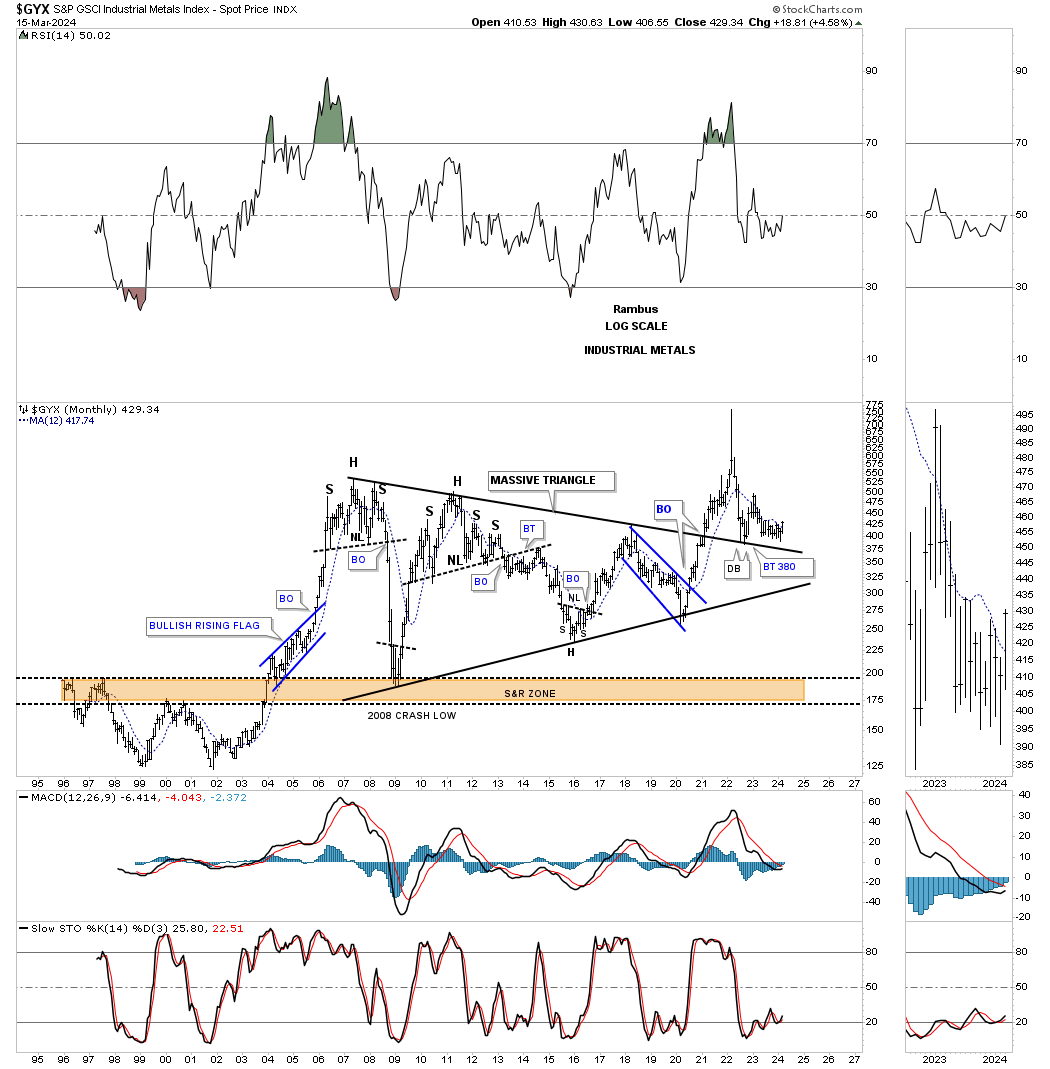
The GYX, industrial metals, broke out from a very large triangle during the 2020 rally, but after the parabolic rise it had to come back down to earth and has been in backtest mode.
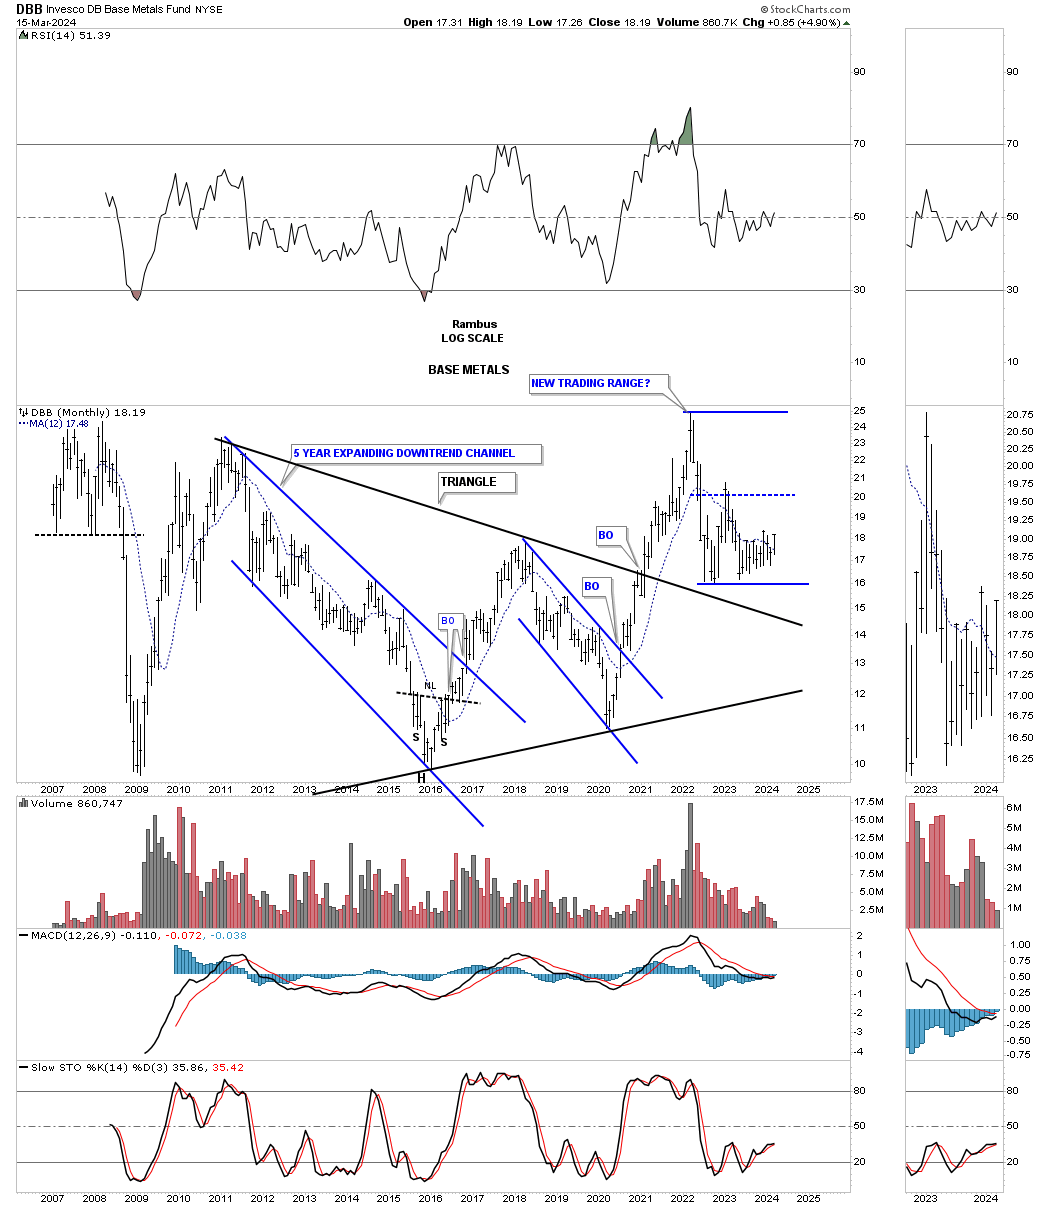
The DBB, Base metals fund, looks a lot like the commodities indexes we looked at above.
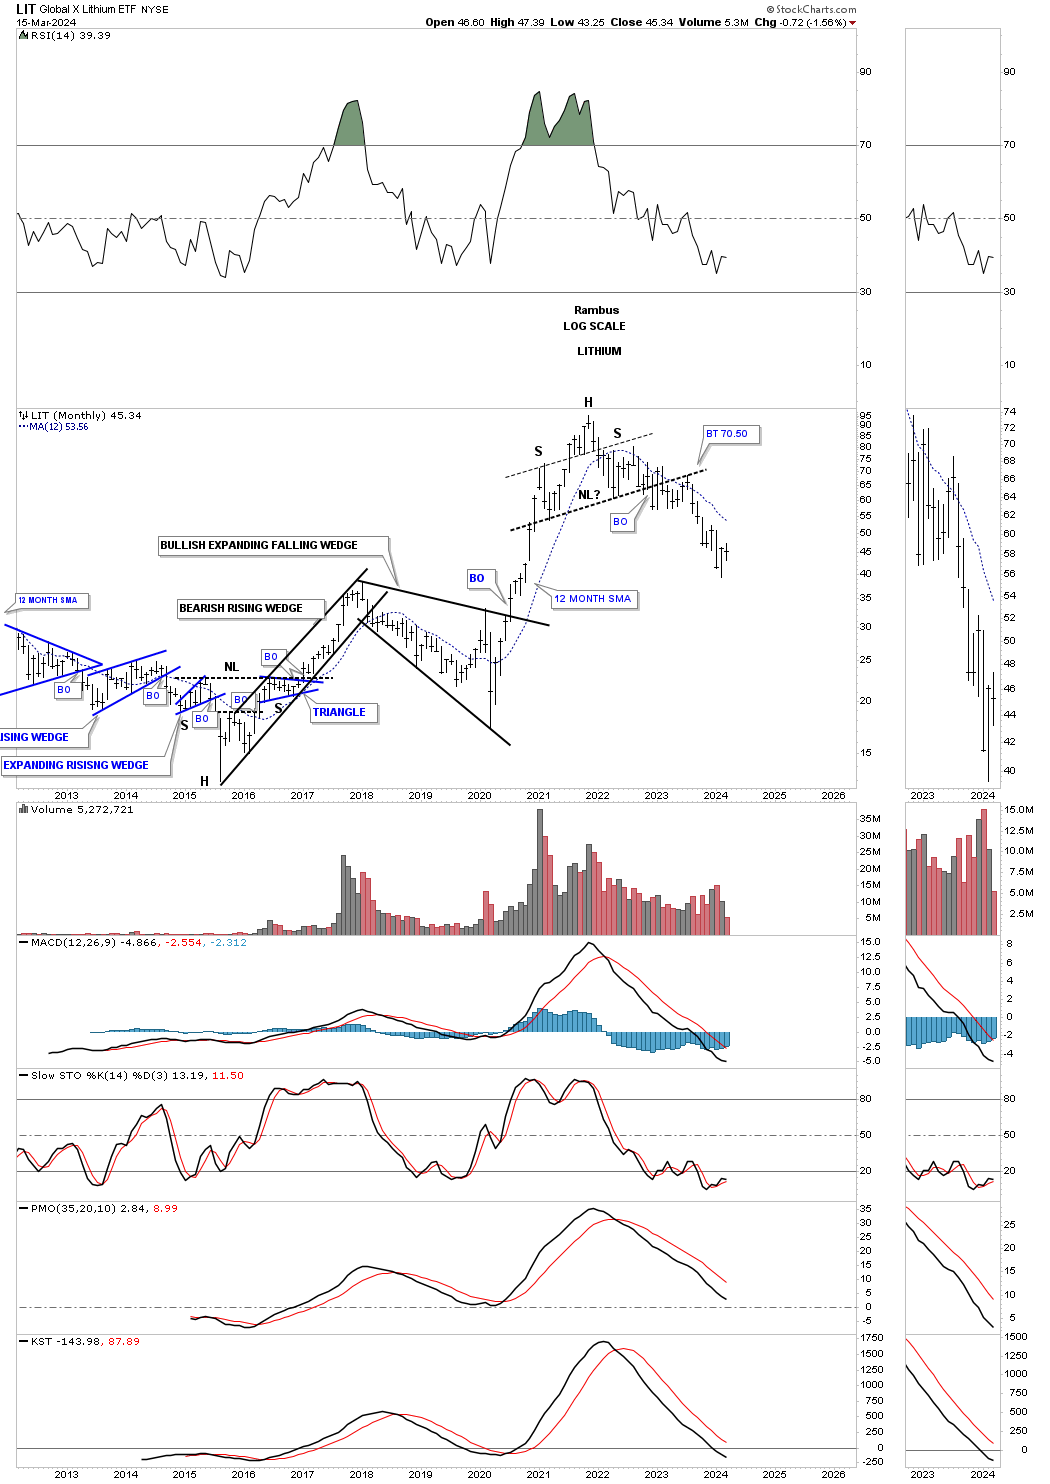
The LIT, Lithium etf, had a massive rally out of the 2020 low, but then formed the H&S top.
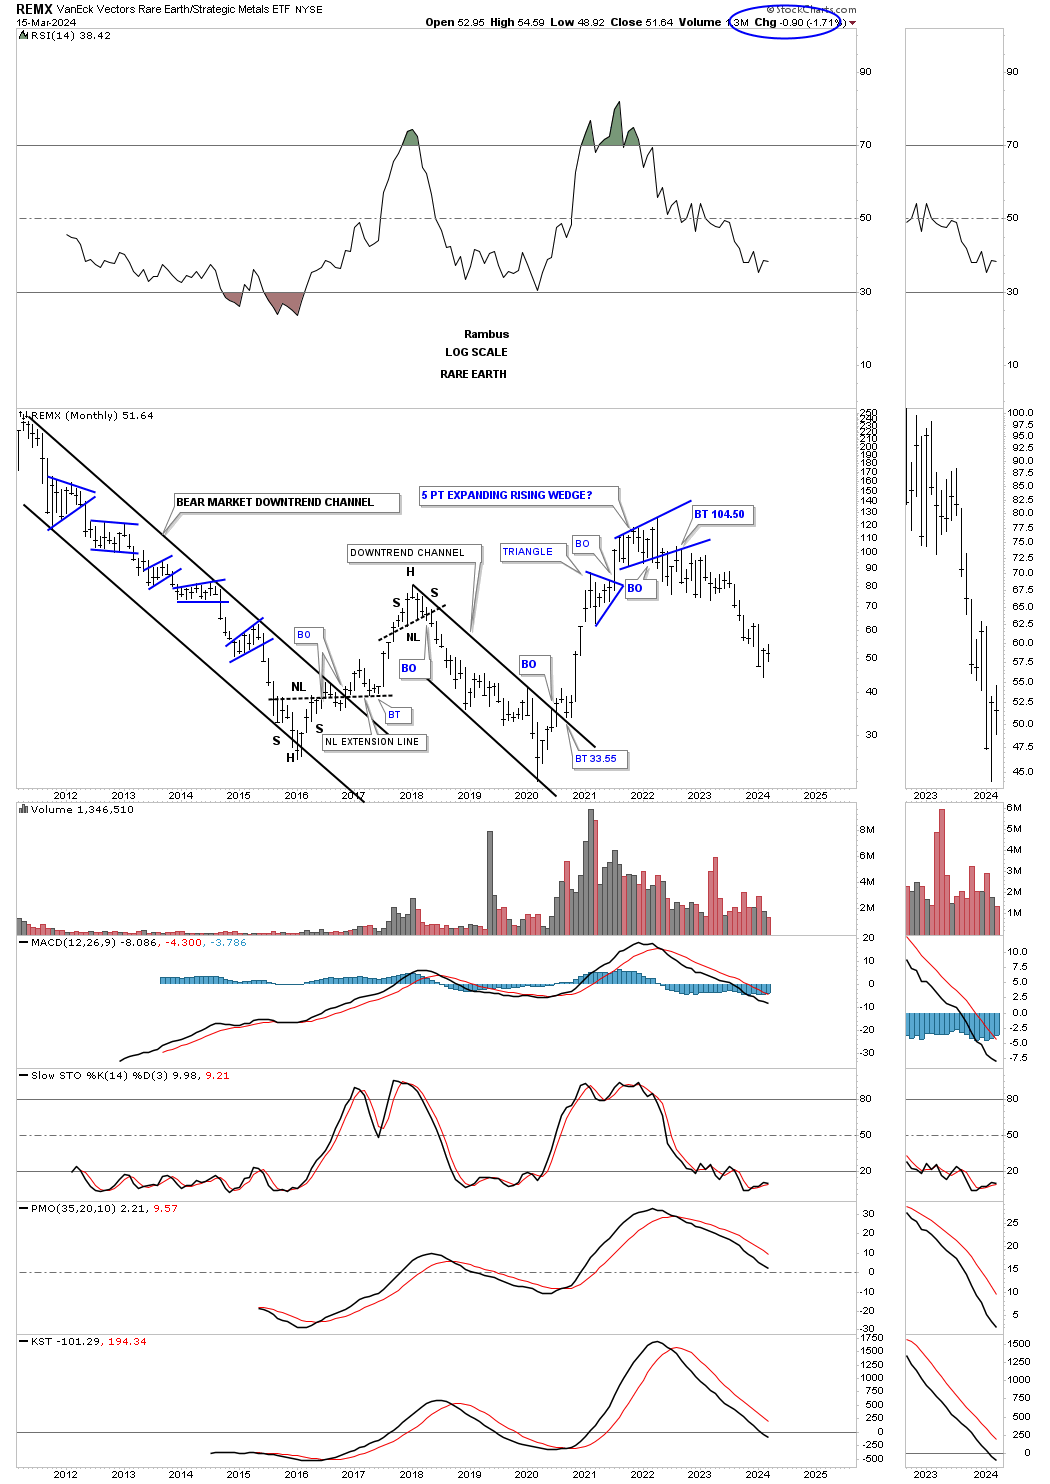
REMX, Rare Earth etf, also shows a massive rally out of its 2020 low and reversed back down after forming the blue 5 point bearish expanding rising wedge reversal pattern.
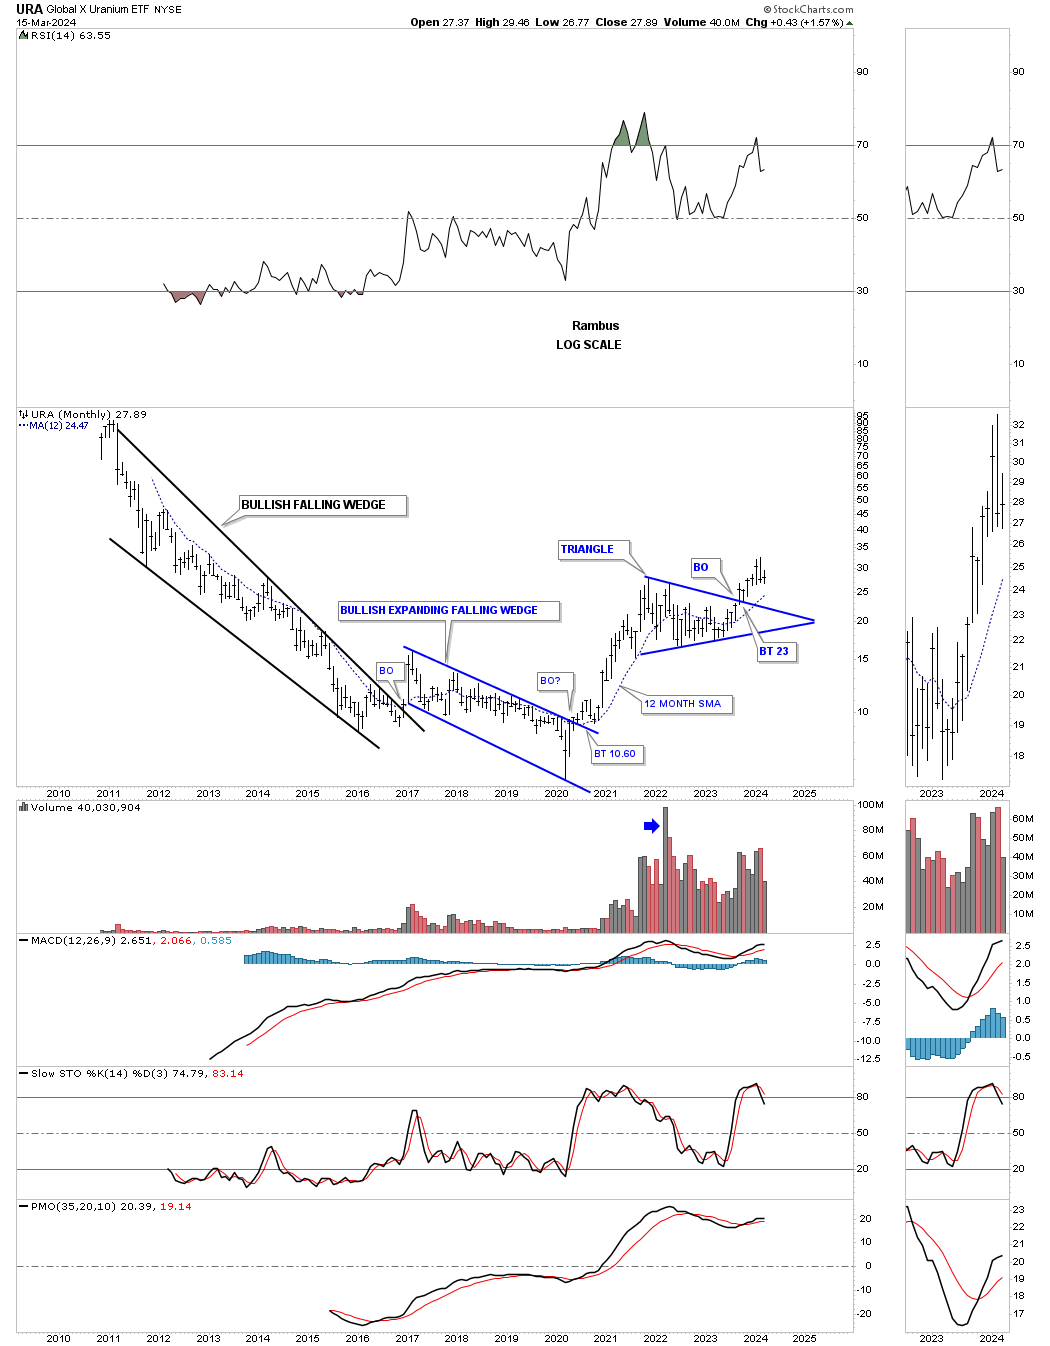
URA, Uranium etf, built the blue triangle after its 2020 rally, but needs to start moving higher in order to negate the possible negative divergence on the RSI at the top of the chart. Support should come in around the 30 week ema.
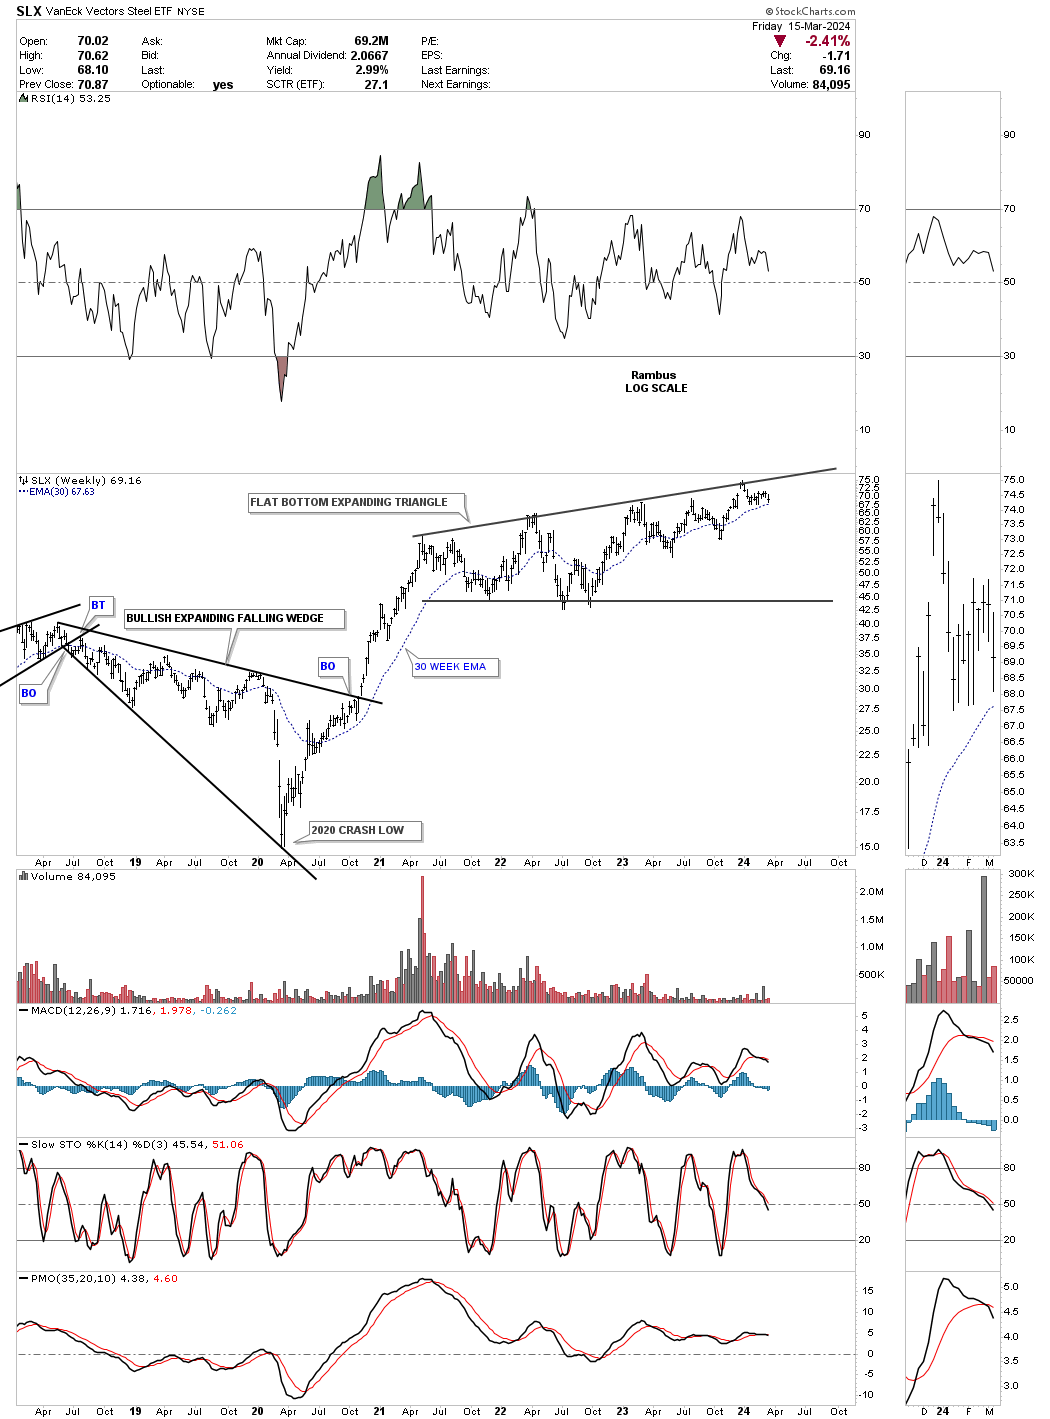
SLX, Steel etf, had a massive rally out of its 2020 low and has been trading sideways forming a flat bottom expanding triangle. Whichever direction the breakout occurs a good move should follow. Since the pattern is forming in the uptrend the breakout should be to the upside when all is said and done.
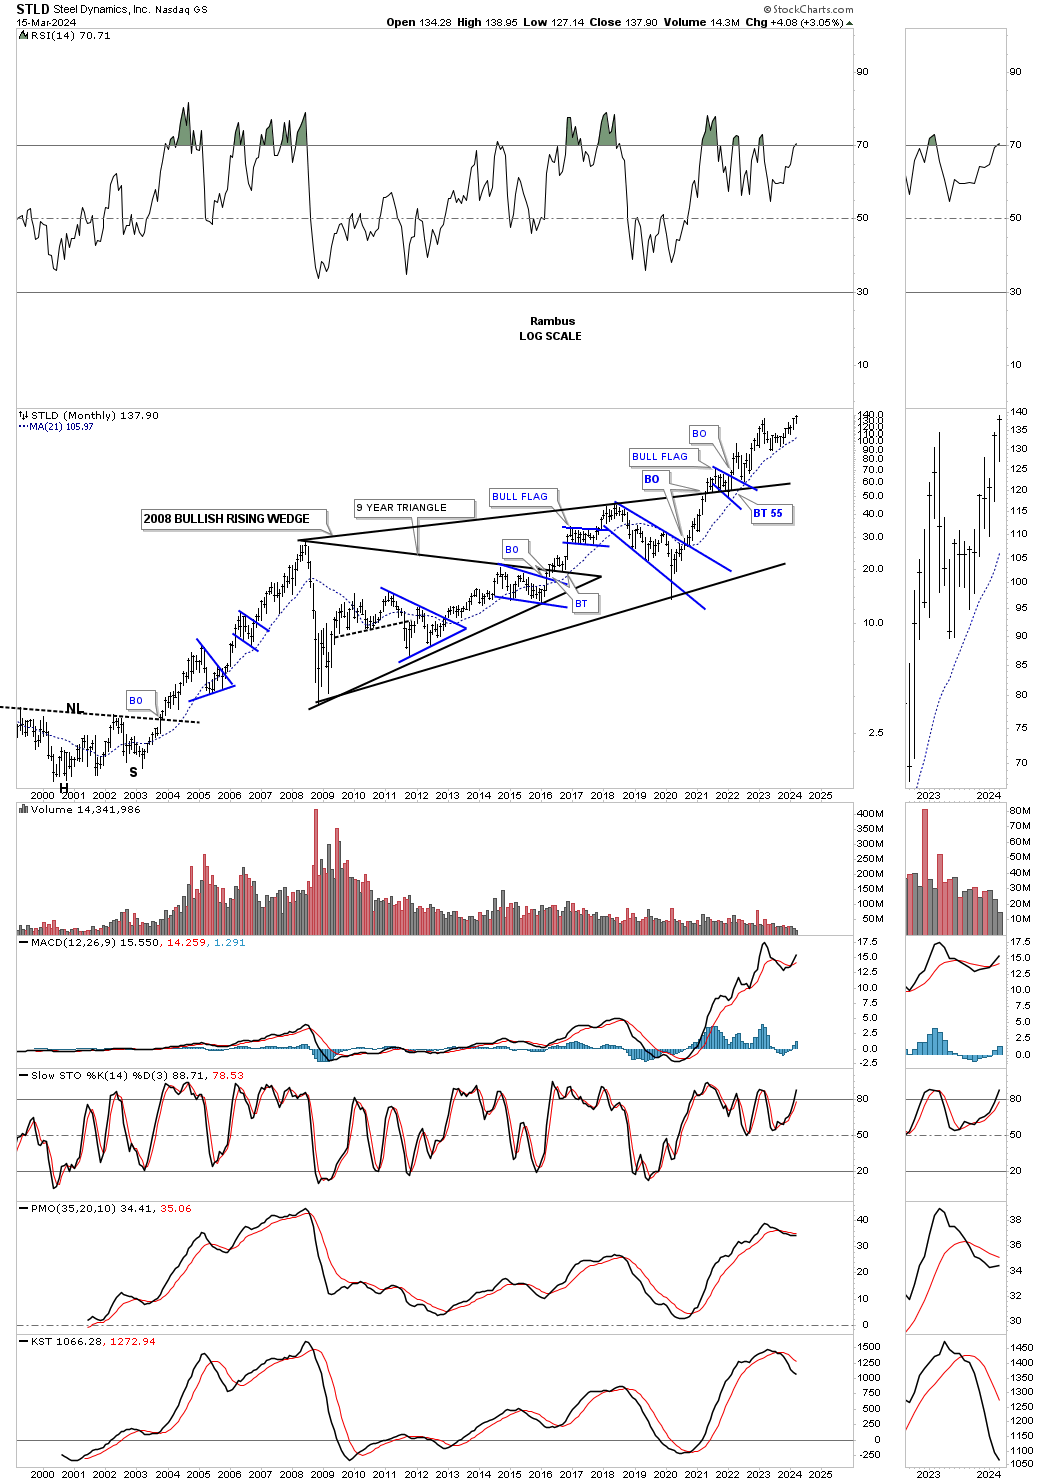
STLD is a strong steel stock and is trading at a new all time high after breaking out from the massive bullish rising wedge. Note how well the 21 month sma has held support.
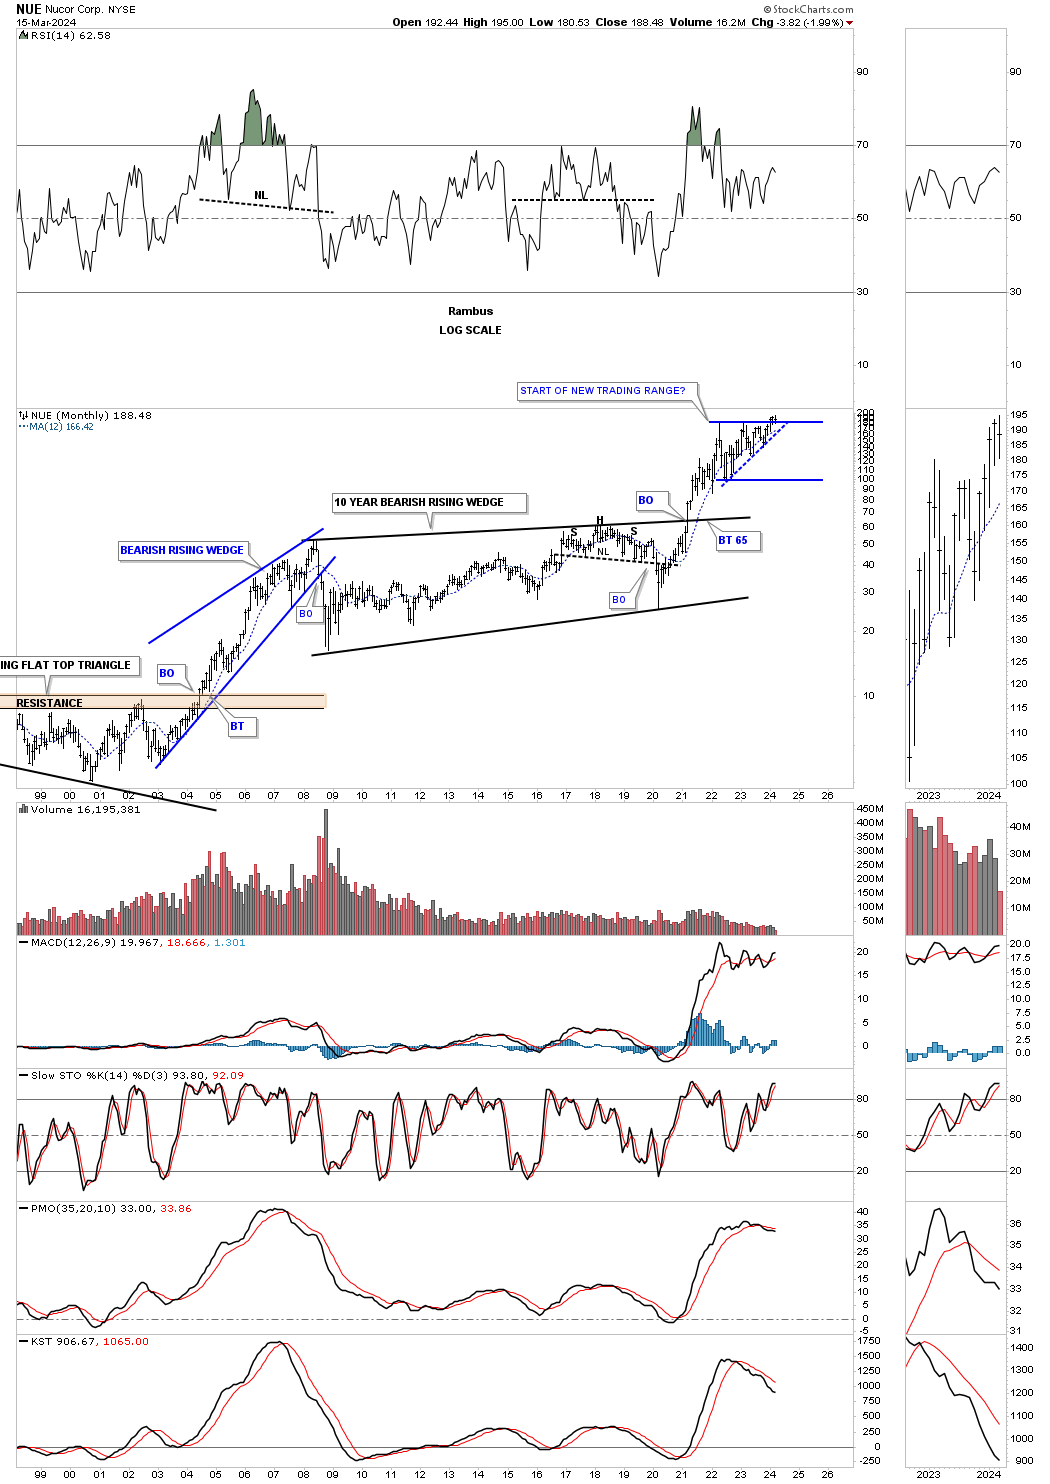
NUE has also been strong but so far hasn’t been able to trade into new all time high territory with any conviction yet.
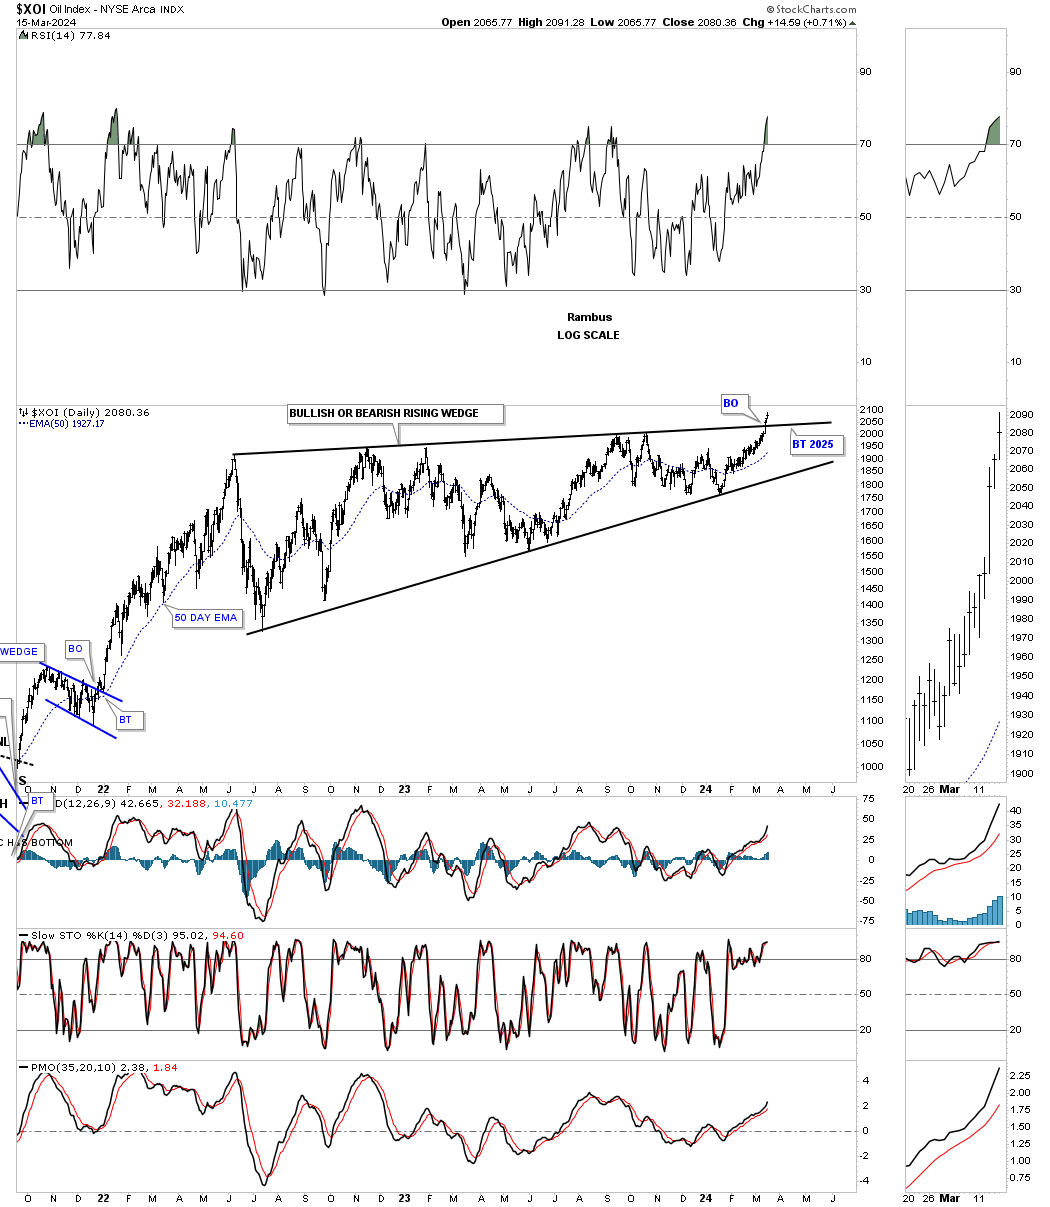
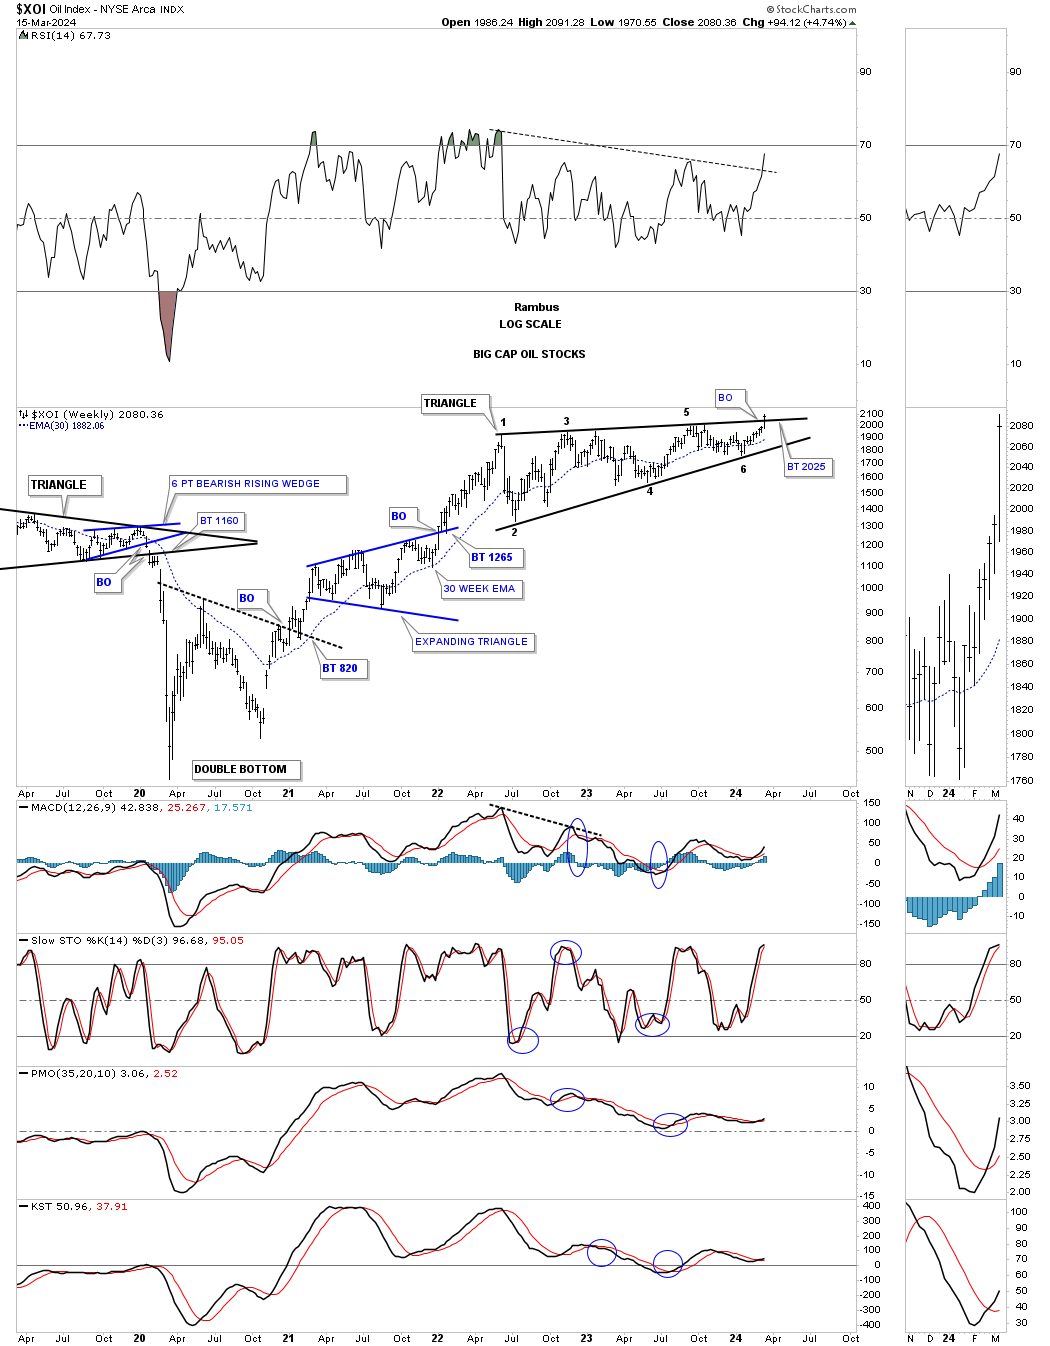
Next is our old friend the XOI, big cap oil stocks fund, we’ve been following closely for several years. It just kept bouncing around in the 2022 bullish rising wedge and may have finally broken out above the top rail after competing the 6th reversal point.
The weekly chart for perspective.
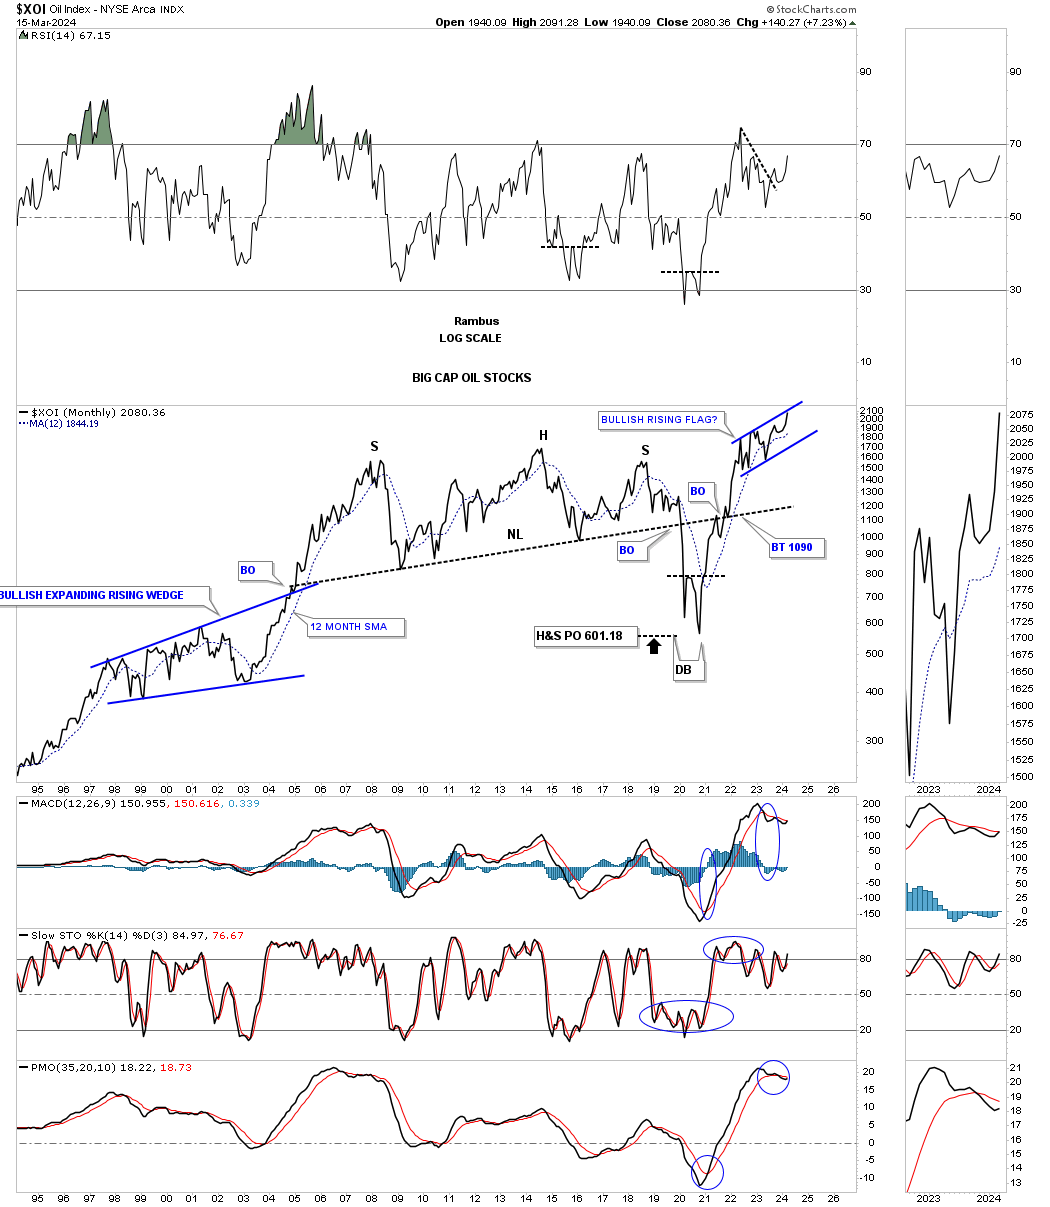
This monthly line chart shows the potential bullish rising flag if the top trendline can be taken out.
What could this history quarterly line chart for the XOI be telling us for the big cap oil stocks? From a Chartology perspective, the 25 year black expanding triangle that now shows a breakout and backtest, could be a halfway pattern. If that were the case then oil would literally have to go to the moon and possibly Mars over the next 15 years or longer to affect the big cap oil stocks in such a huge way.
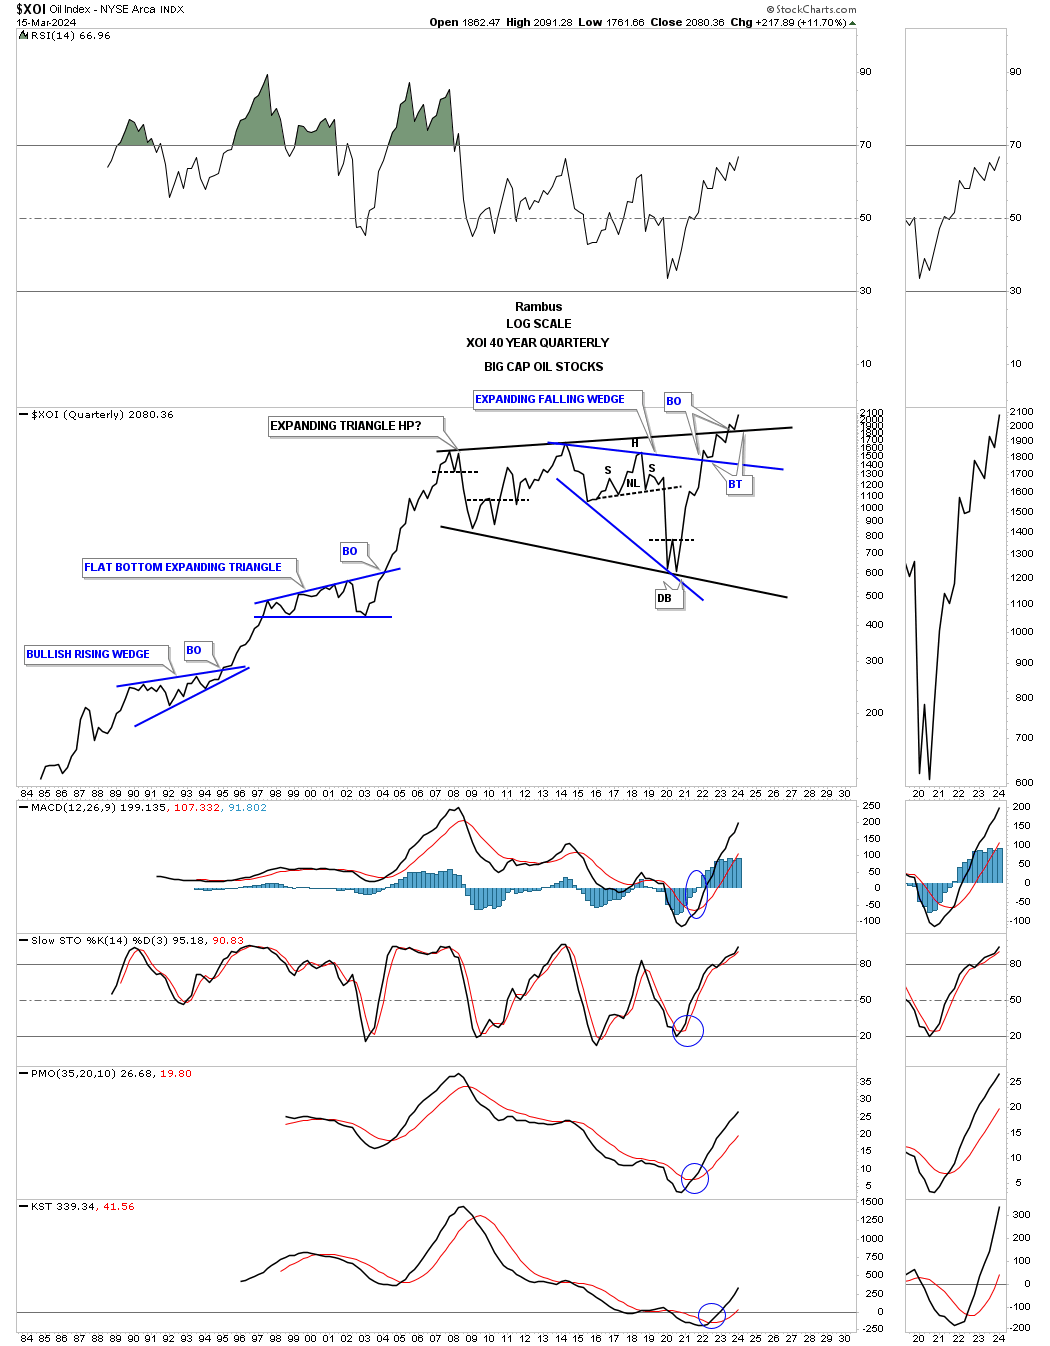
What the quarterly XOI line chart above reminds me of is the black expanding triangle we’ve been following on Gold that has also broken out to new all time highs, but from a somewhat smaller expanding triangle.
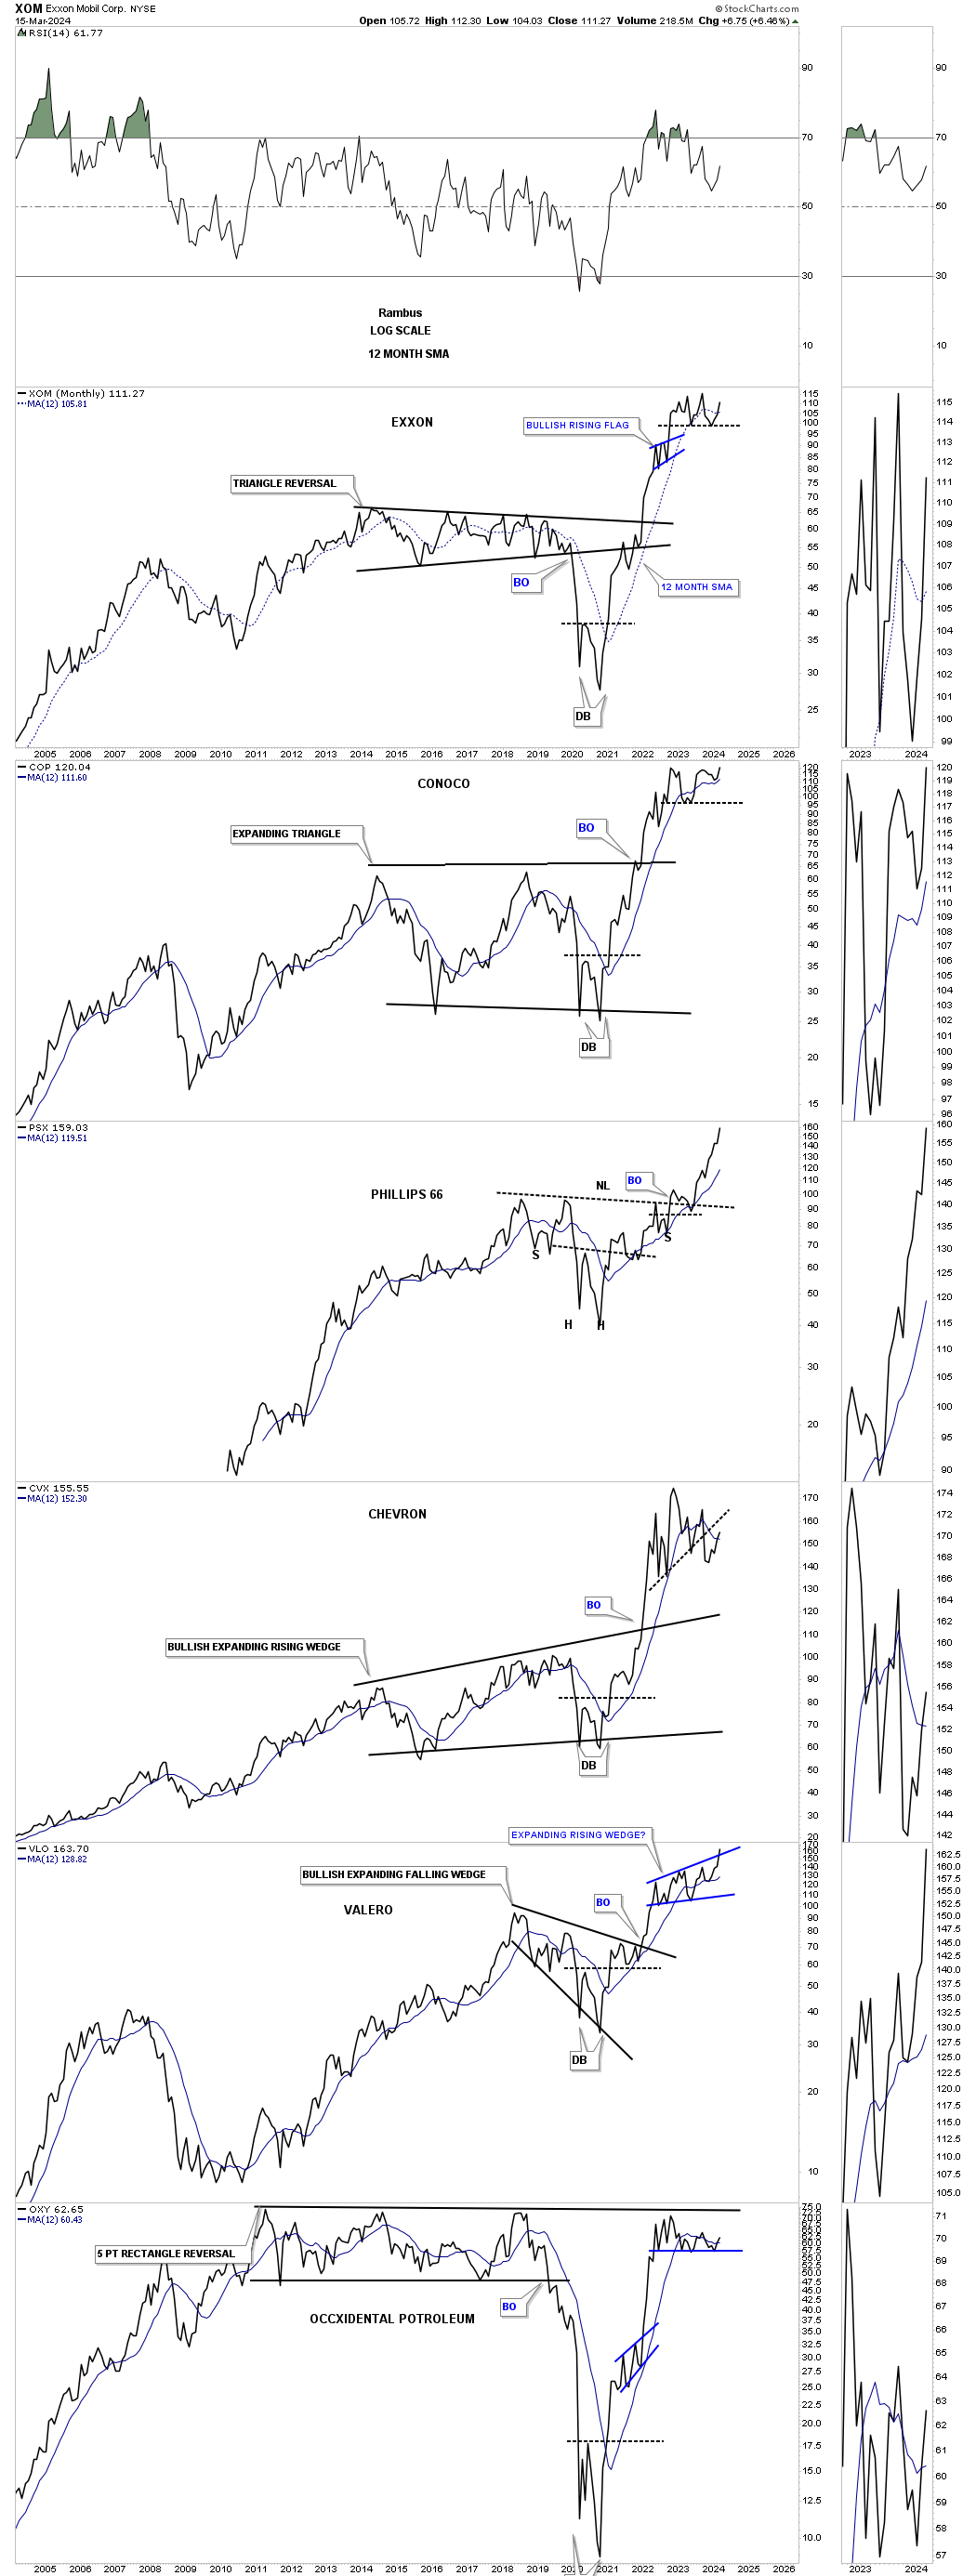
Below are some large cap oil stocks from the longer term monthly perspective which shows their 2020 rally and the sideways trading range since the initial high. PSX looks by far the strongest with VLO attempting to breakout from the blue rising wedge.
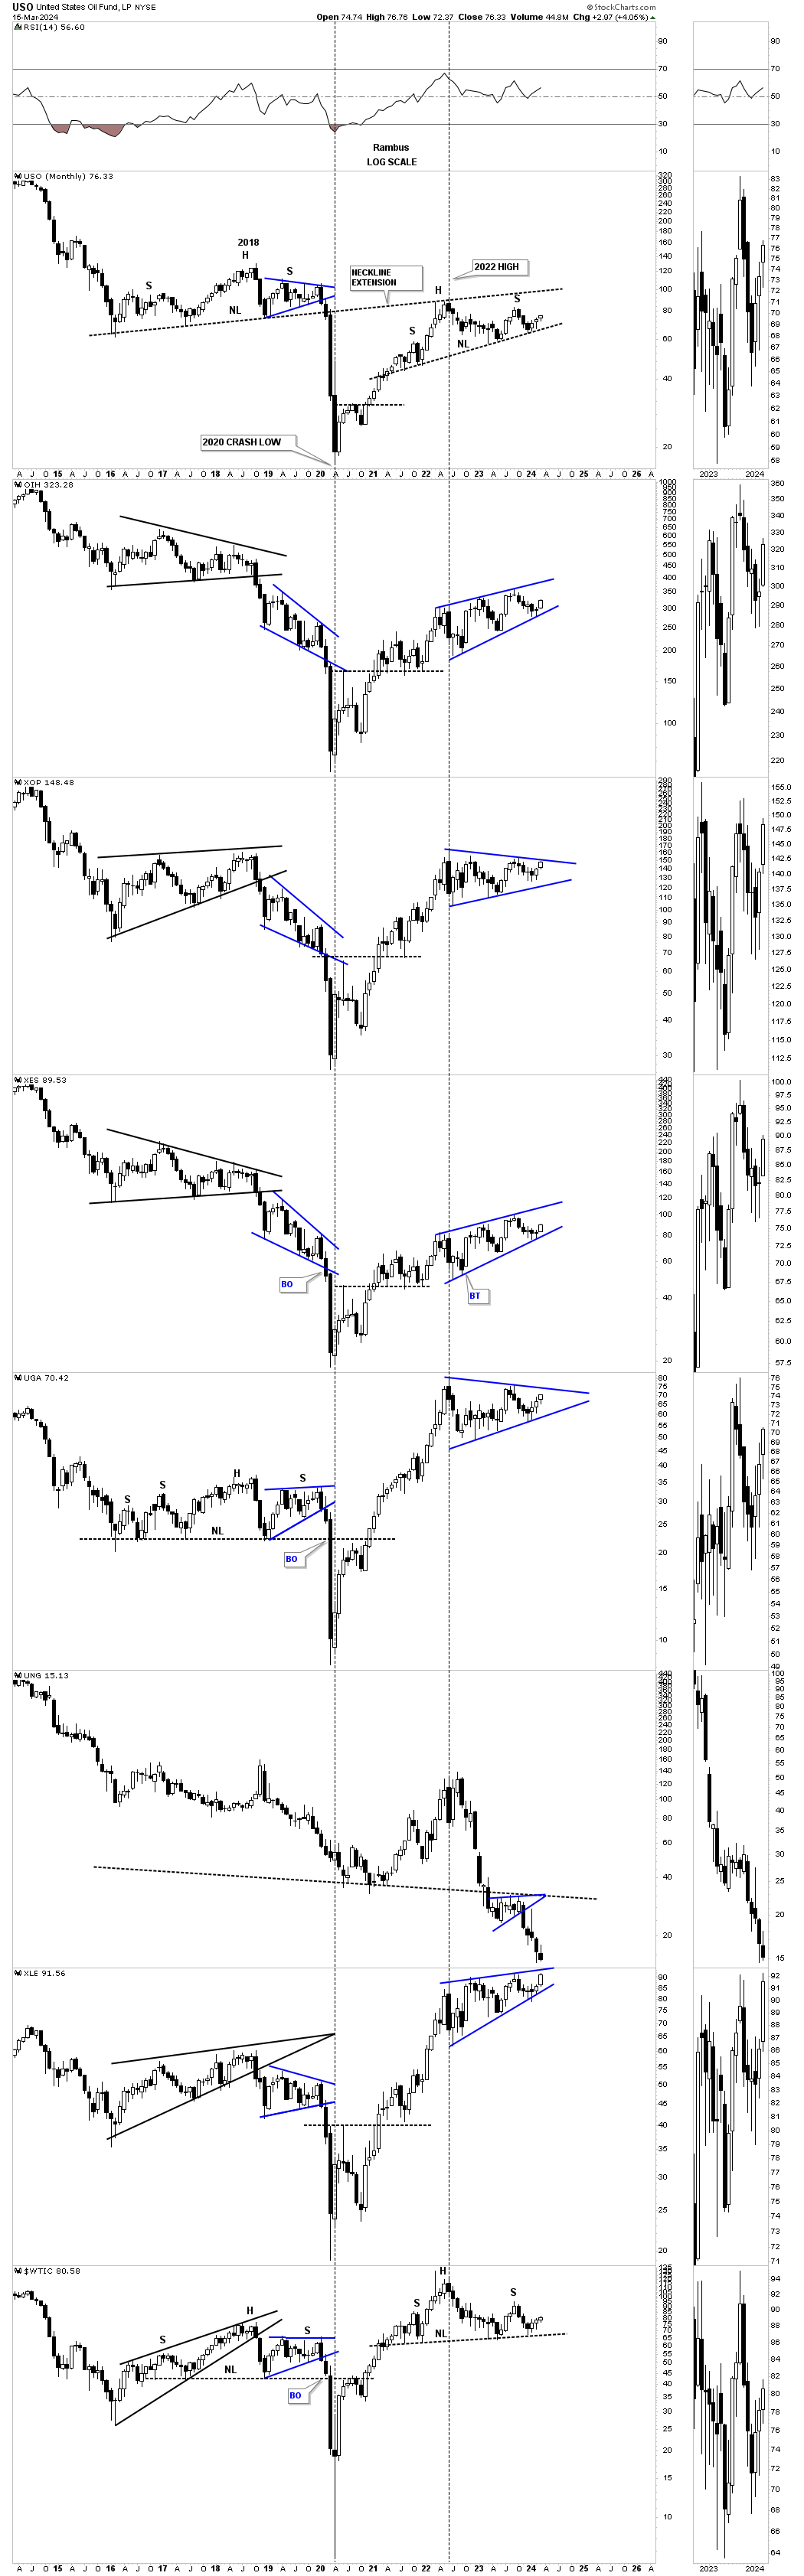
Looking at this monthly candlestick chart for the energy complex they are all still trading inside of their blue trading range for the most part except UNG which is in a world of its own. As you can see there are several possible blue bullish rising wedges if the price action can trade above the top trendline. USO on top with the WTIC on the bottom are still showing a possible H&S top which can be negated if the price action can trade higher than the right shoulder high. If that were to happen then we would see a triangle similar to the XOP and UGA.
The 2020 crash low was a pivotal turning point in many areas of the markets including interest rates which ended a 40 year decline. What we’ve been witnessing since the 2020 low is the first leg up in a secular change of trend that lasted close to two years. After such a powerful impulse move it was time for the price action to consolidate those gains to get ready for the next impulse move. It’s how markets work. All we have to do is follow the charts and and let them show us what is possible.
It is so hard to keep an objective point of view when we are bombarded everyday from so many different analyst and their varying opinions. The only opinion that I care about is what the charts saying. All the best…Rambus
Melt Up Or Secular Bull Market Rally
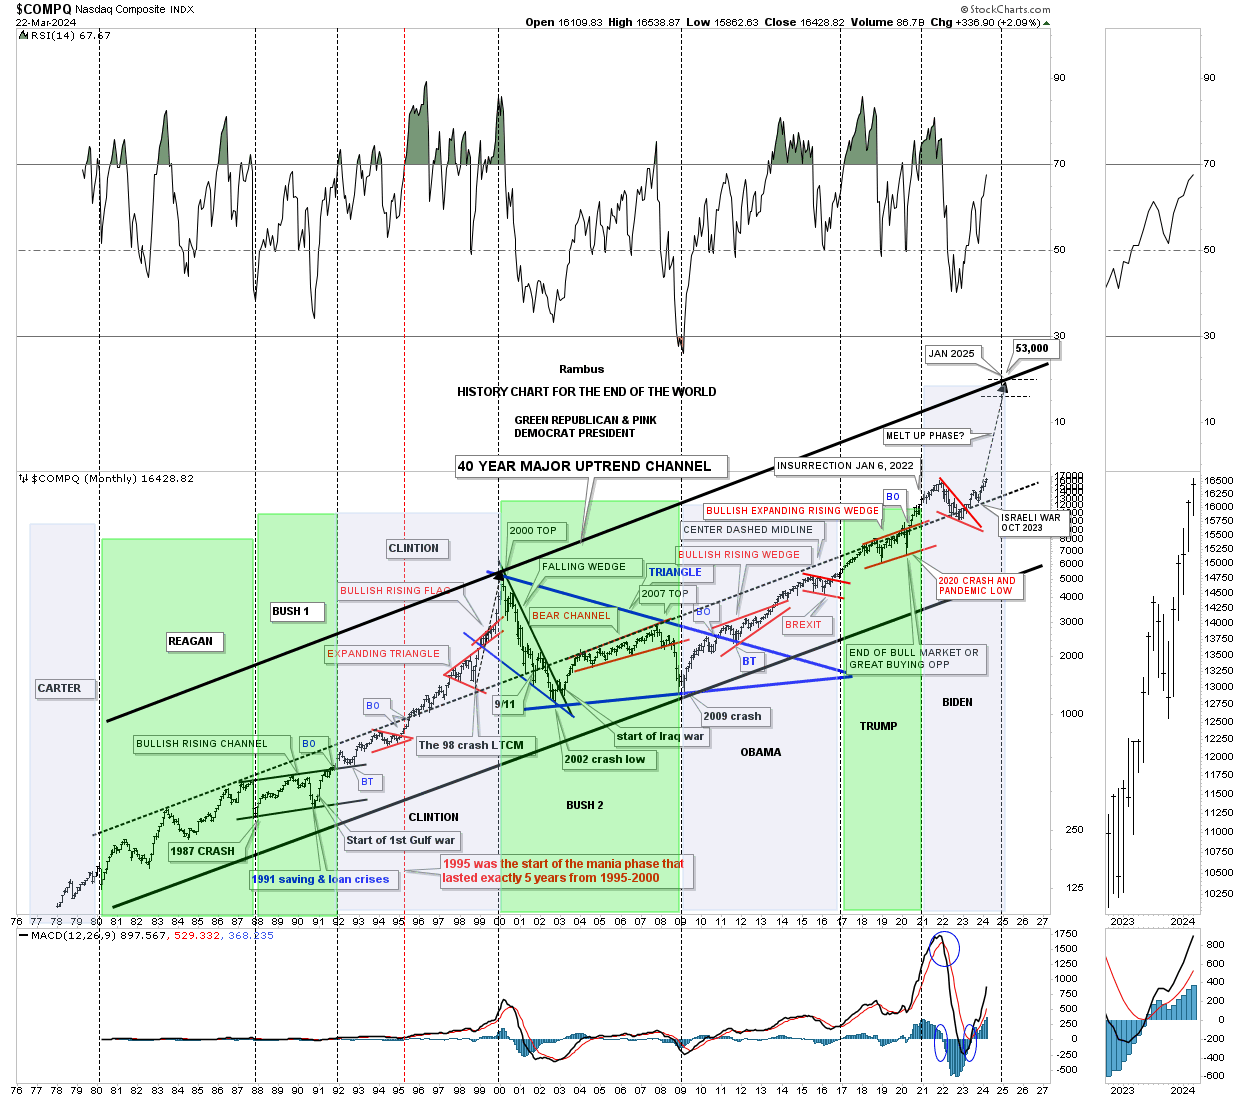
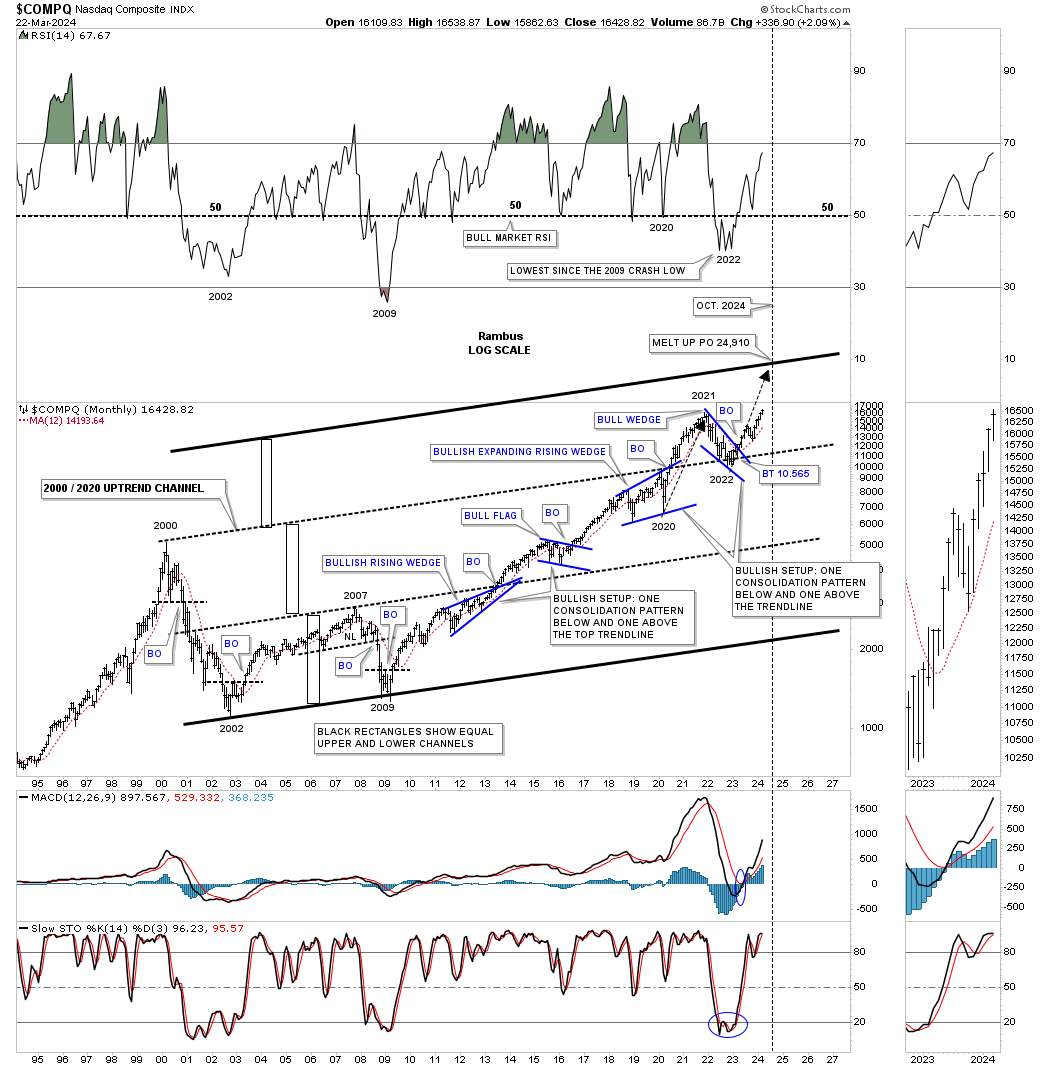
Tonight I would like to update some of the charts for the US stock markets we’ve been following very closely since the October 27, 2023 low. That important low could mark the beginning of the melt up phase that is going to end the 2009 secular bull market or it could be just another rally phase in the 2009 secular bull market. It’s too early to know for sure yet, but anyway you slice it a strong rally has been ongoing since the October 2023 low.
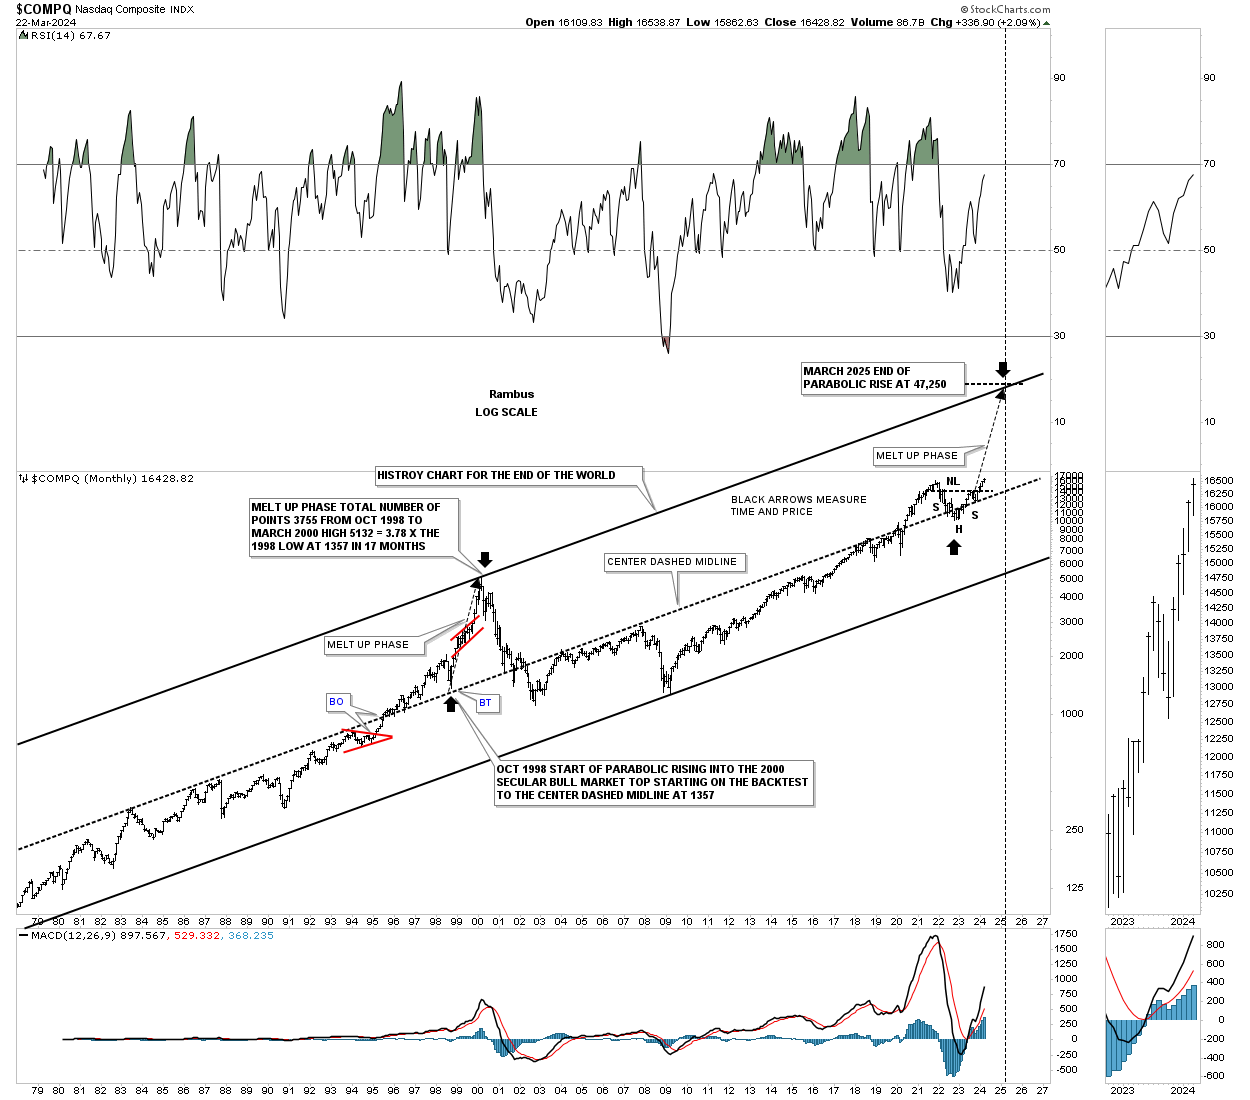
This first chart is the old history chart for the COMPQ which shows all the important events that felt like the end of the world if you were trading the markets when they occurred with most showing a great buying opportunity.
What triggered my curiosity is when the price action broke back above the center dashed midline toward the end of Trump’s presidency and was backtested with the red bullish falling wedge under the Biden administration. I’ve always hoped to see a run to the top trendline similar to what we saw during the parabolic rise into the 2000 secular bull market high.
Below is the shorter term version of the possible melt up phase which shows another doubling of the lower channel with the blue bullish falling wedge backtesting perfectly to the 2000 trendline and now rallying strongly away. If the price action reaches the top trendline sometime around the October time frame then its possible this current rally, which is equal to the 2020 to 2022 rally as shown by the black arrows, could mark the end of the melt up phase.
Then we have the real melt up phase which is strongly related to the 1998 to 2000 blowoff rally that ended the 1974 to 2000 secular bull market. As you can see if this is going to be the case for a melt up phase then this rally is really just getting started. What I’ll be watching very closely is how close the angle of the long black arrow, that matches up to the 1998 to 2000 black arrow, moves in time and price. I know it seems impossible right now but secular bull markets don’t end with a whisper they end in a Big Bang!!!
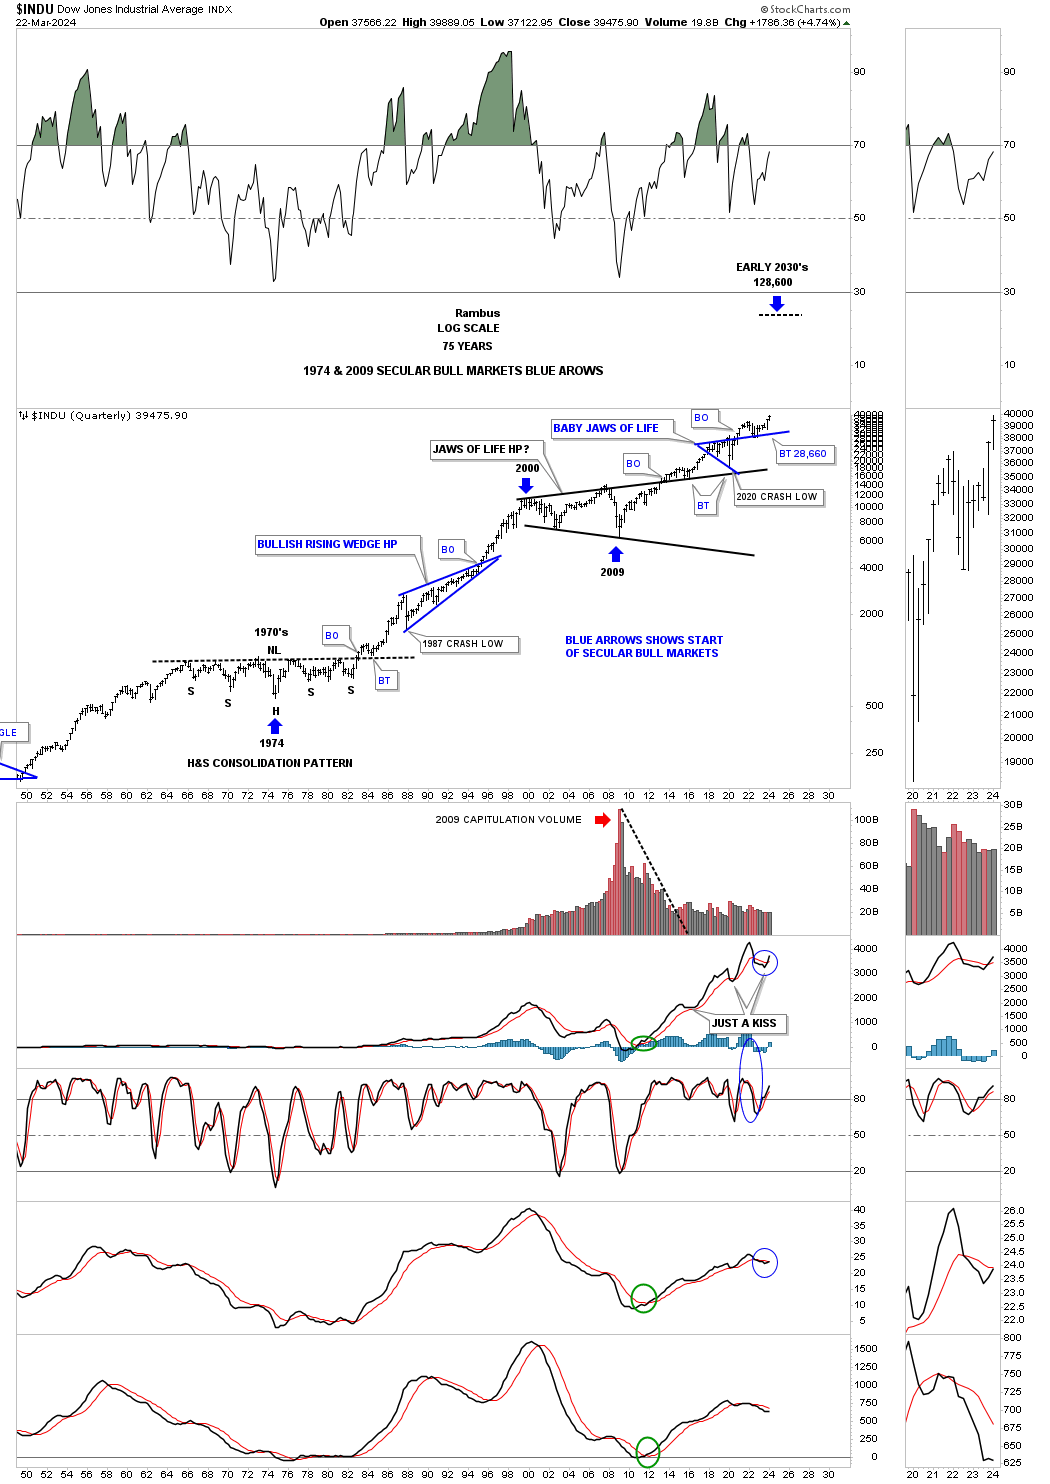
The third bullish scenario is a continuation of the secular bull market that began at the 2009 crash low which could end in the early 2030’s as shown on this 75 year quarterly chart for the INDU.
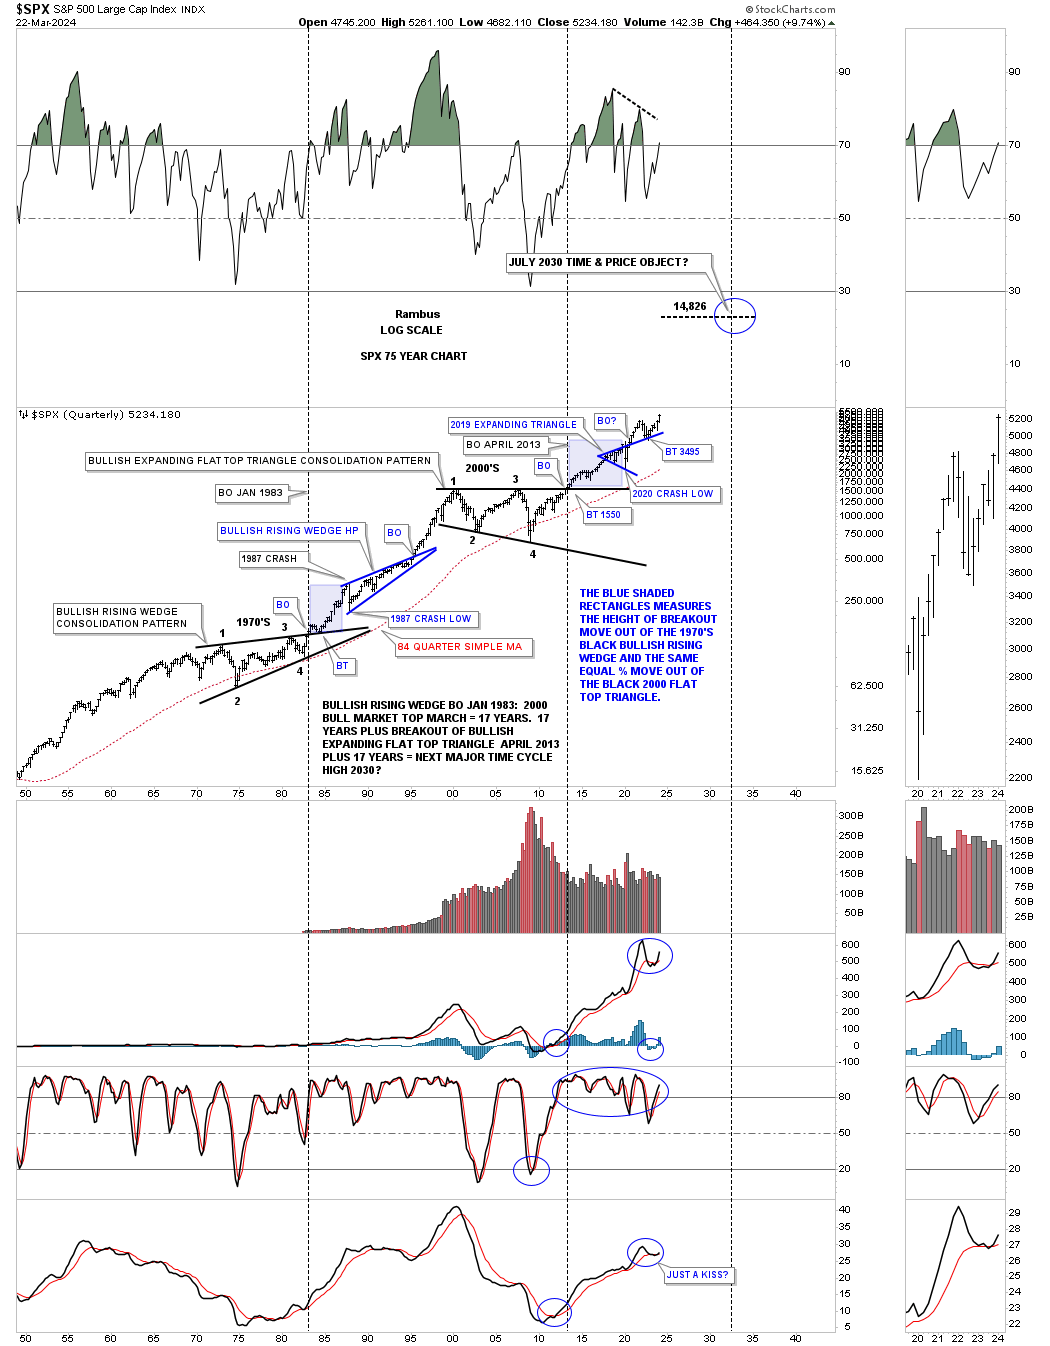
The secular bull market for the SPX.
Before we move on I would like to update the daily line combo chart I usually post on the Markets Update each week going back to the end of January of 2023 so you can see how it has progressed over the last three months.
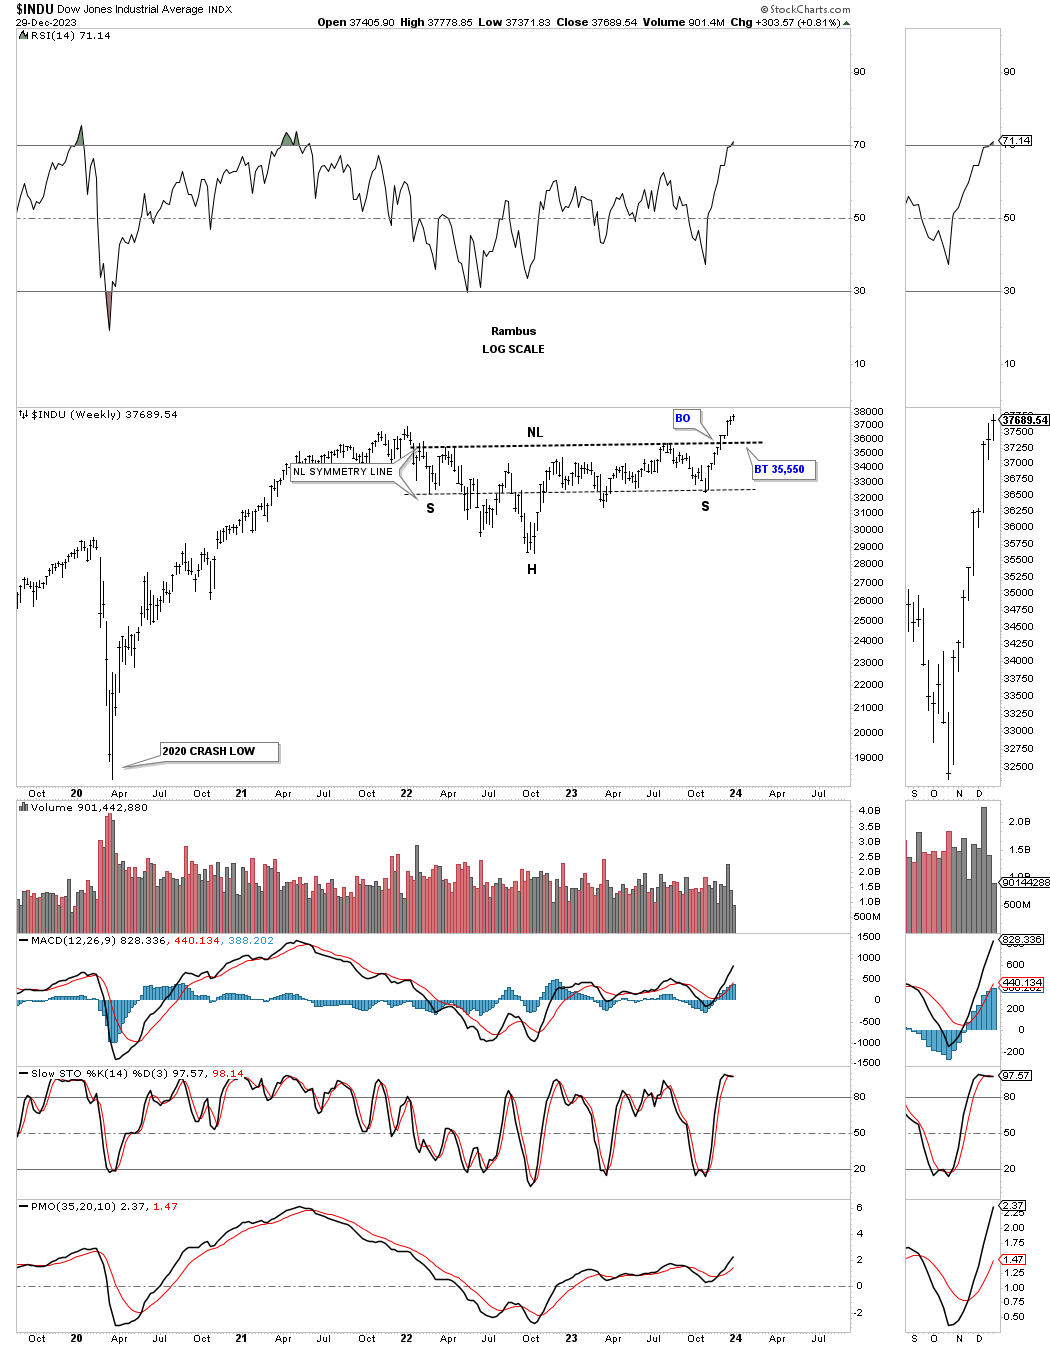
This is what I wrote on December 29, 2023 showing the H&S consolidation pattern on the INDU.
December 29, 2023:
This weekly chart for the INDU shows the H&S consolidation pattern with a strong breakout move so far.
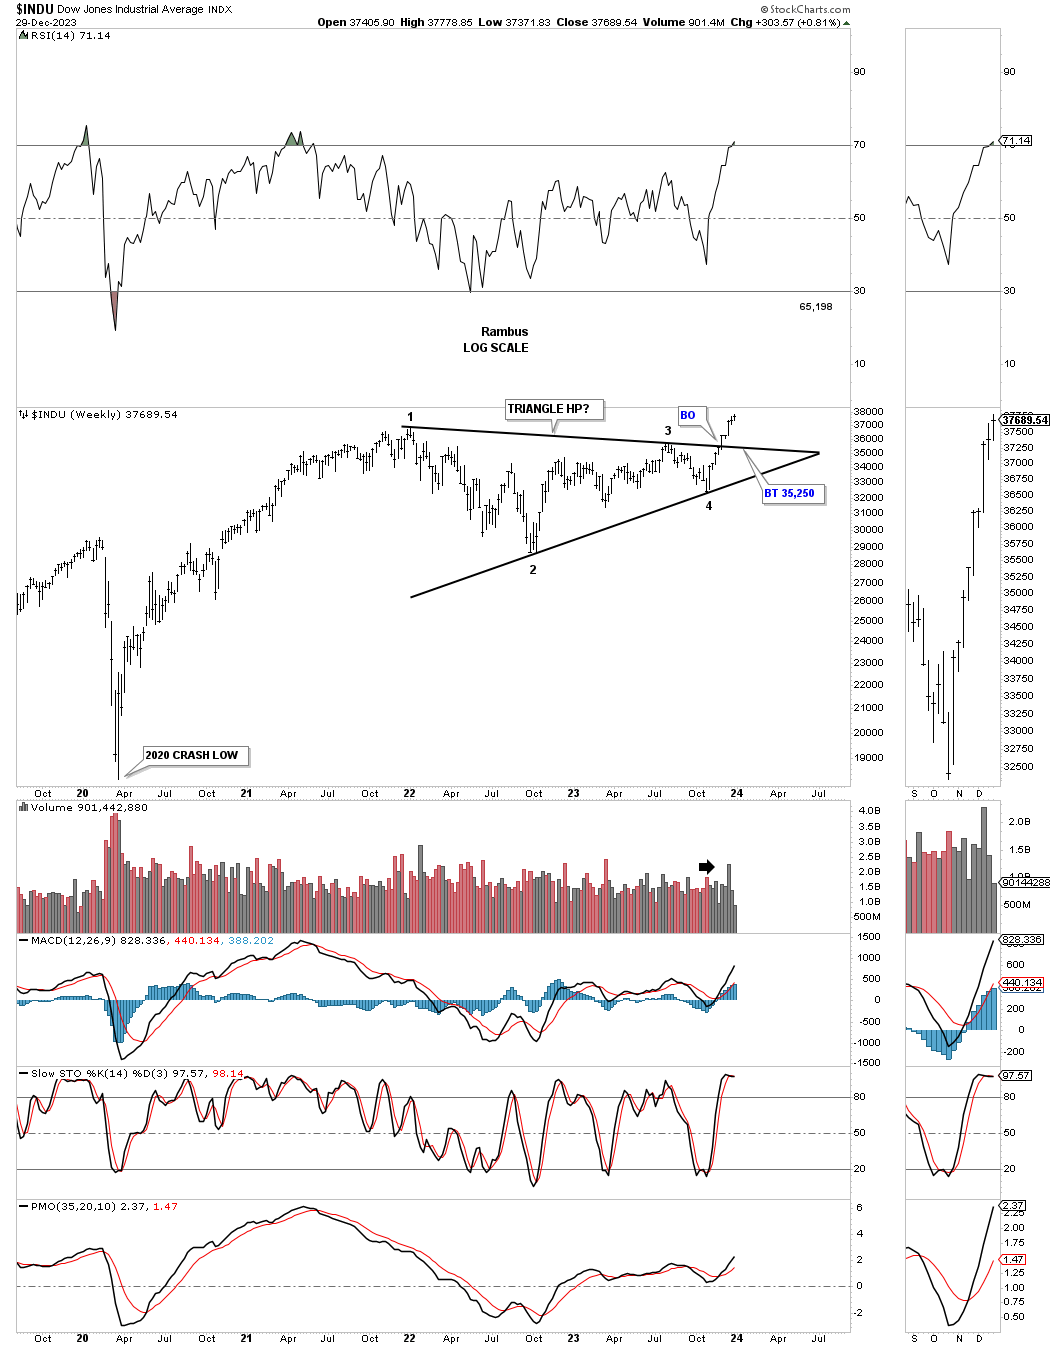
In that same post I also showed the triangle that was also forming within the same consolidation pattern.
December 29, 2023:
The other consolidation pattern the INDU carved out during the consolidation phase was this symmetrical triangle consolidation pattern. Both are valid consolidation patterns. Note the volume on the breakout move.
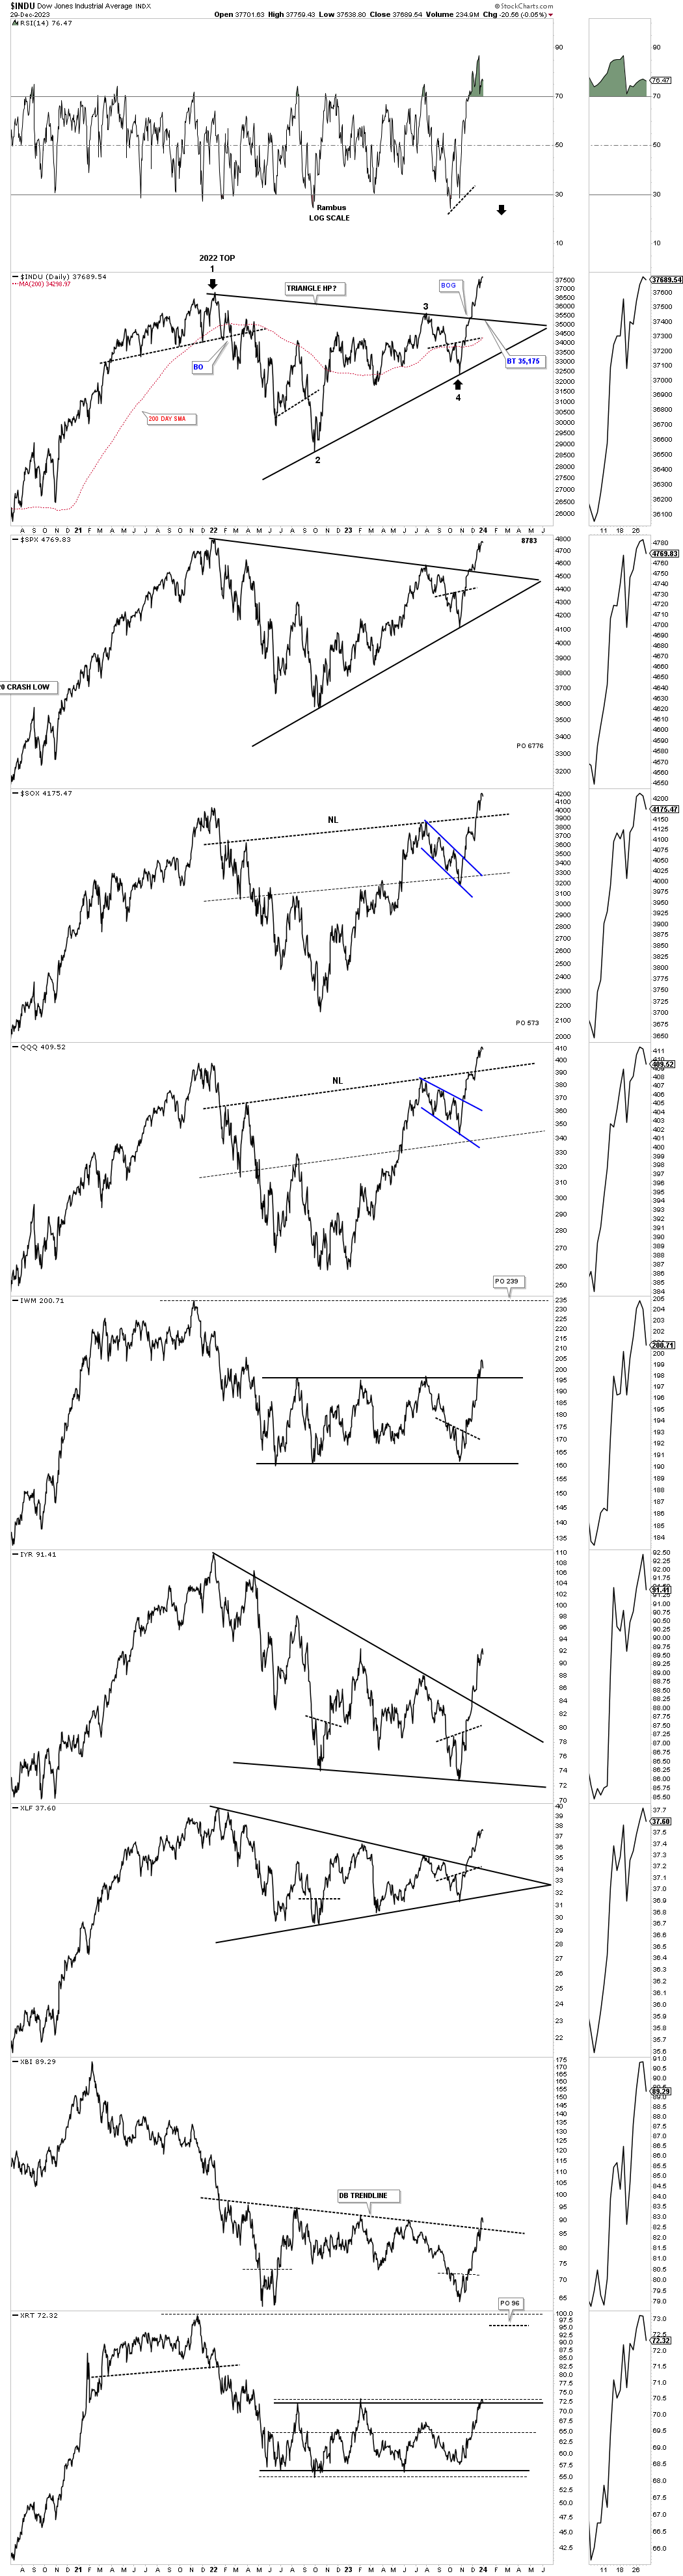
Below is what the daily line combo chart looked like on December 29, 2023.
December 29, 2023:
This last chart for today is a new combo chart which shows most of the underlying indexes for the stocks in the Leveraged Trade Portfolio. The stock markets are getting extremely overbought and need to rest for awhile. I think the rest could be a backtest to the breakout points on the different consolidation patterns. There is no law that says a backtest must happen, but it would be healthy for a 3% to 5% correction.
Since today marks the end of the month of trading I’ll be updating all the stocks in the three different portfolios I do at the end of each month when we have so many trades on the books.
The longer these trades stay active the better it becomes that we caught an important low and can move the sell/stops higher. Many of the trades in the Leveraged Trade Portfolio we initial took when the etf’s were still trading below their 30 week ema which I like to use for the sell/stop. The monthly update this weekend will show that almost all of the leveraged trades are now trading above their 30 week ema which I can now use as the sell/stop. The longer the rally last the higher I can move up the sells/stops.
I would like to wish everyone a healthy and happy new year and don’t be afraid to see the glass as half full and not half empty. All the best…Rambus
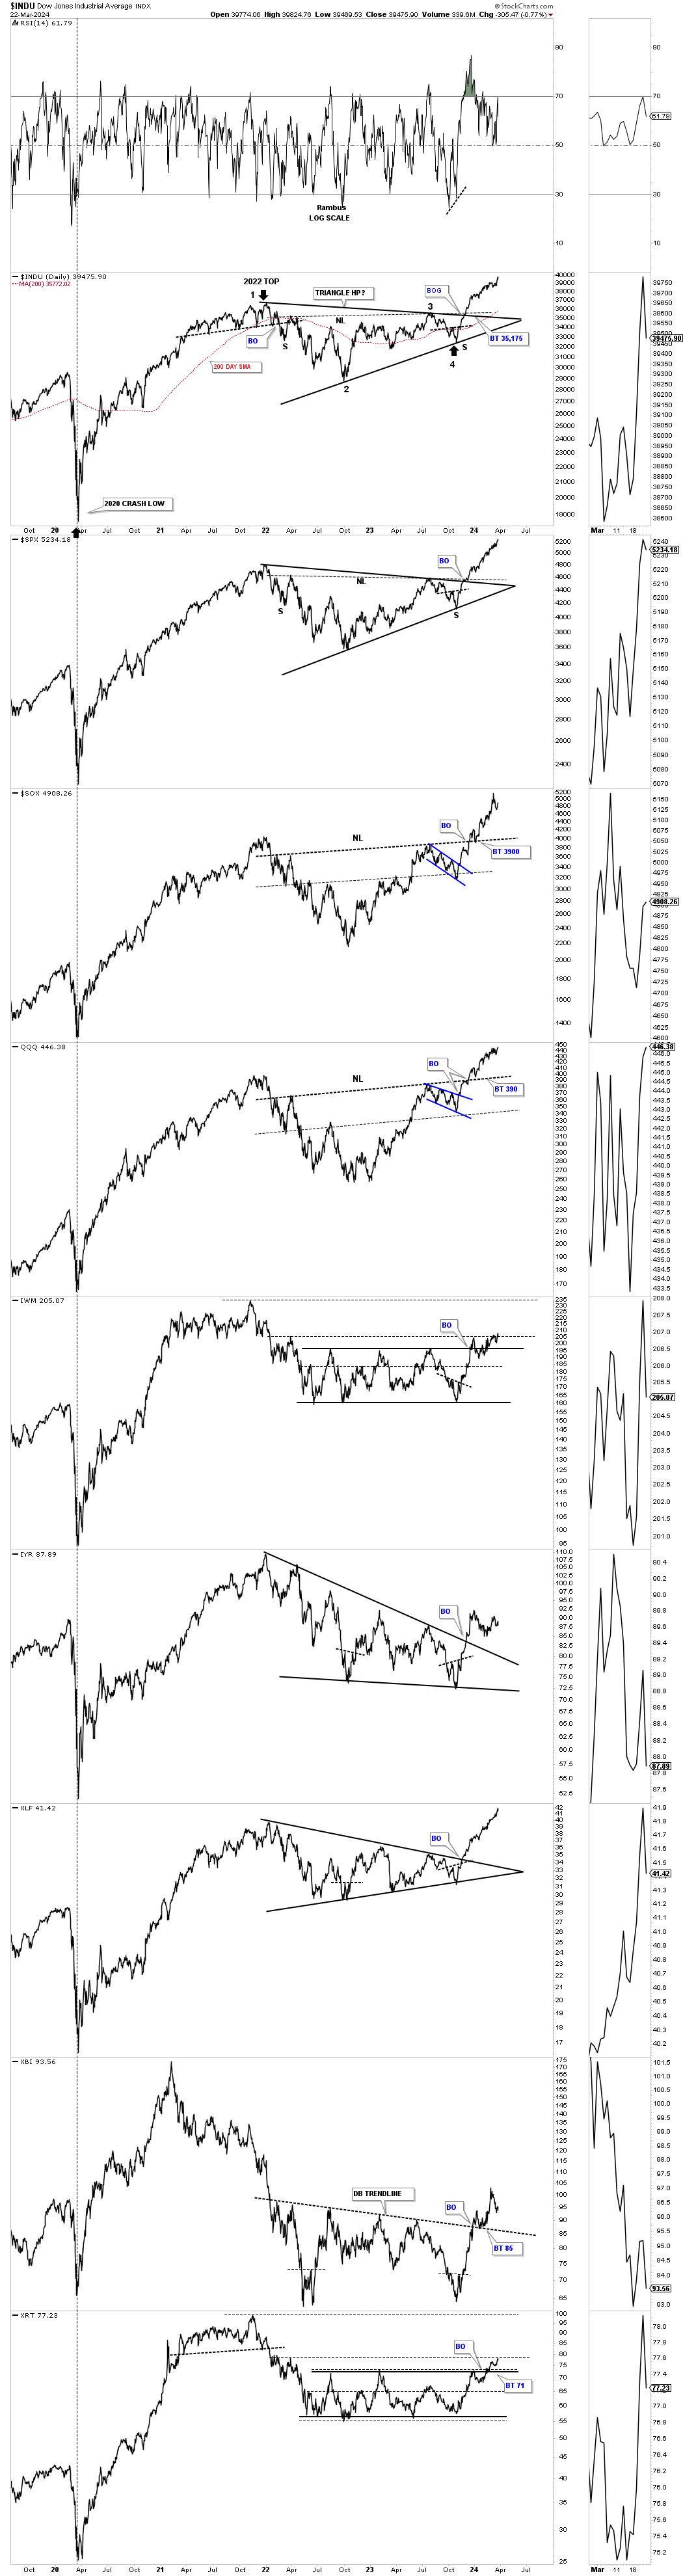
Today March 24, 2024:
This is how the daily line combo chart has progressed over the last three months. I did add the neckline on the SPX and INDU to show the combo consolidation pattern in one.
The reason I wanted to show you the H&S consolidation and triangle consolidation pattern on the SPX is because I use them both in later updates which you have previously seen.
I would like to show you the progression of the 2023 rally on the SPX starting with the bullish expanding falling wedge low in October of 2023 that has played out beautifully. So far during the strong impulse move out of the October 27, 2023 low two recognizable smaller blue consolidation patterns have formed so far which is classic bull market price action. Depending if the SPX is in a melt up phase or this is just another rally in the on going secular bull market that began at the 2009 crash low that we looked at on the quarterly charts above, will tell us what to expect by the size of the next consolidation phase.
If we see a bigger consolidation pattern form similar to the black expanding falling wedge that would suggest the secular bull market may still have the upper hand with many more years of bull market price action going into the easy 2030’s.
On the other if we only see small consolidation patterns building out similar to the two small blue patterns below since the October 27, 2023 low, then the melt up or blow off phase is in progress which will strongly suggest the secular bull market is over and to look for a PBC, Post Bubble Contraction.
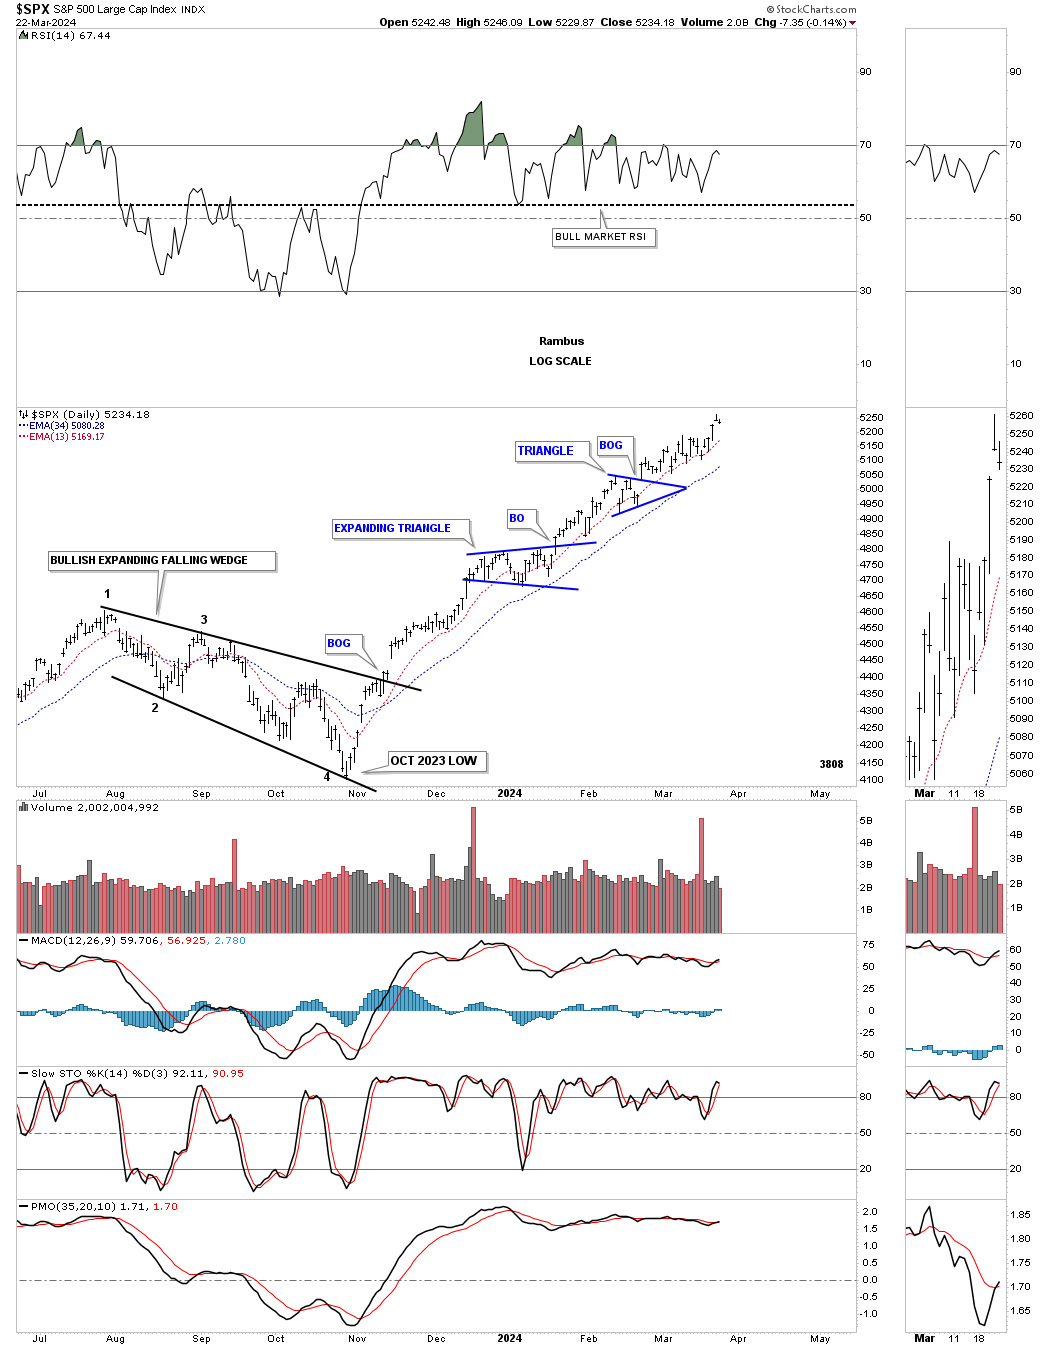
I would like to update one more chart for the SPX we were following very closely at the October 27, 2023 low.
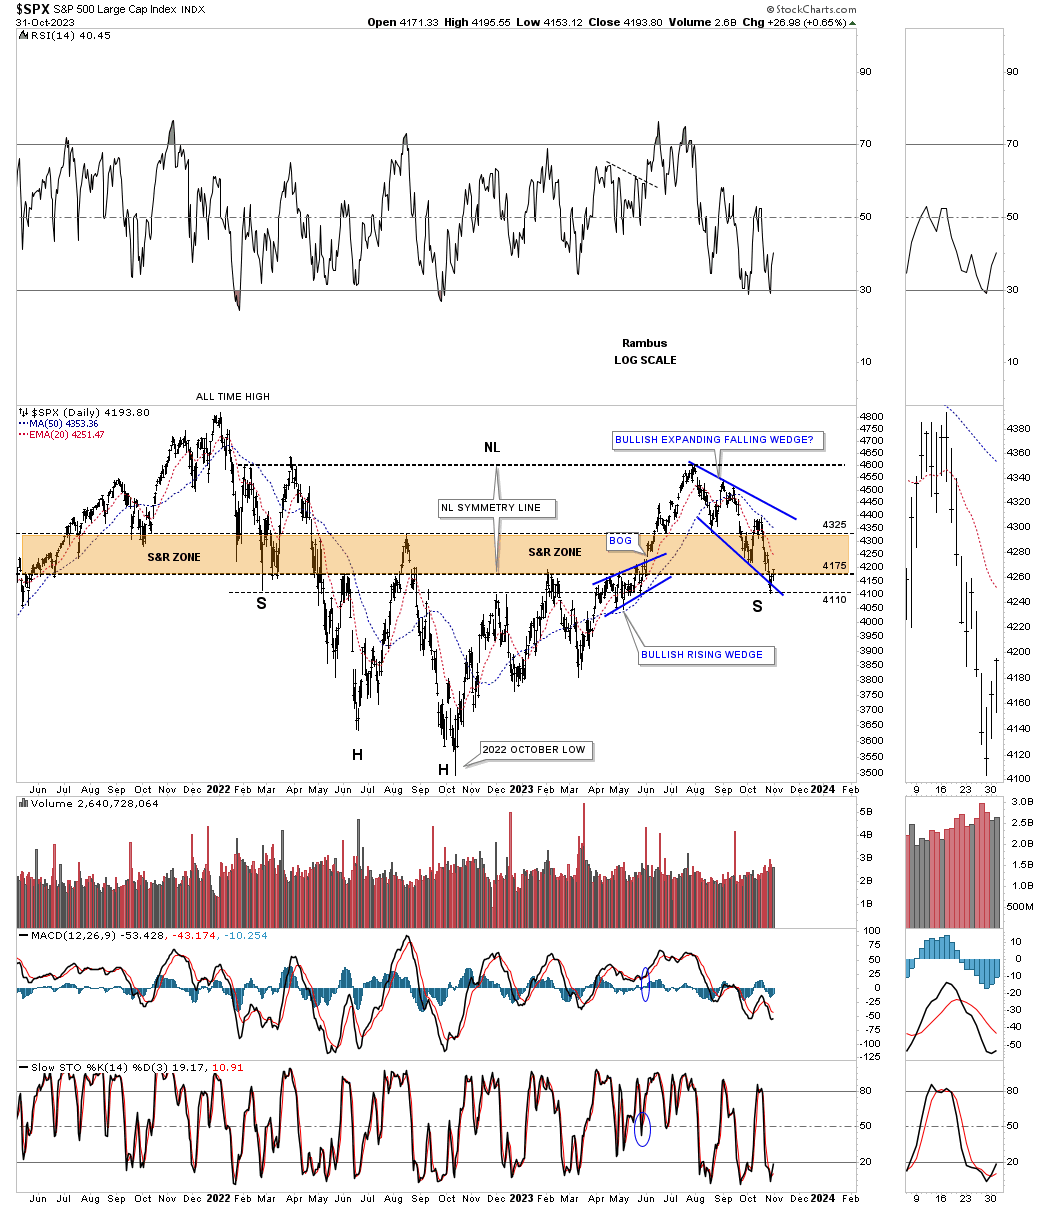
October 31, 2023:
Another chart we looked at last week was this daily chart of the SPX showing the possible two year H&S bottom with the possible right shoulder under construction. Similar to the SOX above the SPX is testing the very low of its possible right shoulder.
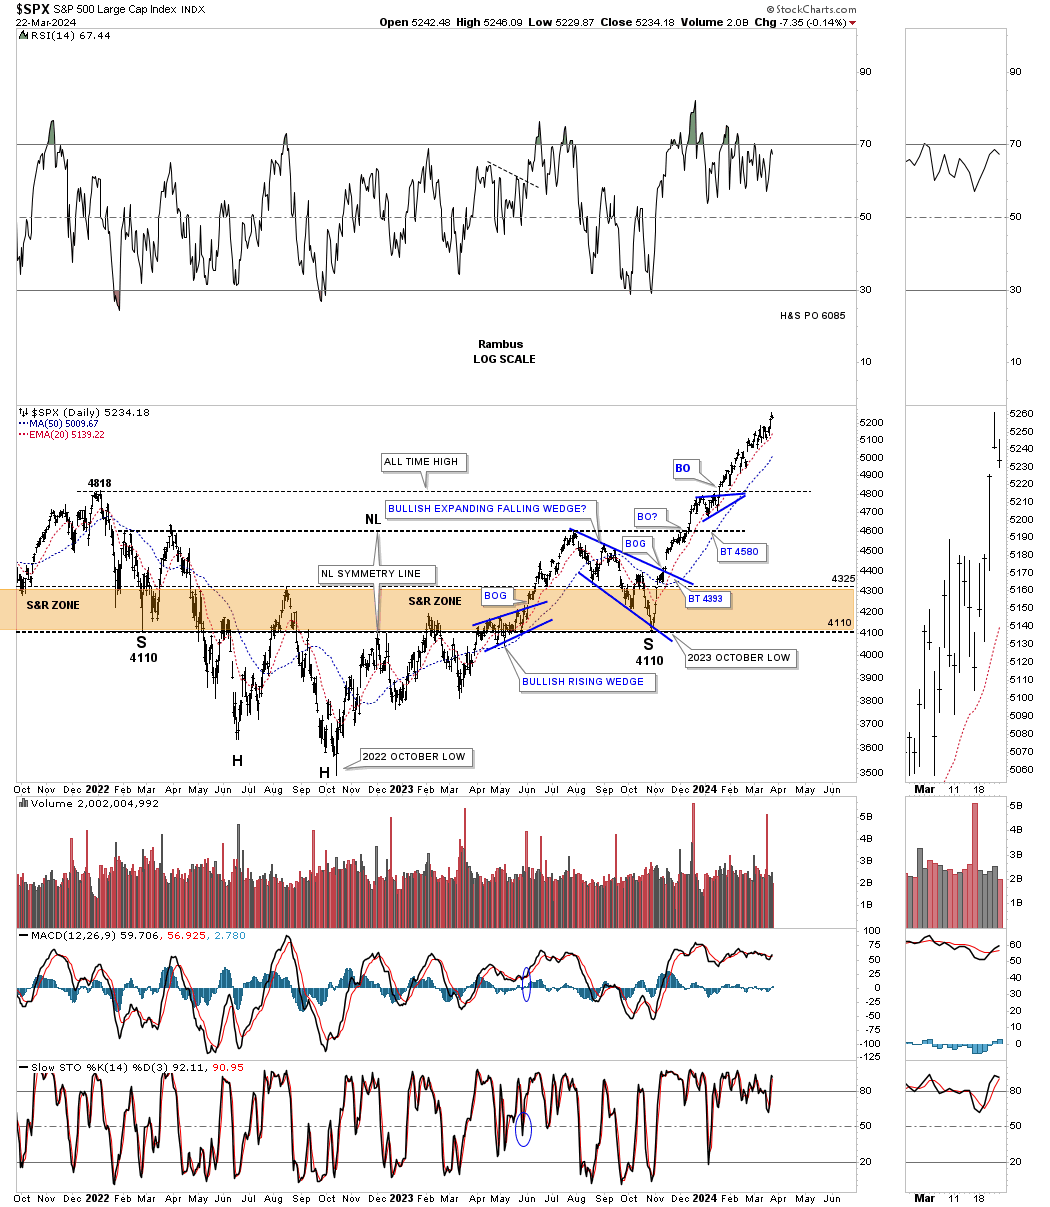
Today March 24, 2024:
Below is the same daily chart as the one above and shows how the H&S consolidation pattern has played out so far. If you recall we were looking for the right shoulder low at the 4110 area which was shown by the neckline symmetry line taken from the left shoulder low.
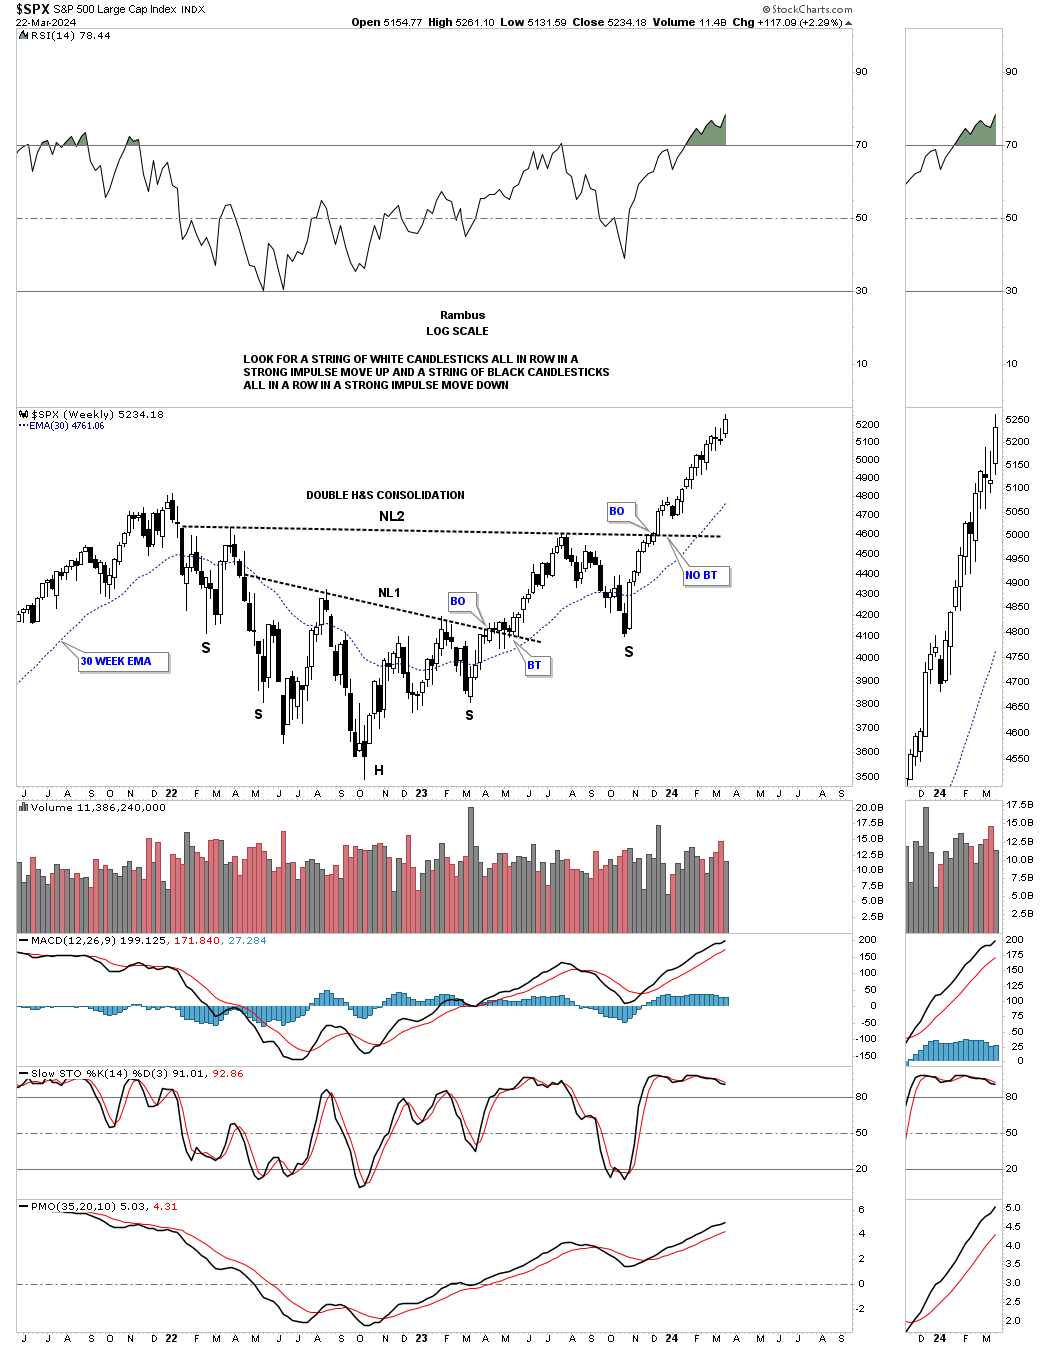
Below is the weekly candlestick chart for the SPX which shows its beautiful impulse move out of the October 27, 2023 right shoulder low by the string of mostly white candlesticks.
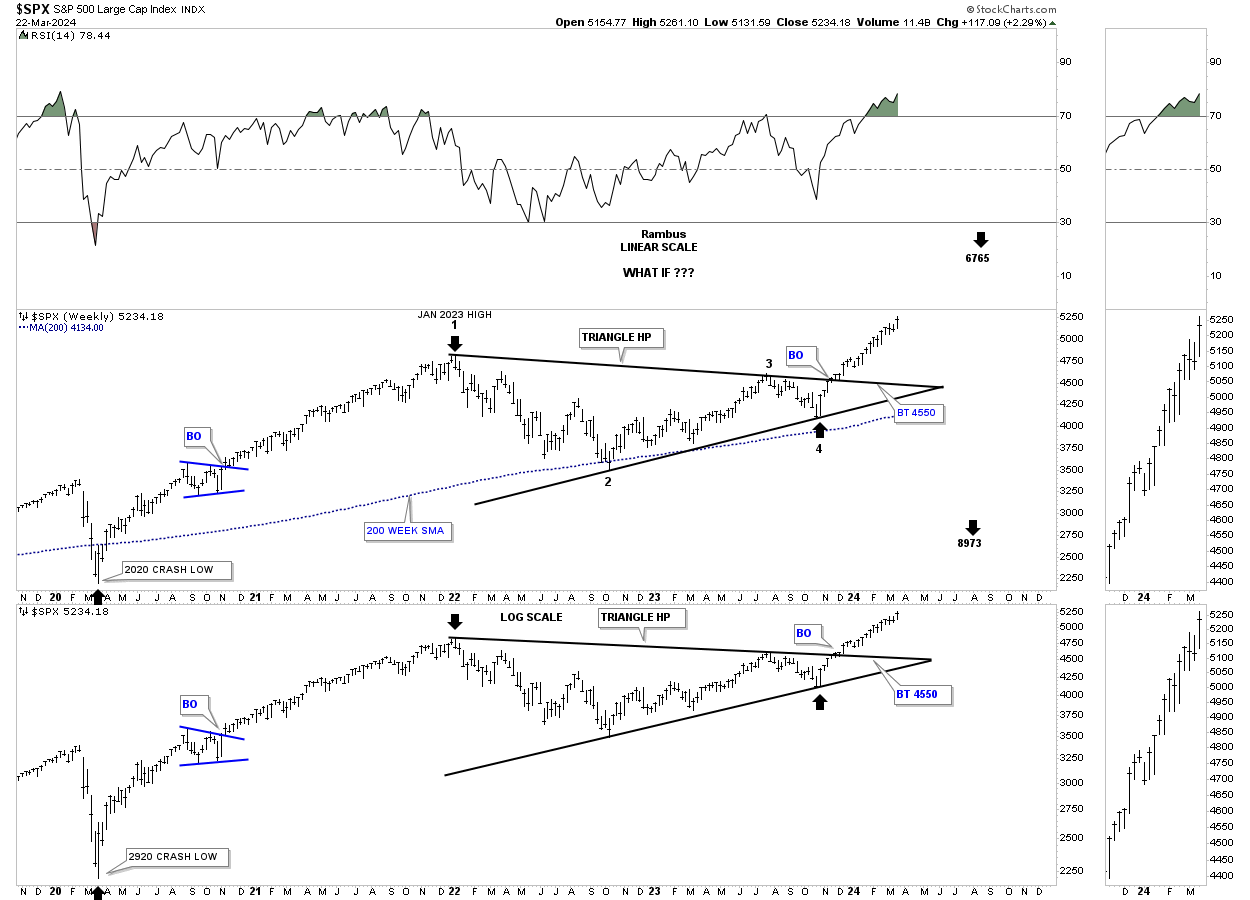
Looking at the triangle portion of the combo H&S / triangle consolidation pattern, the black arrows measure the possible price objectives from the linear and log scale perspective, as shown by the black arrows using the triangle as a halfway pattern from the 2020 crash low.
To put the 2023 triangle consolidation pattern into perspective below is a long term monthly chart showing the secular bull market that started at the last reversal point in the 2000 bullish flat top expanding triangle. Note the classic Chartology since the 2009 crash low with one consolidation pattern forming on top of the previous one.
What you may also find interesting is the 2000 to 2013 flat top expanding triangle consolidation pattern, sound familiar?
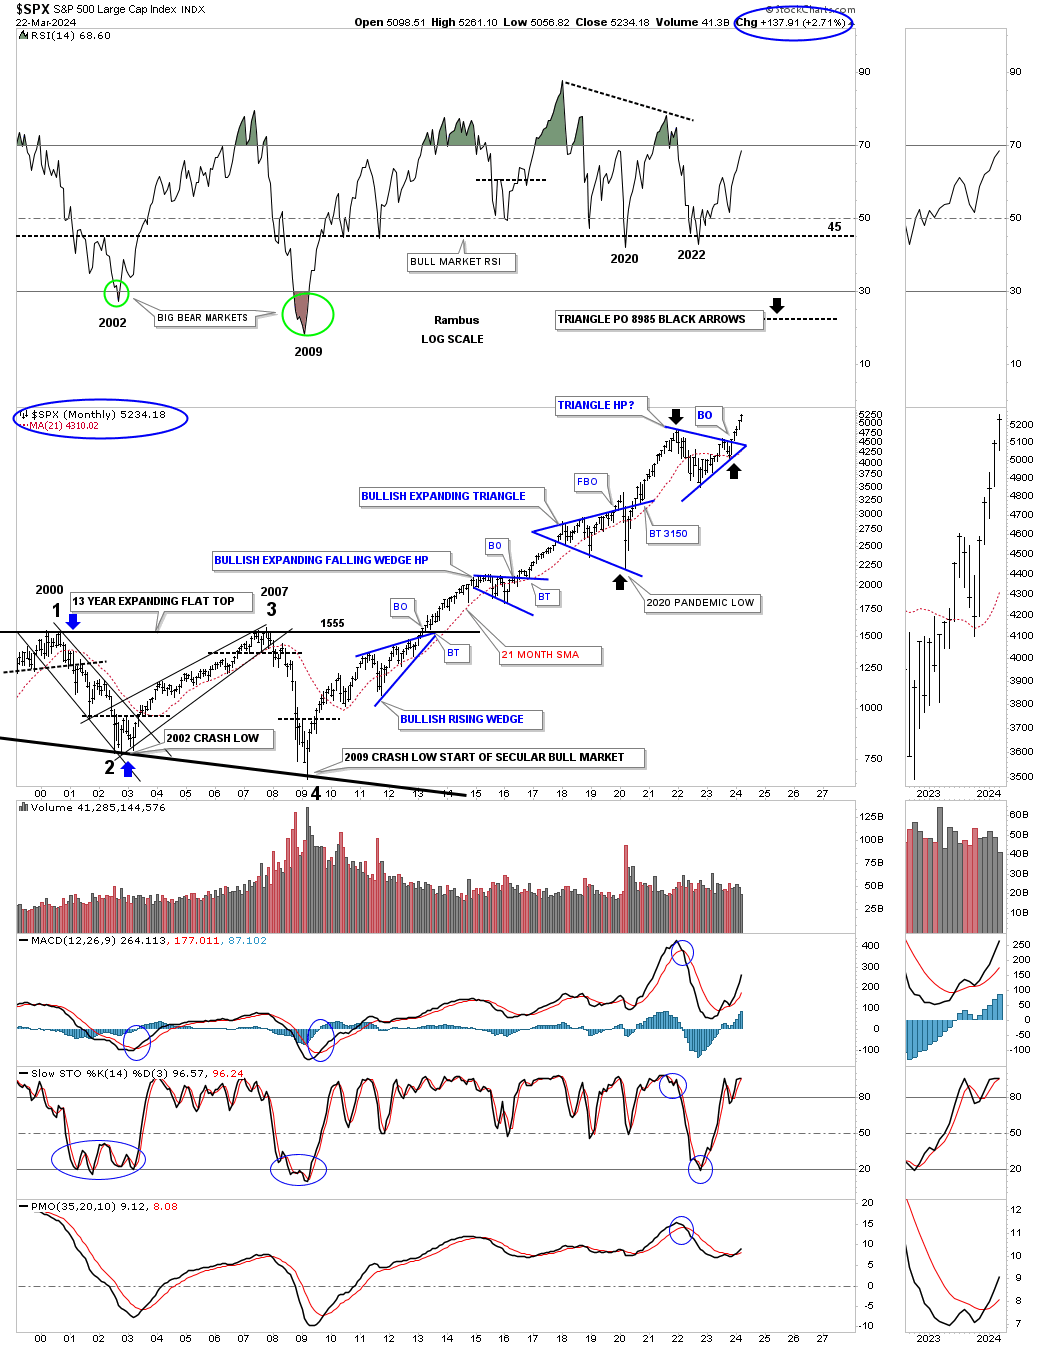
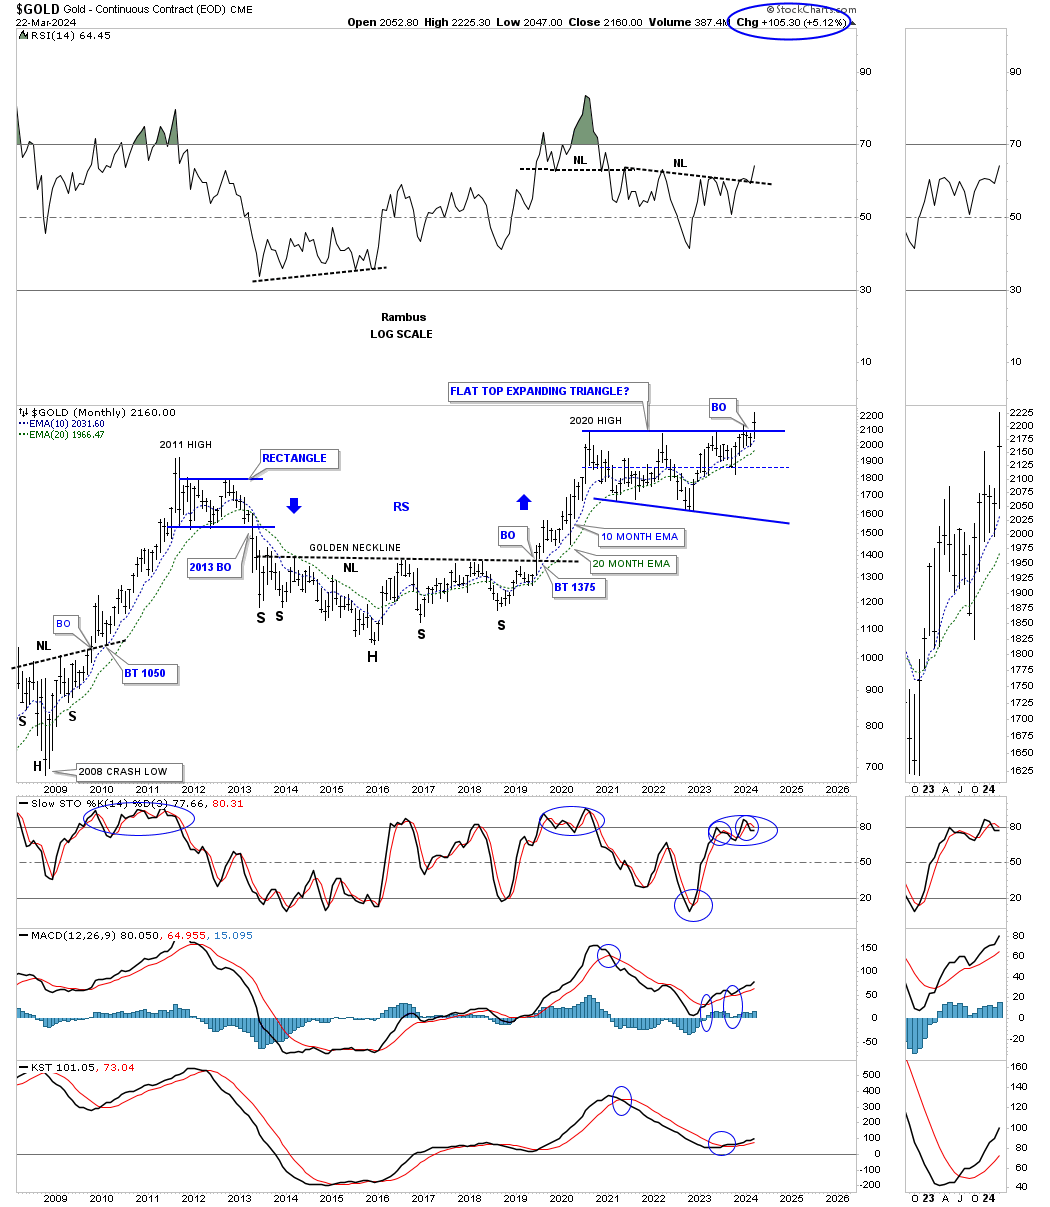
The flat top expanding triangle on the SPX above was a halfway pattern created when the 1974 to 2000 secular bull market ended, see secular bull market on the SPX secular bull market chart at the beginning of this post.
Gold’s 2020 bullish expanding flat top triangle is only 4 1/2 years in the making, but is still a large consolidation pattern. How many consolidation patterns will form on this monthly chart when all is said and done above the 2020 flat top expanding triangle?
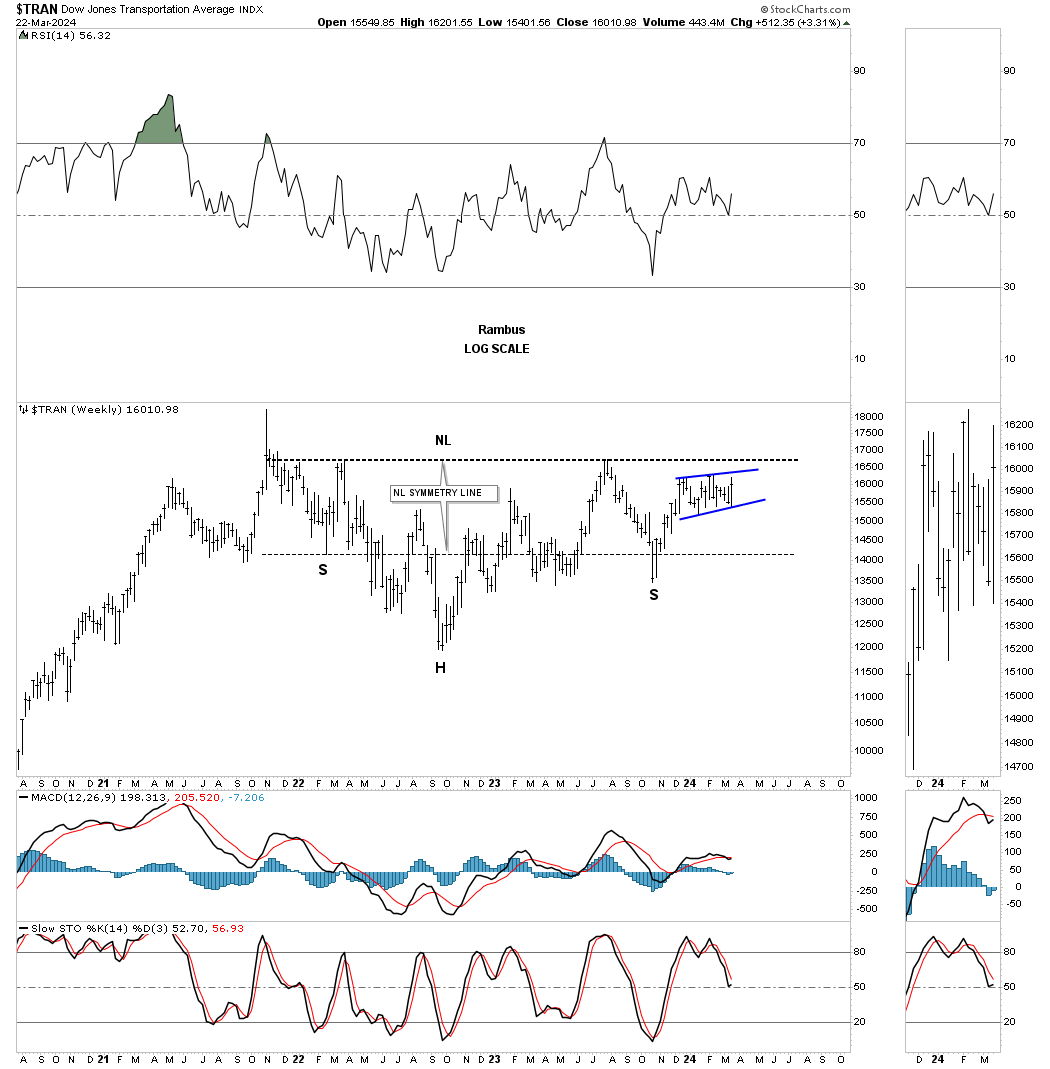
One area of the bull market in the stock markets that has been underperforming a bit, but is essential to the continuation of the bull market is the Transportation Average. Just like the H&S / triangle we looked at on the SPX the Transportation Average is also forming a similar double consolidation pattern. Below is a weekly chart showing the top rail of the 2021 triangle now being tested.
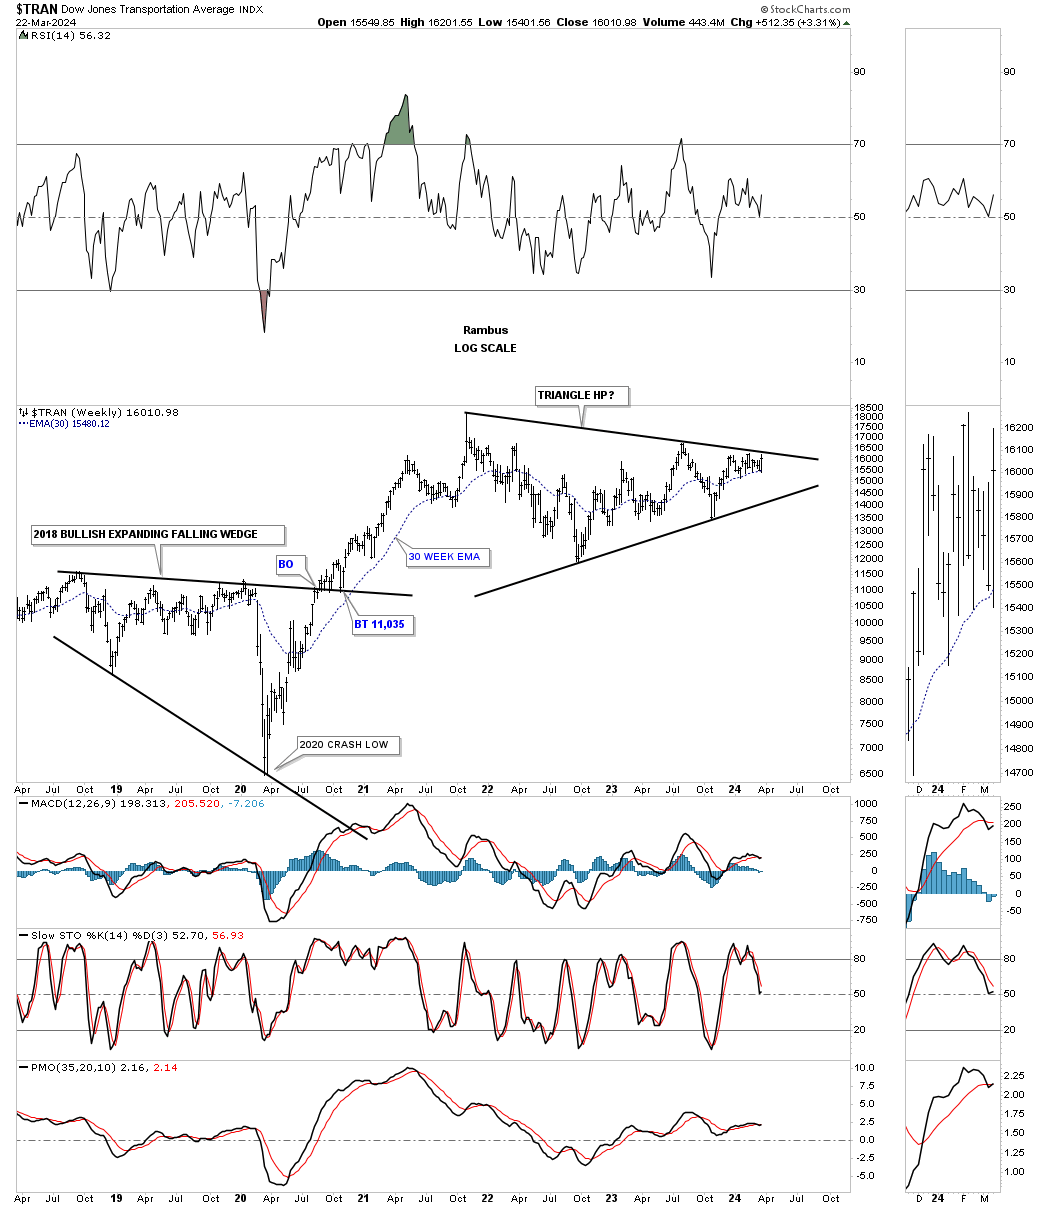
This weekly chart shows the possible H&S consolidation pattern with a small consolidation pattern forming just below the neckline which is usually a very bullish development.
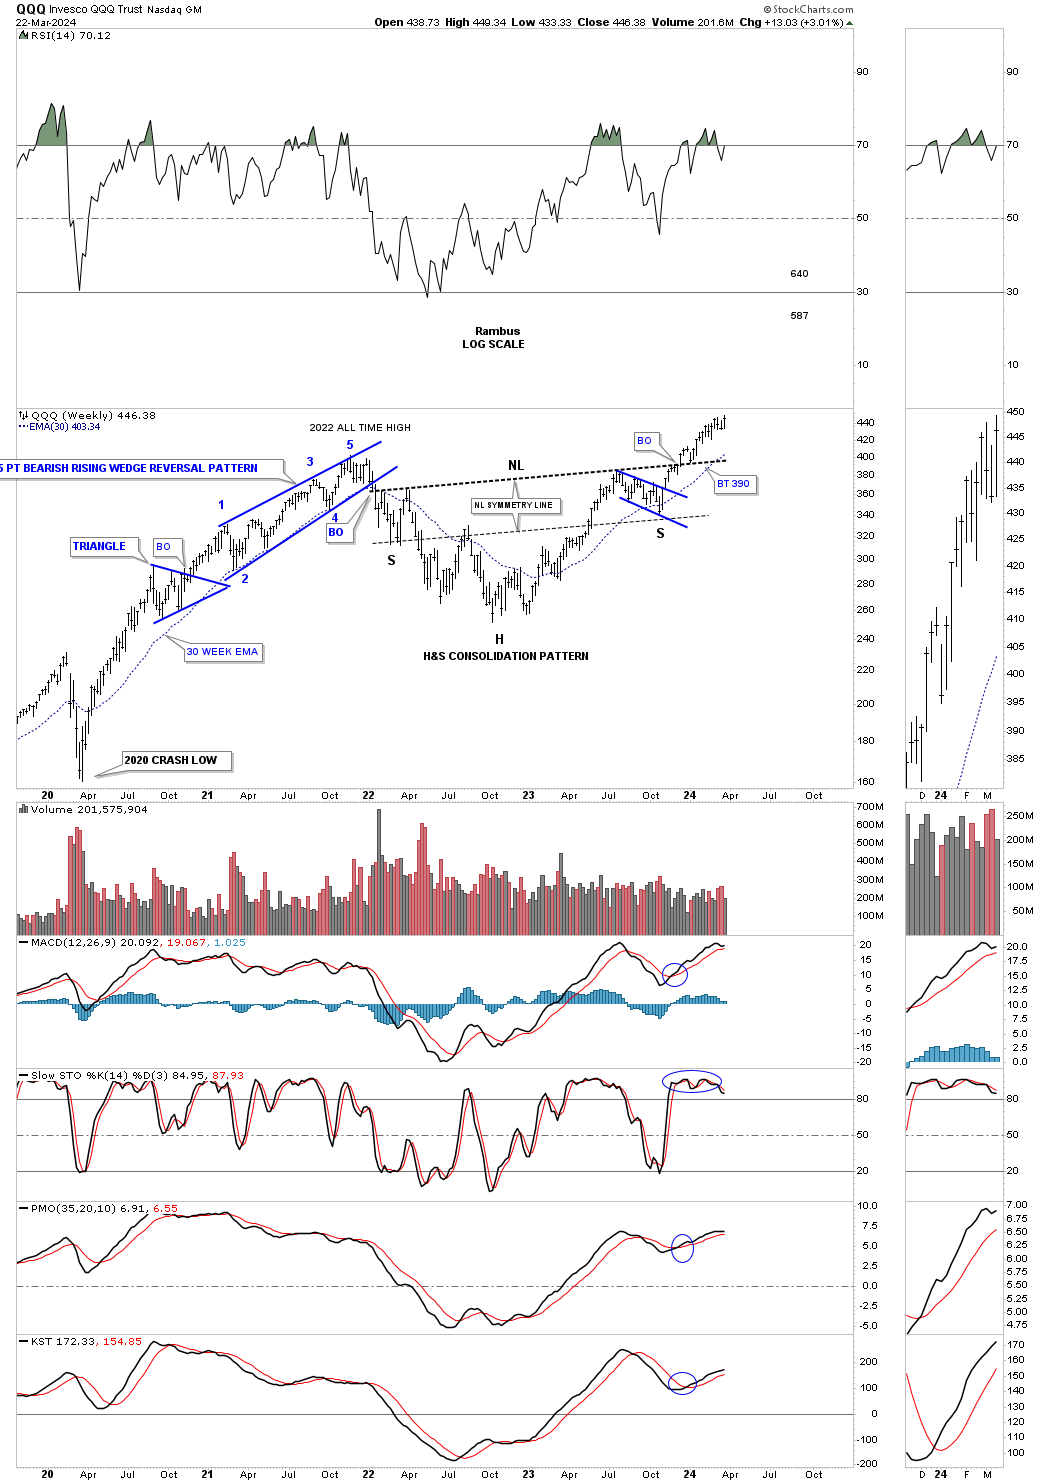
We’ve heard a lot lately about how the big cap tech stocks are beginning to fail and show weakness which could be true relative to some other areas like the XLF for instance. Looking at this weekly chart for the QQQ you can see after breaking out from the very symmetrical H&S consolidation pattern the price action closed at a new all time high on a weekly closing basis last week.
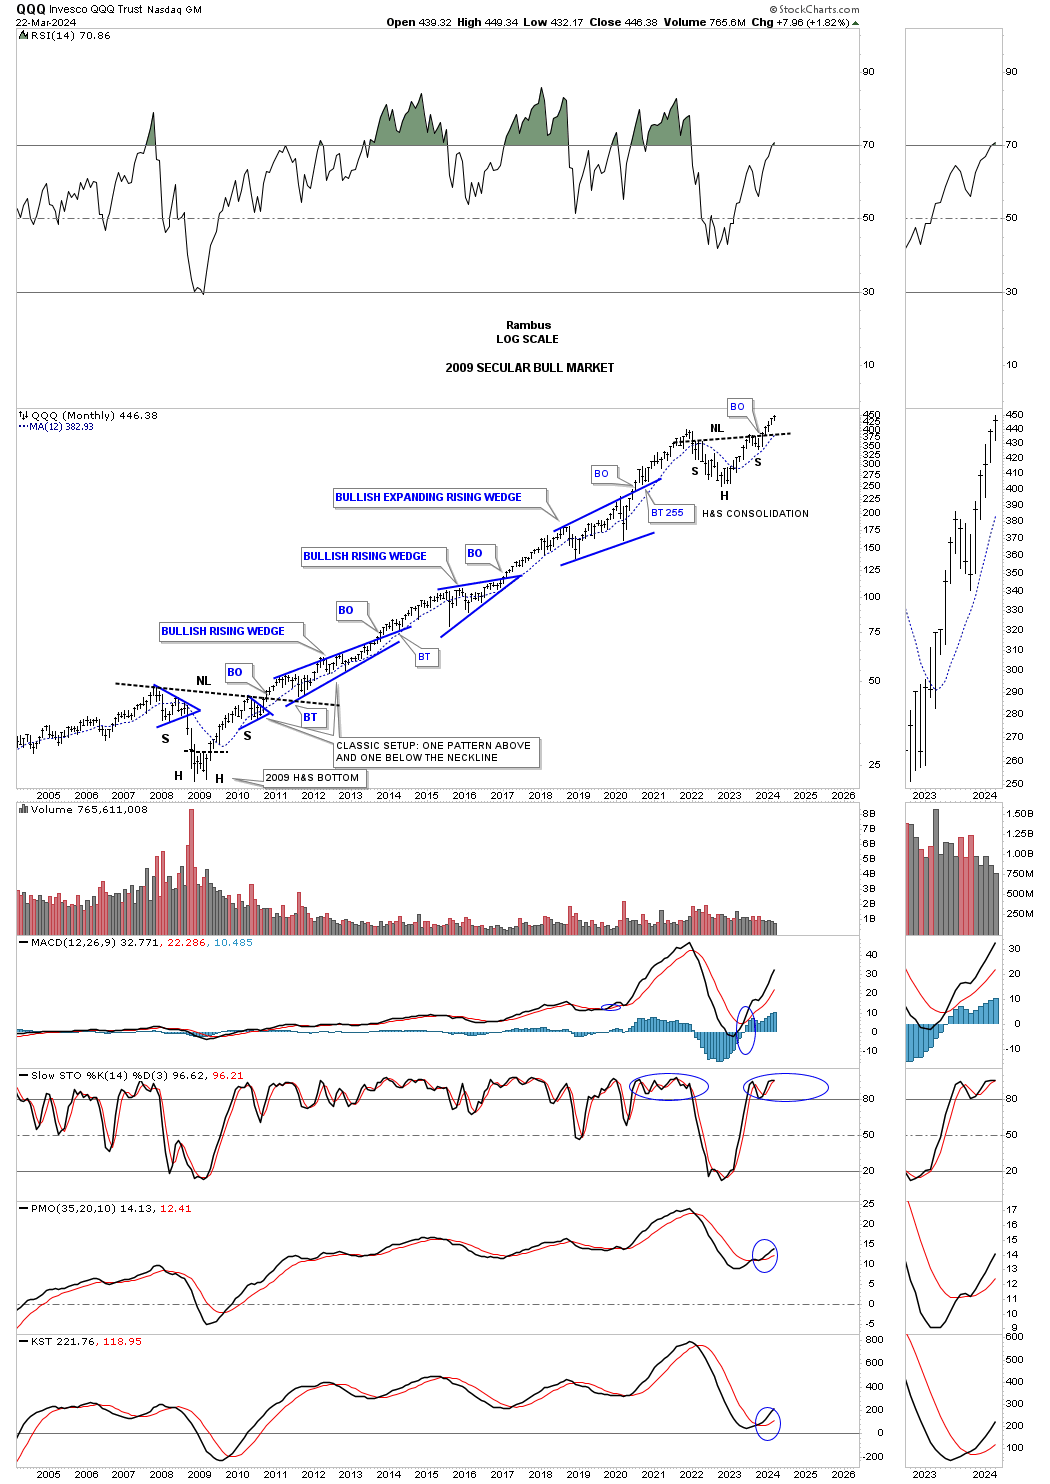
Earlier we looked at the 2009 secular bull market for the SPX which started at the 2009 low showing one consolidation pattern forming above the previous one. This monthly chart for the QQQ shows its beautiful secular bull market also starting at the 2009 low with one consolidation pattern forming above the previous one with the recent H&S consolidation pattern being the next pattern to take its turn to shine.
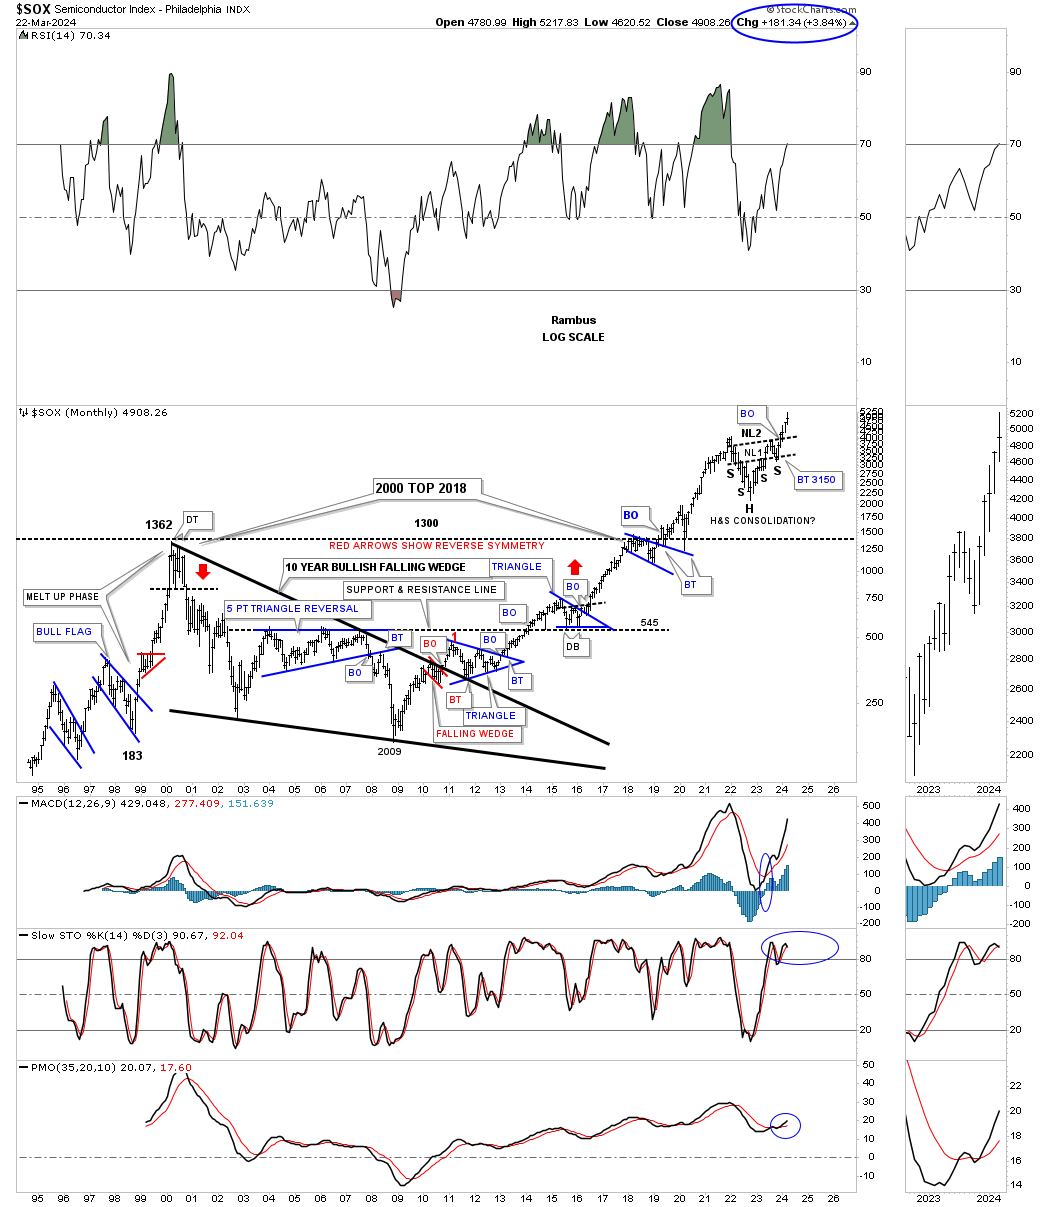
The SOX has been showing a bit of relative weakness over the last few weeks, but is far from looking bearish. As you can see the price objective for the double 2022 H&S consolidation pattern is up to the 6900 area which is about 3000 points from the breakout.
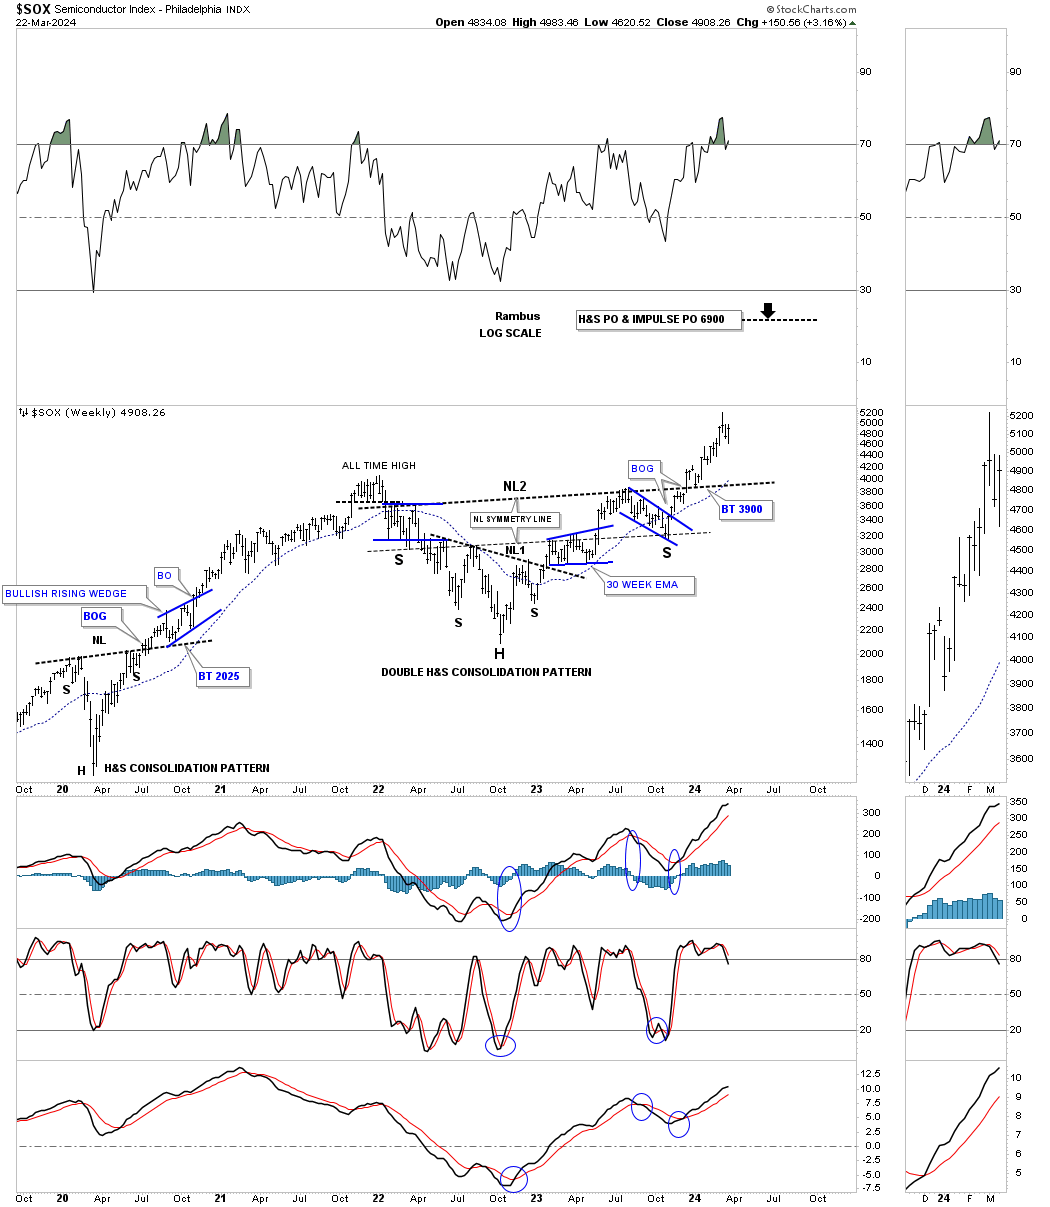
Through the years the SOX has been one of the best performing sectors for us in the Leveraged Trade Portfolio using the SOLX. This long term monthly history chart shows some beautiful Chartology which is beginning to look a bit congested over the years.
If you truly want to see what a melt up phase is all abut just look at the rally out of the 1998 bear flag low to the 2000 double top high. You can also see the secular bull market that started at the 2009 low with one consolidation pattern forming on top of the previous one with several of the blue consolidation patterns forming in and around important support and resistance lines.
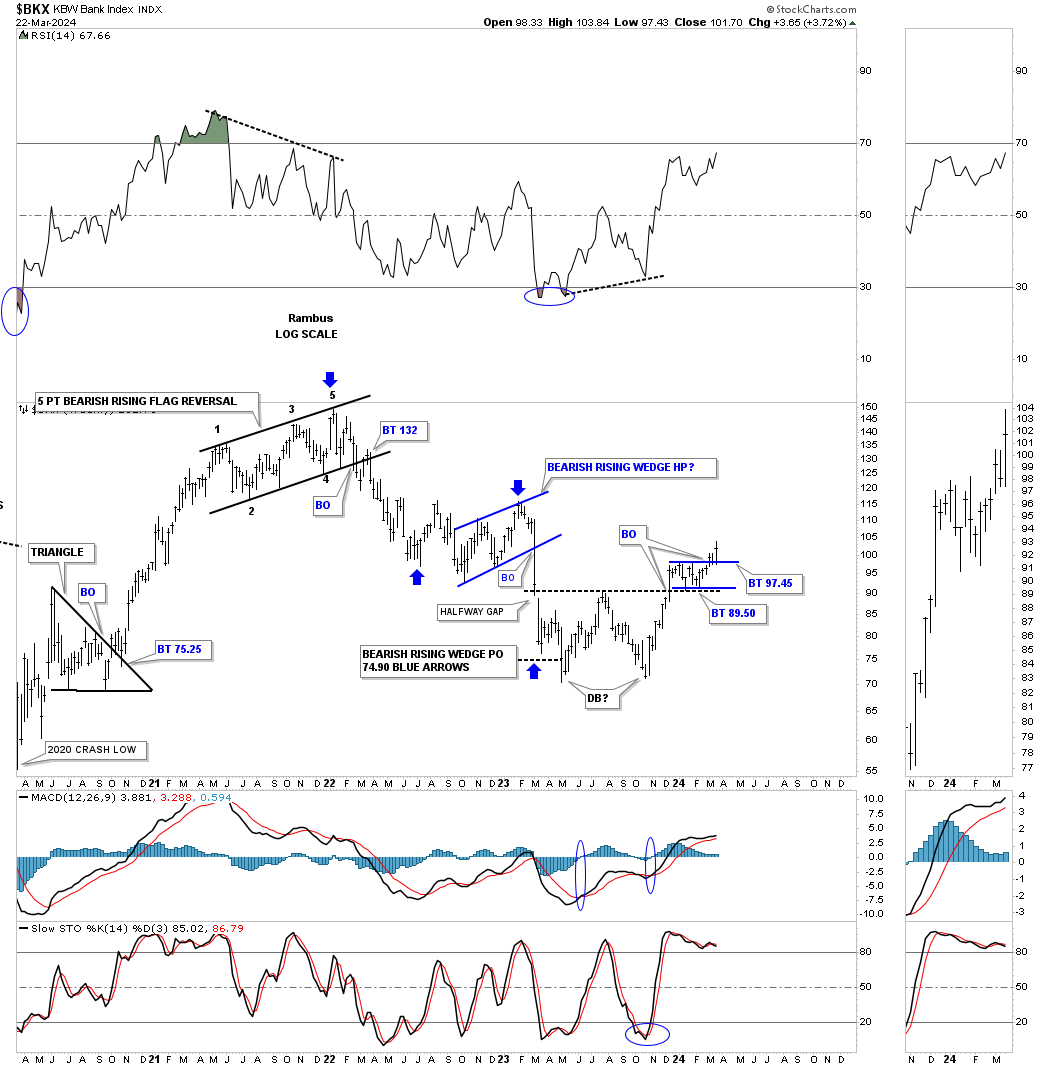
Its been awhile since we last looked at the BKX, Bank index, which I look at everyday and have been following the price action on this weekly chart. In 2023 the price action formed a large double bottom with a nice clean breakout. I’ve been waiting on the backtest to complete which looks like the case now which ended up being the small blue rectangle.
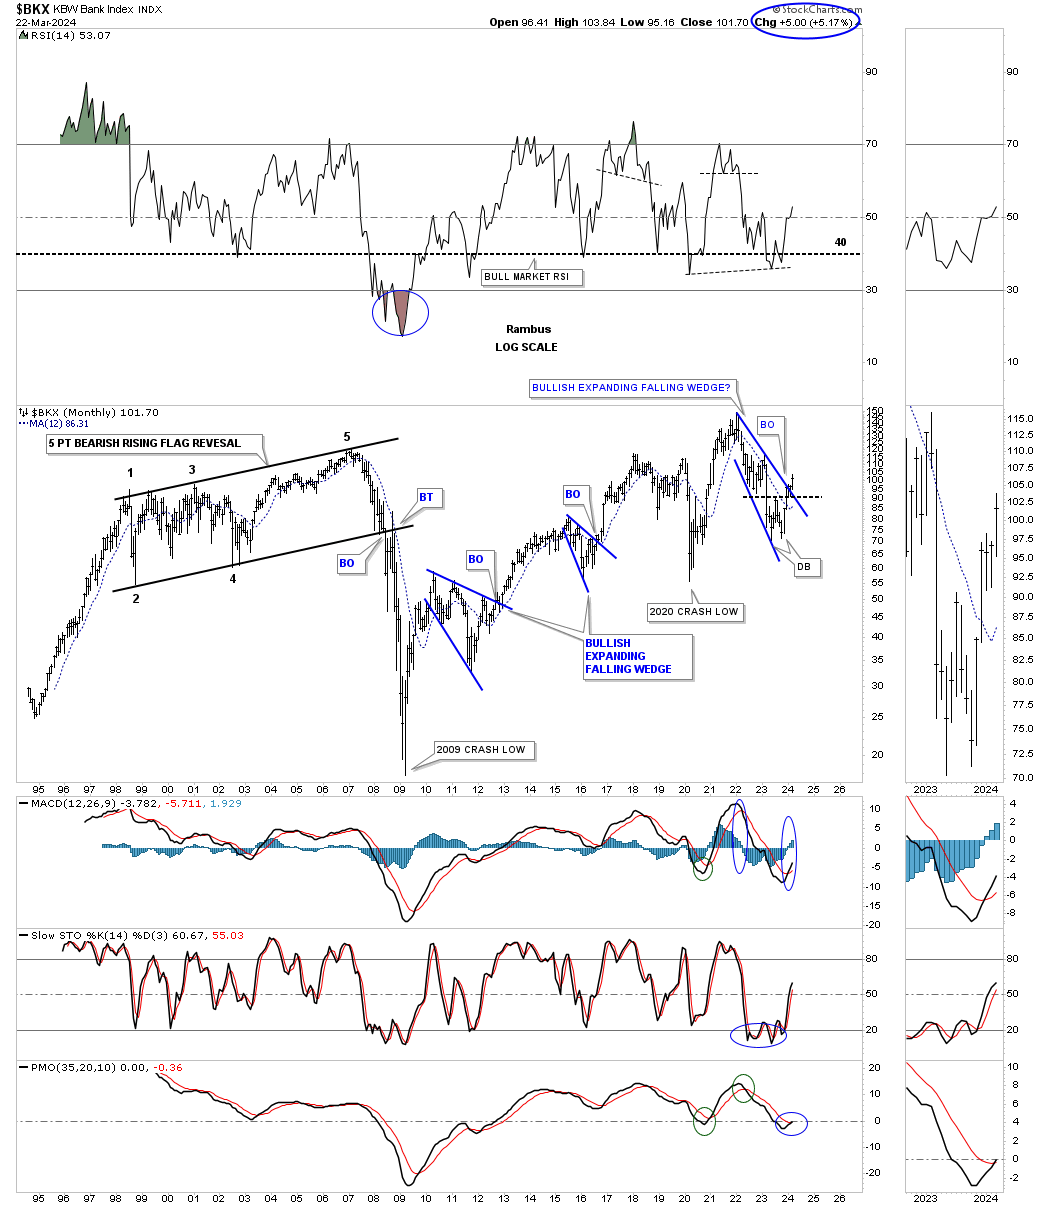
Putting that double bottom into perspective on this long term monthly chart you can see it formed at the bottom of the blue expanding falling wedge with a breakout above the top rail this month. For whatever reasons the BKX likes to form bullish expanding falling wedges as you can see from the previous two that have formed since the 2009 crash low.
Note that massive black 5 point bearish rising flag which gave me a big clue that things were going to get very bad during the 2008 – 2009 financial and housing crash.That was one of those big patterns that you could spot a mile away, but had to have patience to see it come to fruition.
Sticking with the financial theme, below is a daily chart for the XLF which built out the very symmetrical 6 point triangle consolidation pattern which I’m viewing as a halfway pattern taken from the 2020 crash low.
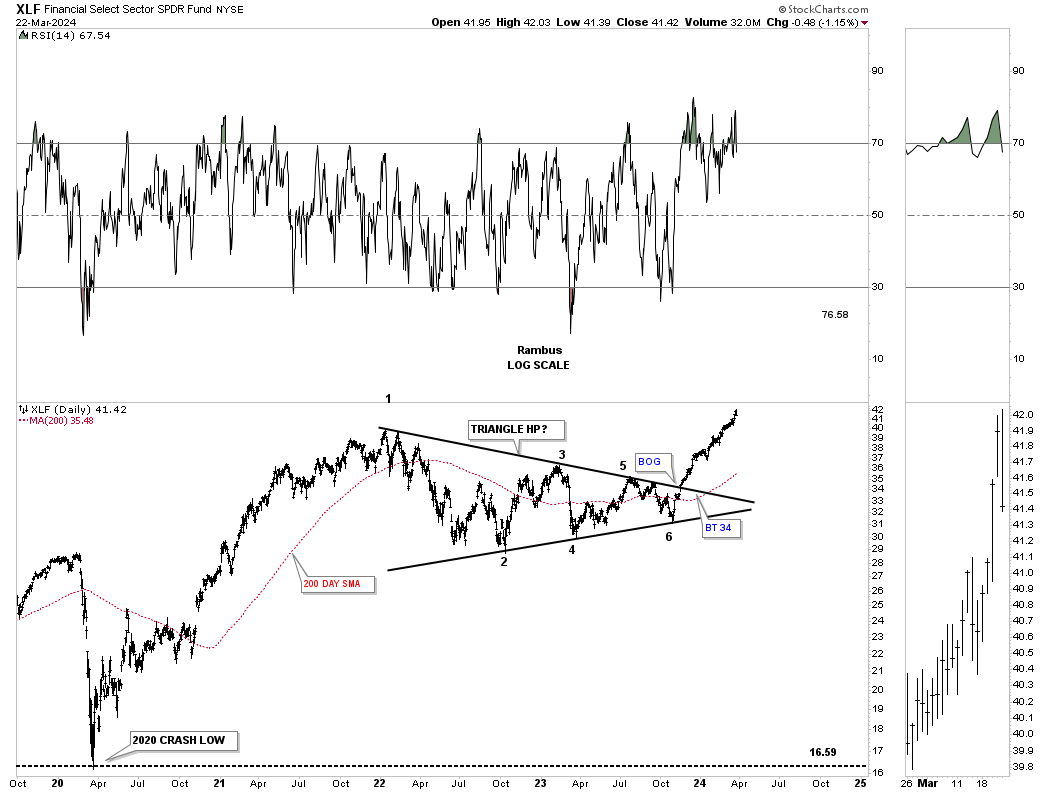
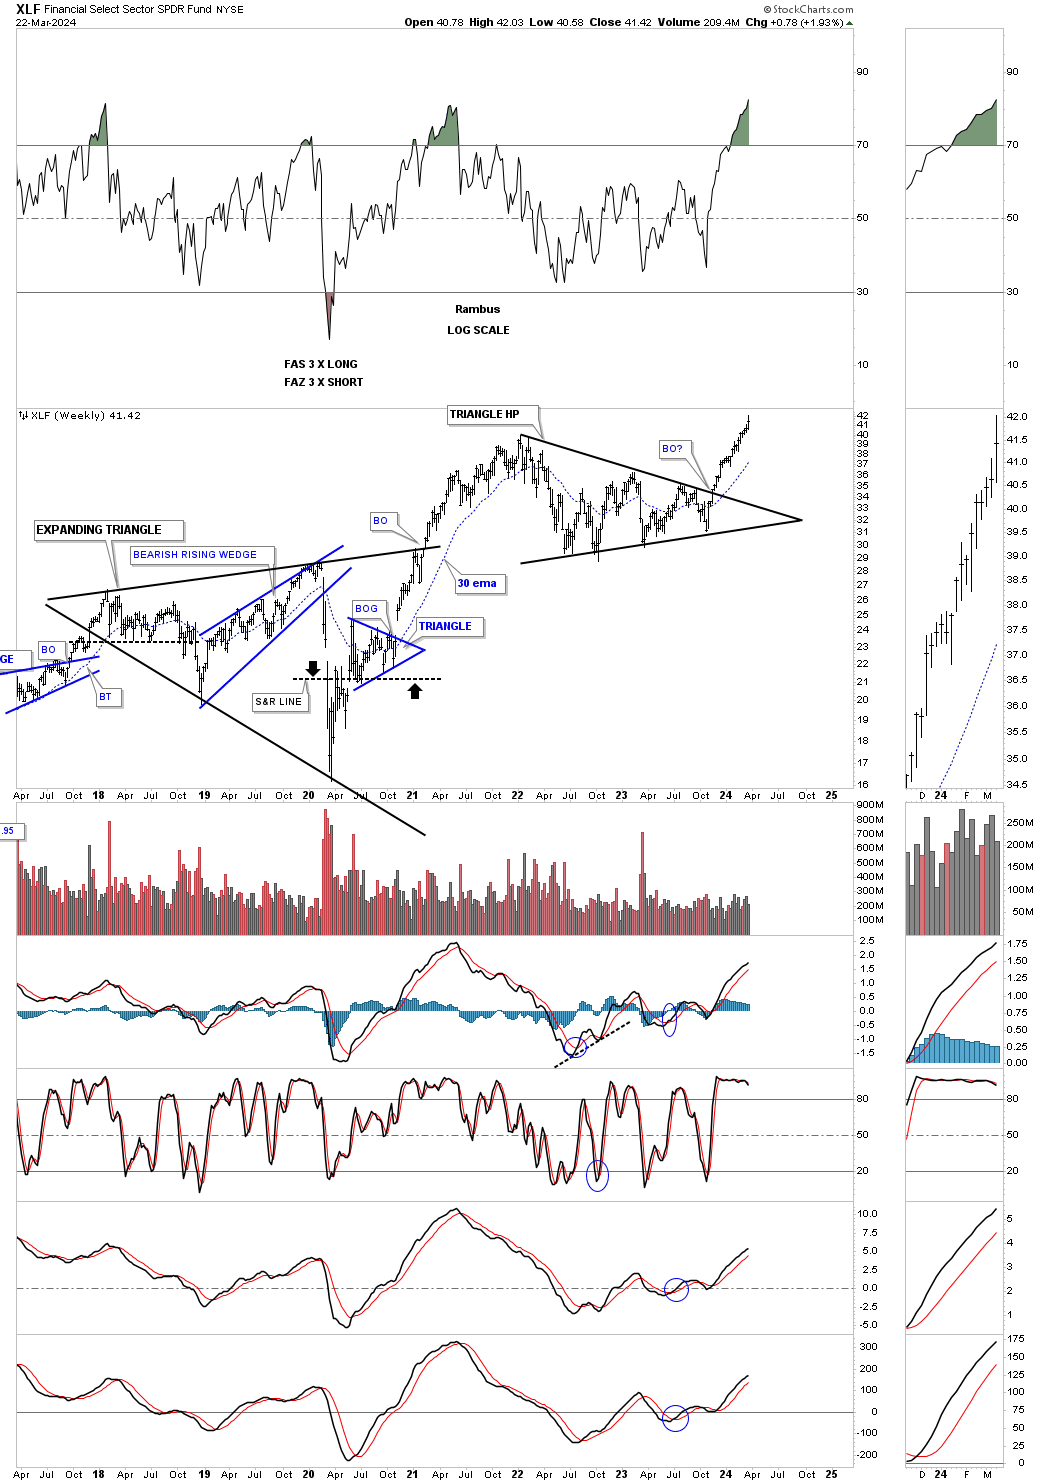
The weekly chart showing a new all time high being made.
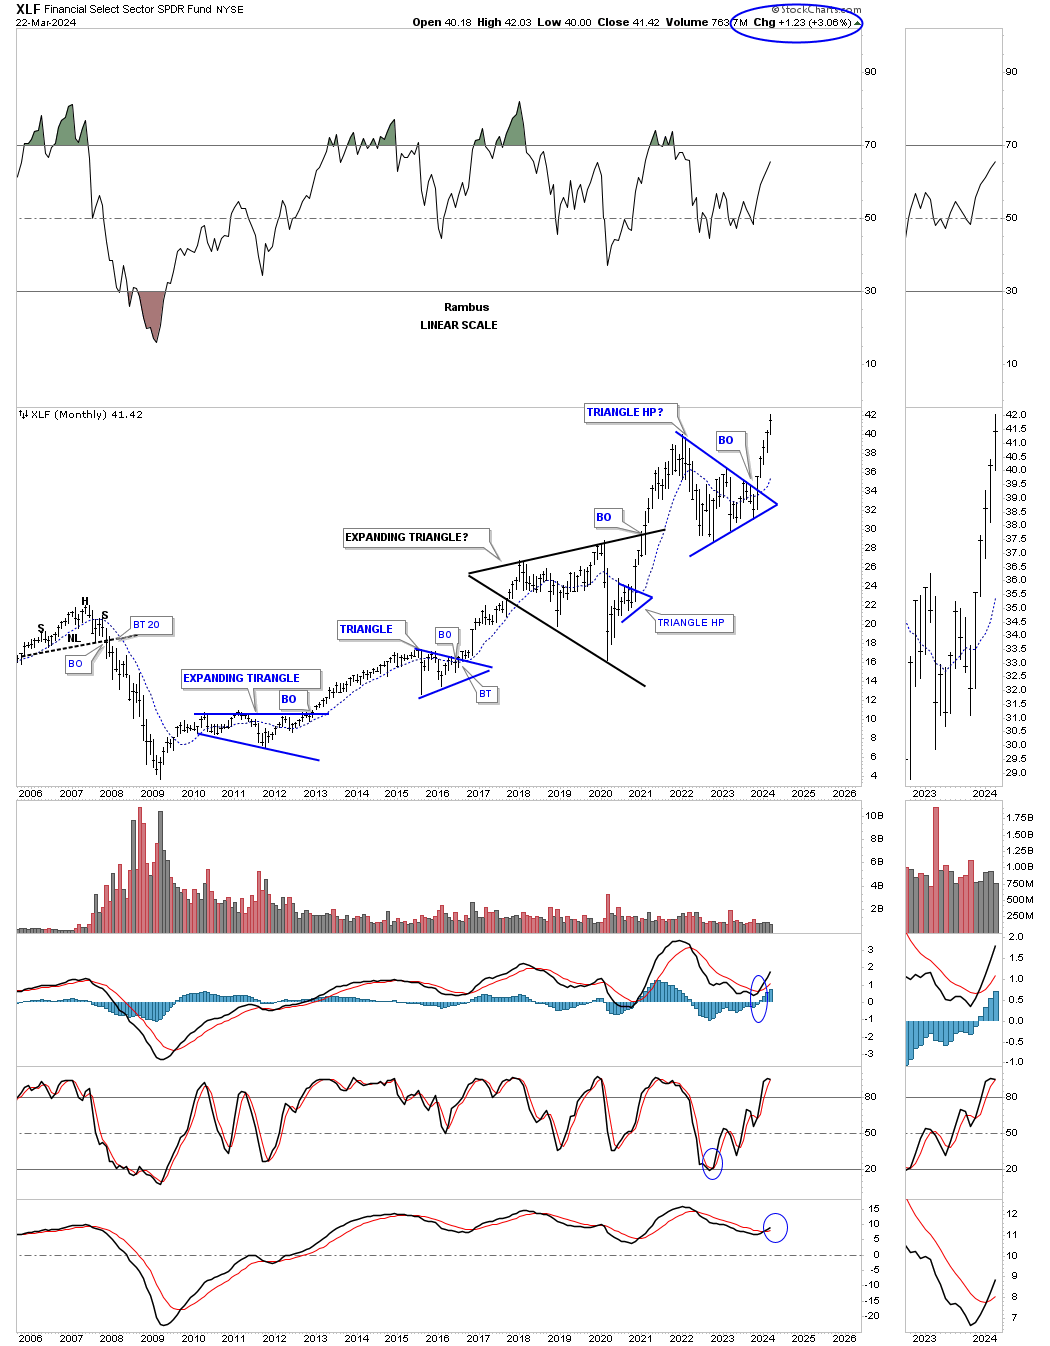
The long term monthly chart for perspective.
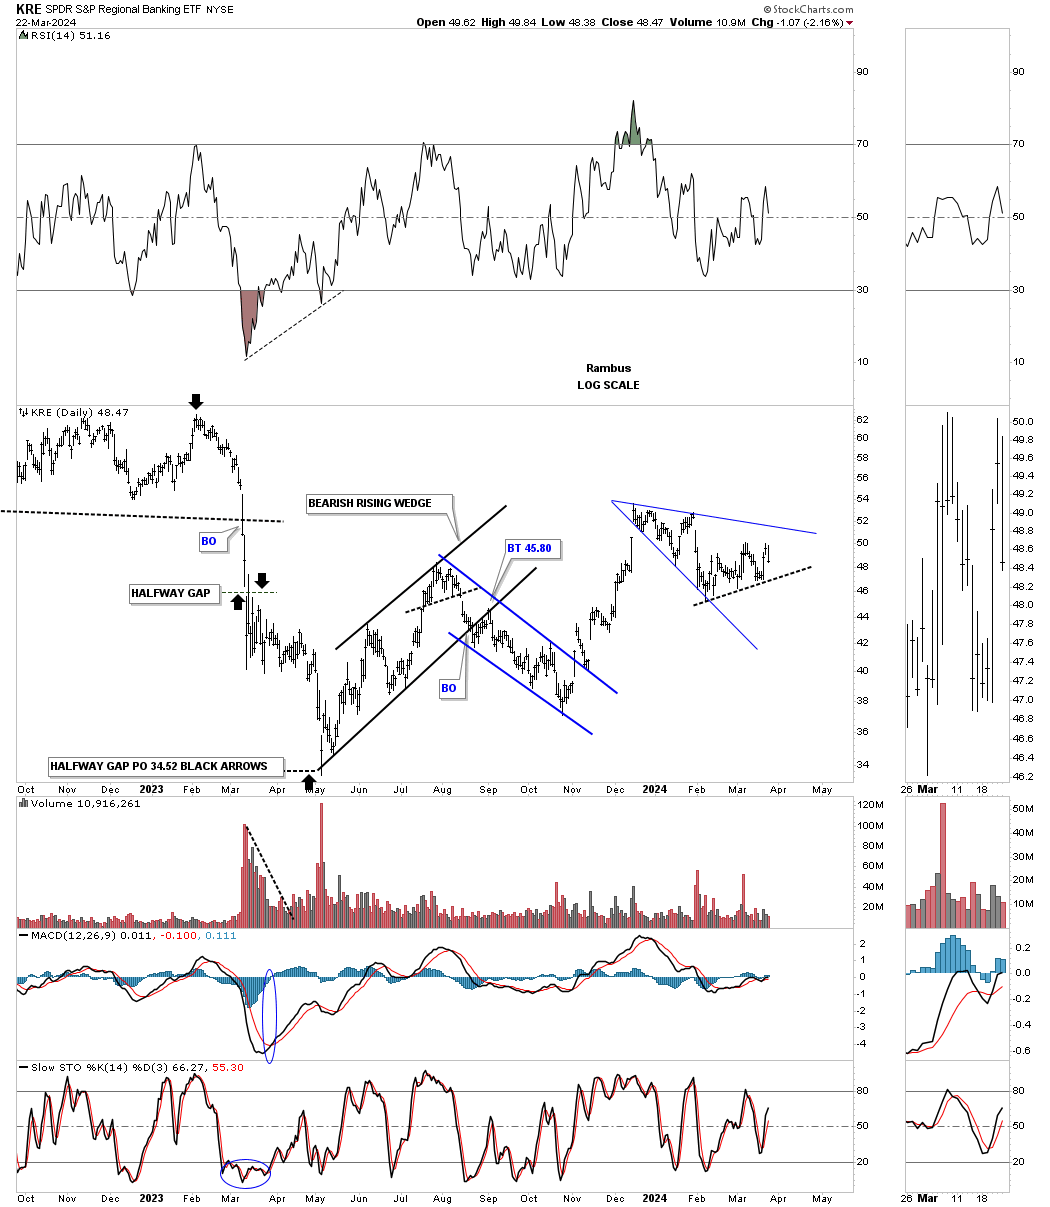
One area within the financial area that is still not behaving well is the KRE, Regional Banking etf, which was the catalyst for the 2023 correction in the stock markets.
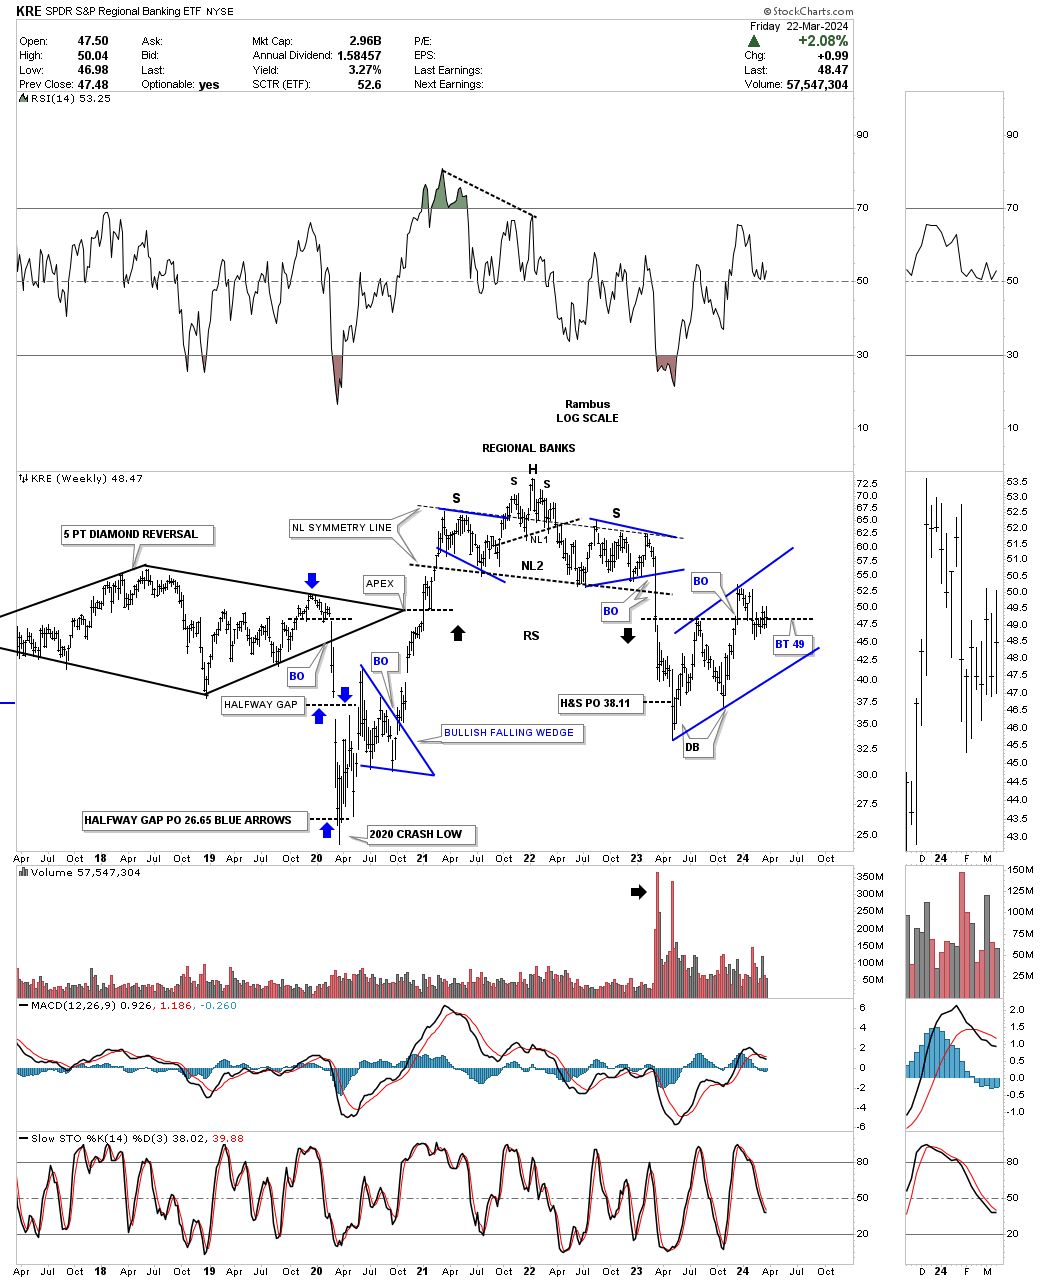
If you recall we were following this weekly chart for the KRE which showed the breakout from the double H&S top which actually led to the regional banking crisis.
I’m still amazed by some of the chart patterns, like the double H&S top in this case for instance, how they can see a year or two into the future before a significant decline or in a bull case, bull market rally takes hold.
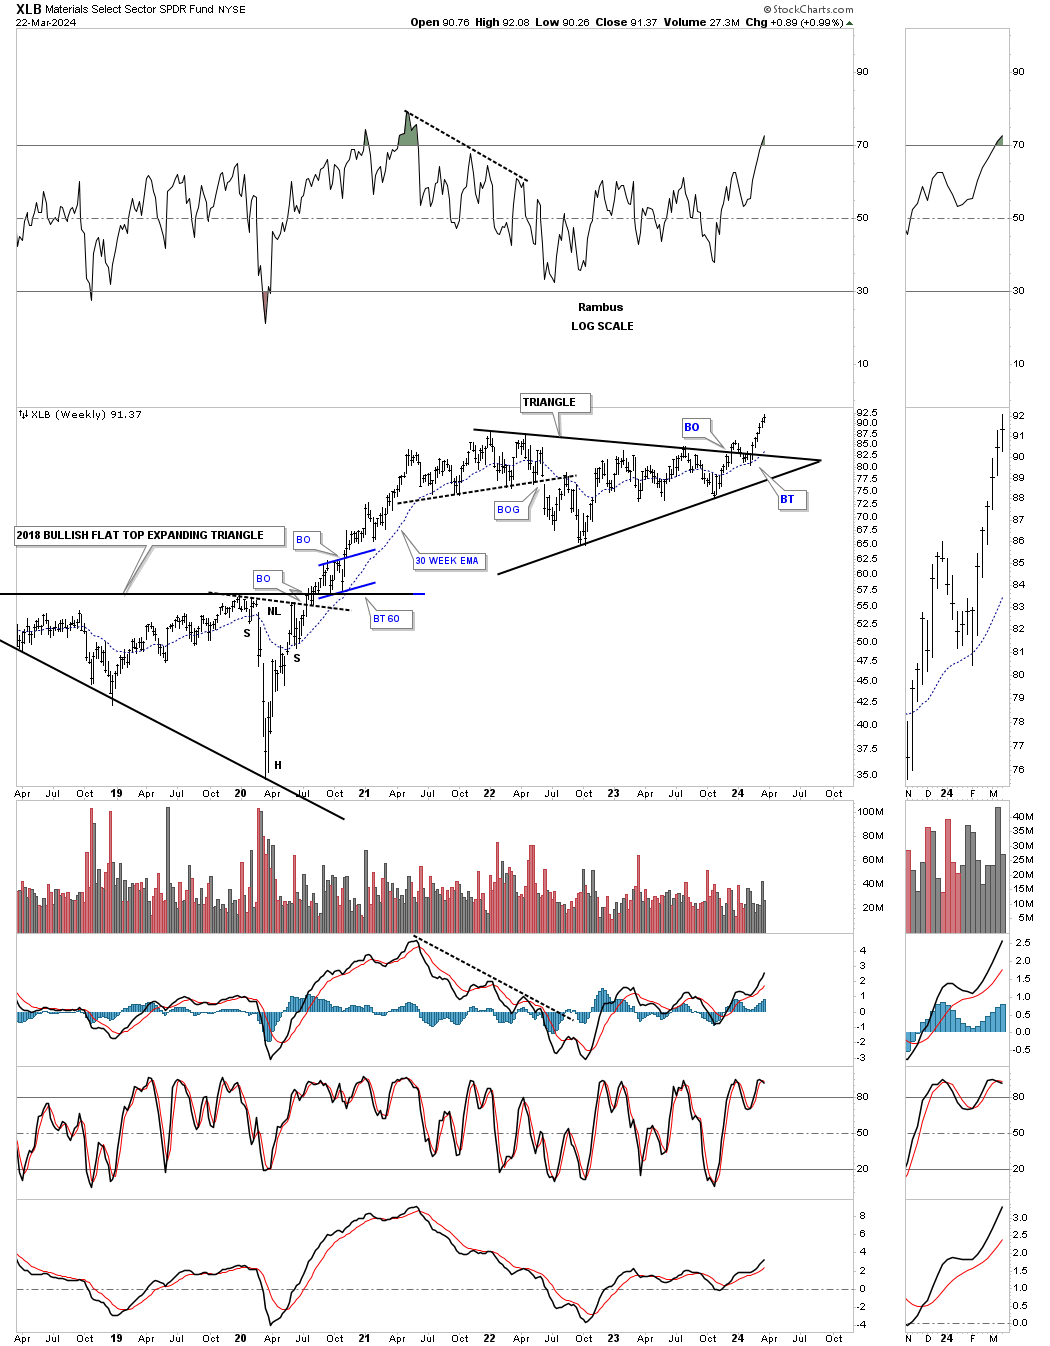
An area that has just broken out from a two year triangle consolidation pattern is the XLB, Basic Materials fund. It had a sloppy backtest but the 30 week ema held support nicely.
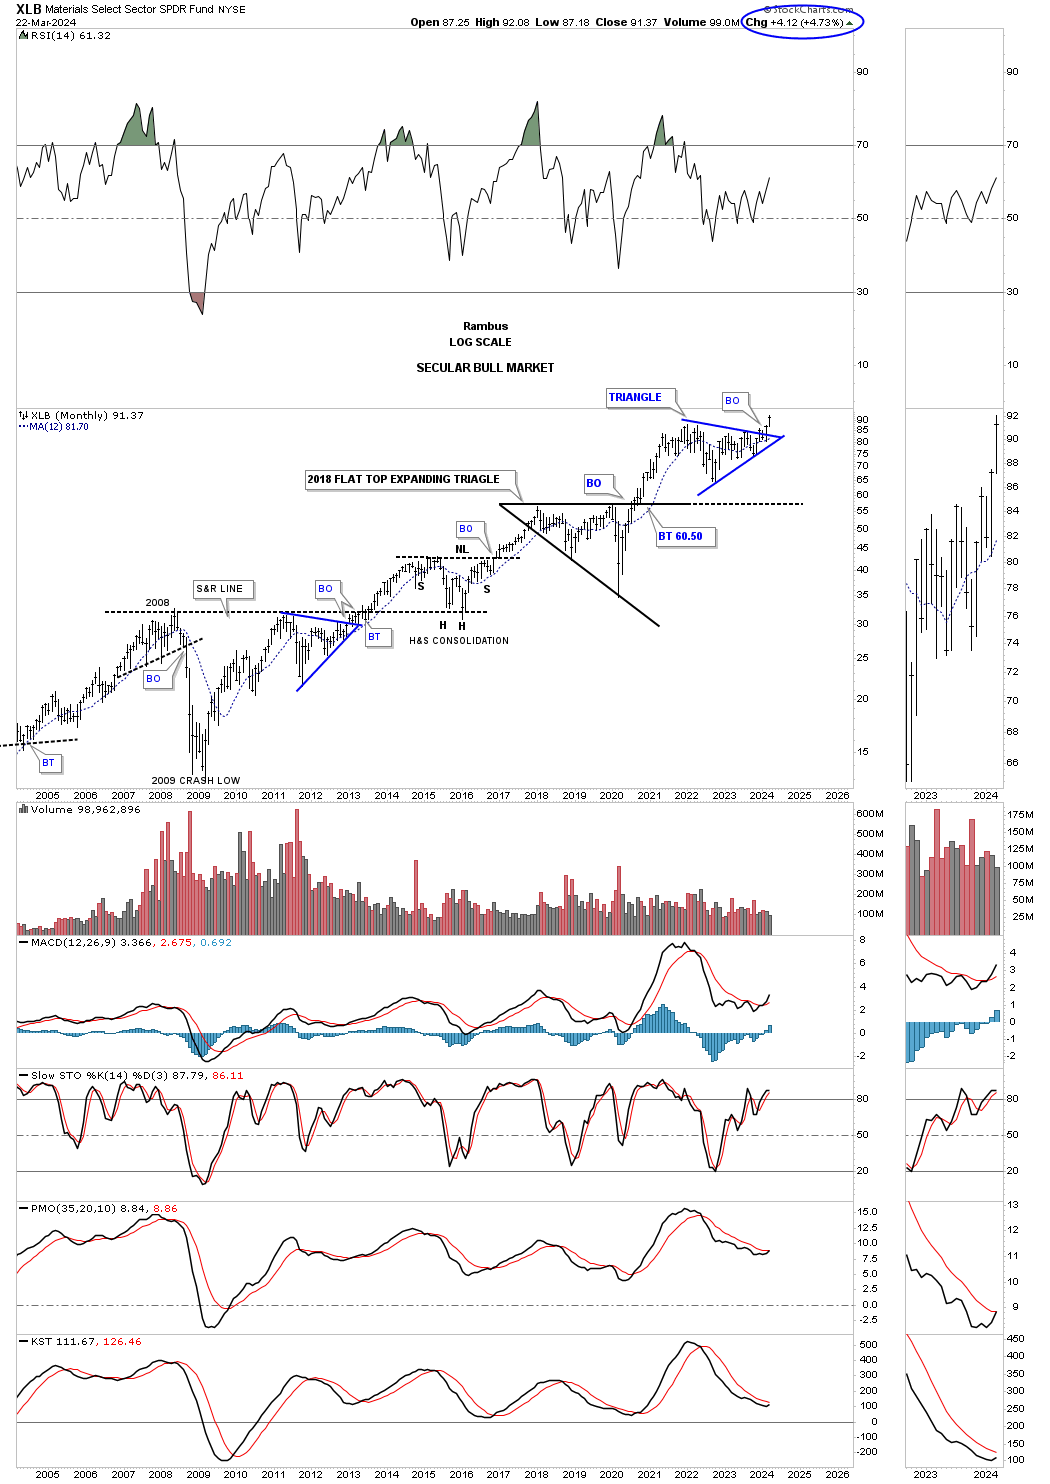
XLB’s monthly chart showing its secular bull market with the next consolidation pattern beginning the next impulse move higher.
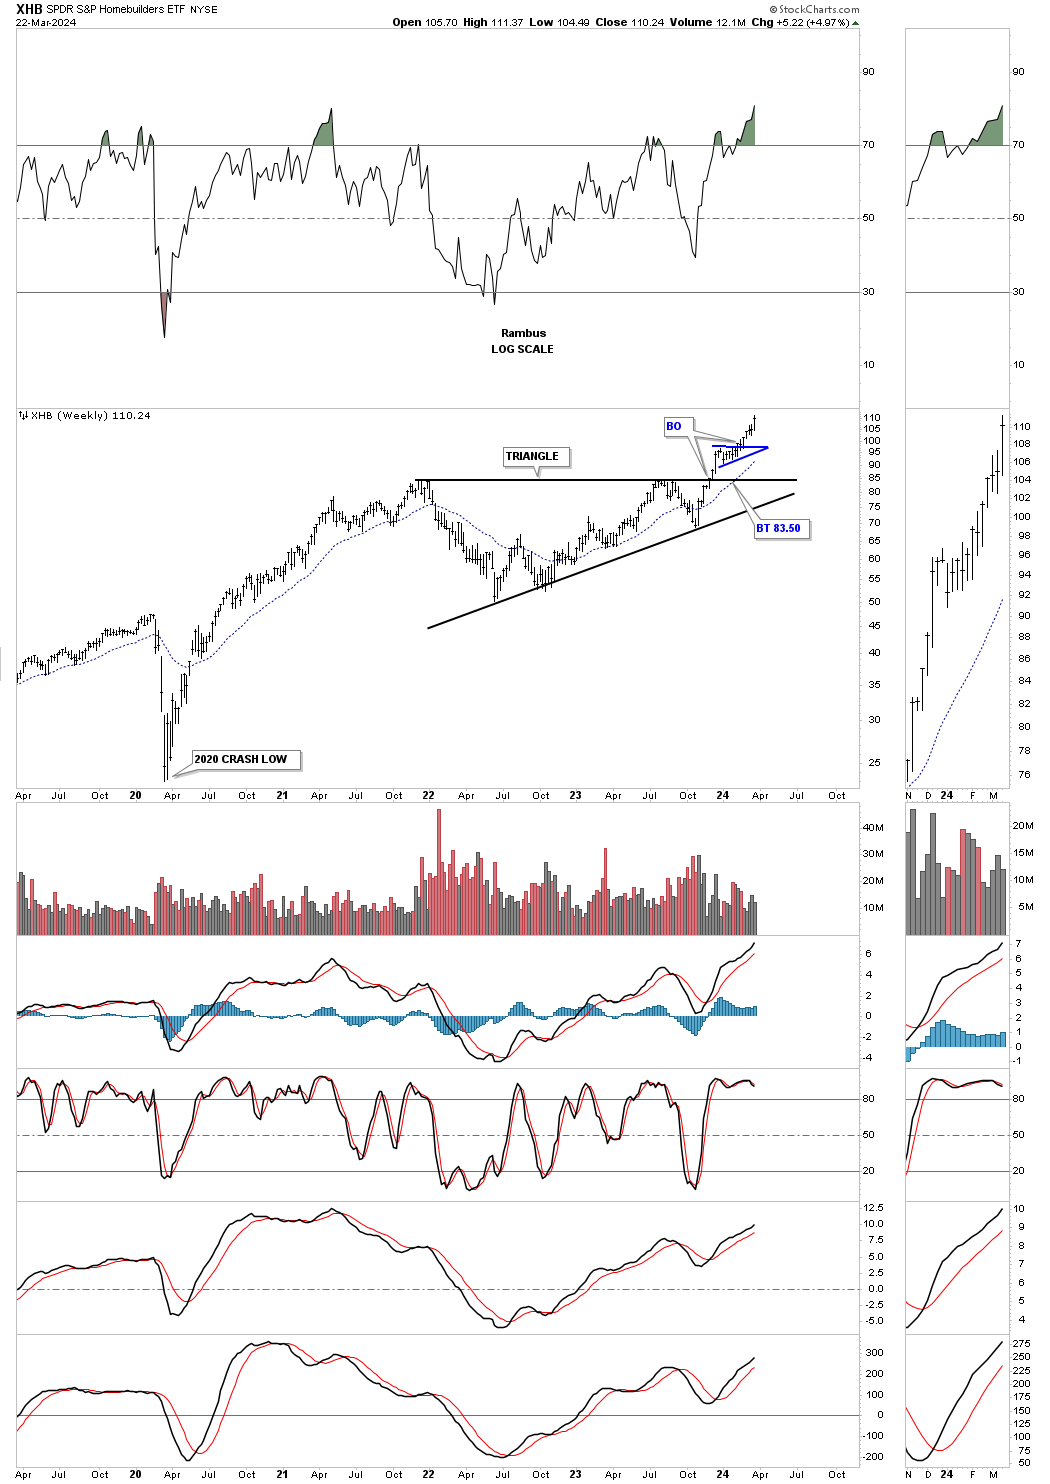
One of the stronger areas which I have pointed out in the last several months is the XHB, Homebuilders, which was one of the first sectors within the stock markets to breakout from its 2 year triangle consolidation pattern. I know it didn’t make much sense at the time of the breakout, but it was the Chartology looking ahead to what was possible.
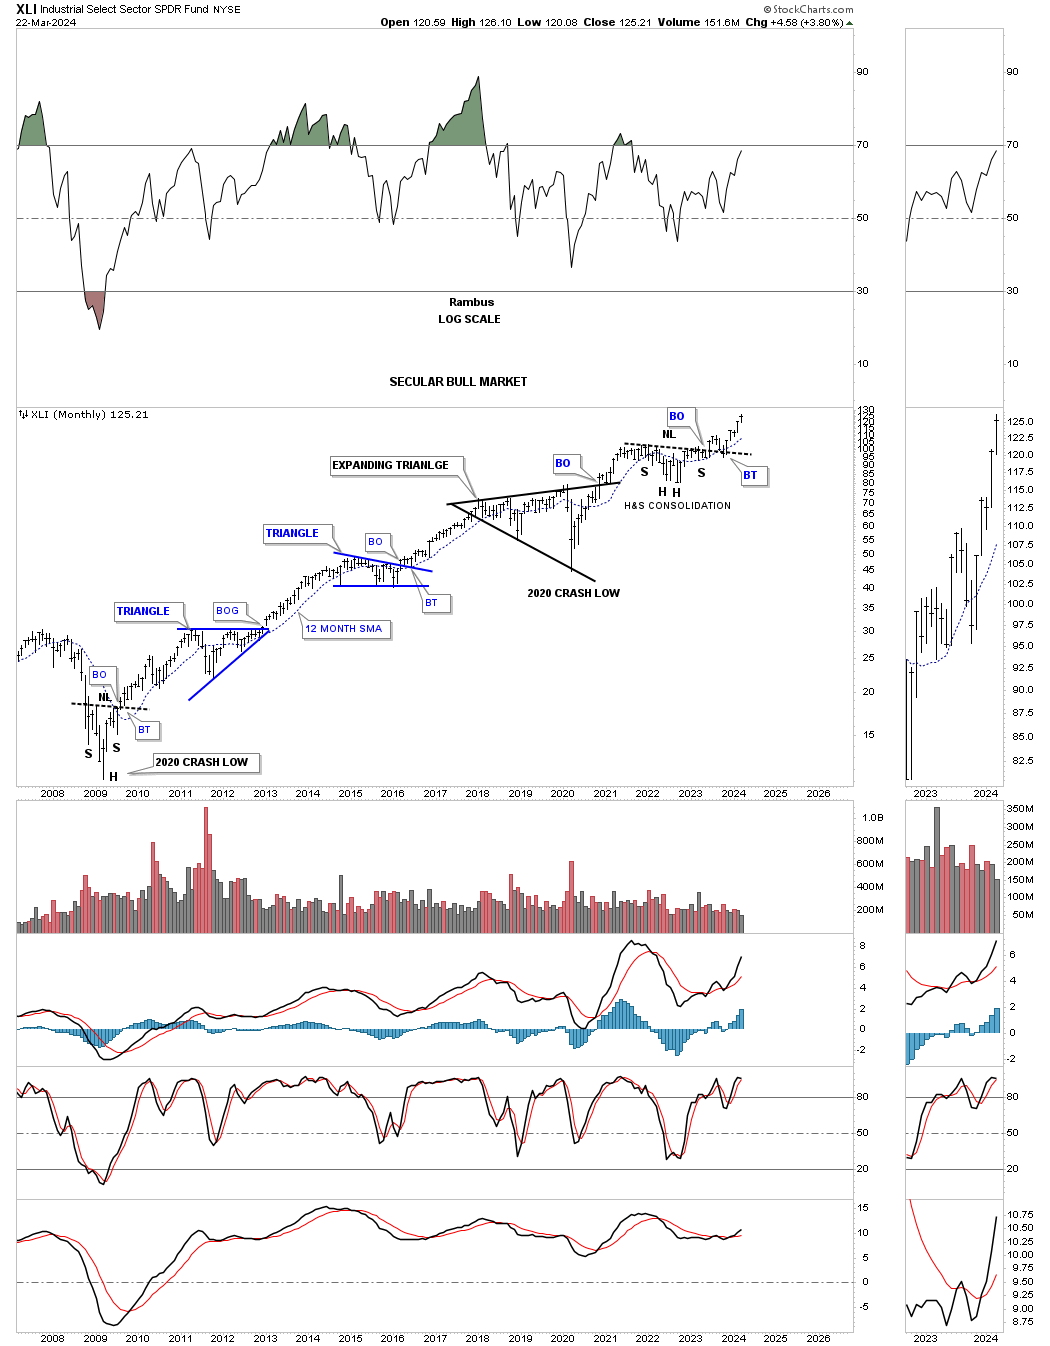
Next is the XLI, Industrial fund, which has been one of the strongest area in the markets after it broke out from the bullish rising wedge.
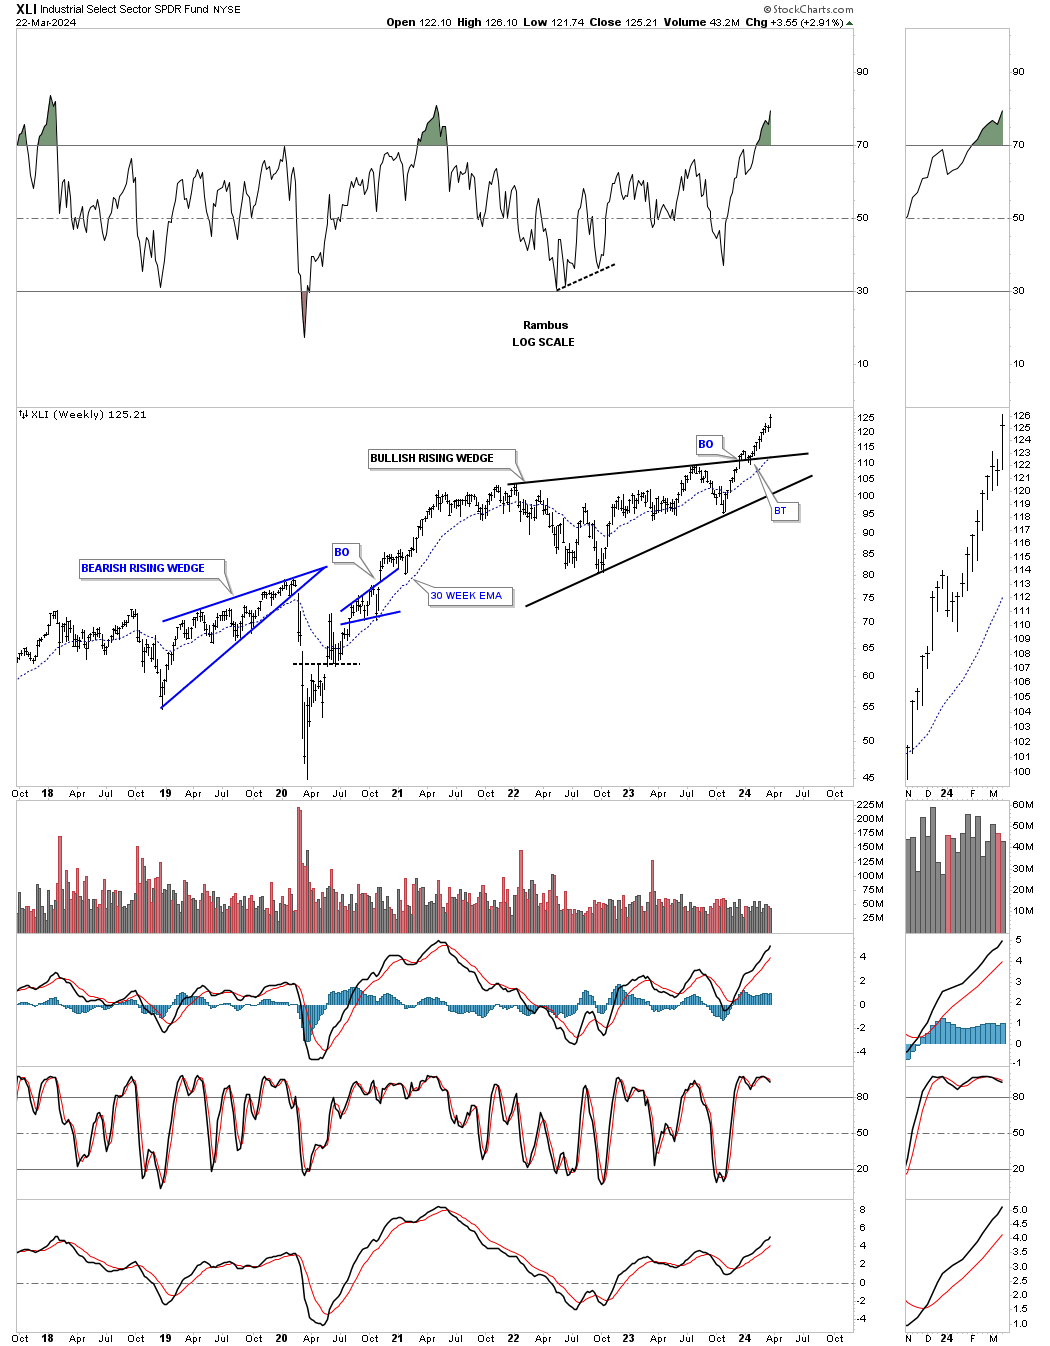
XLI also has a double consolidation pattern which is made up of the bullish rising wedge on the weekly chart above and the H&S consolidation pattern as shown on this monthly chart below.
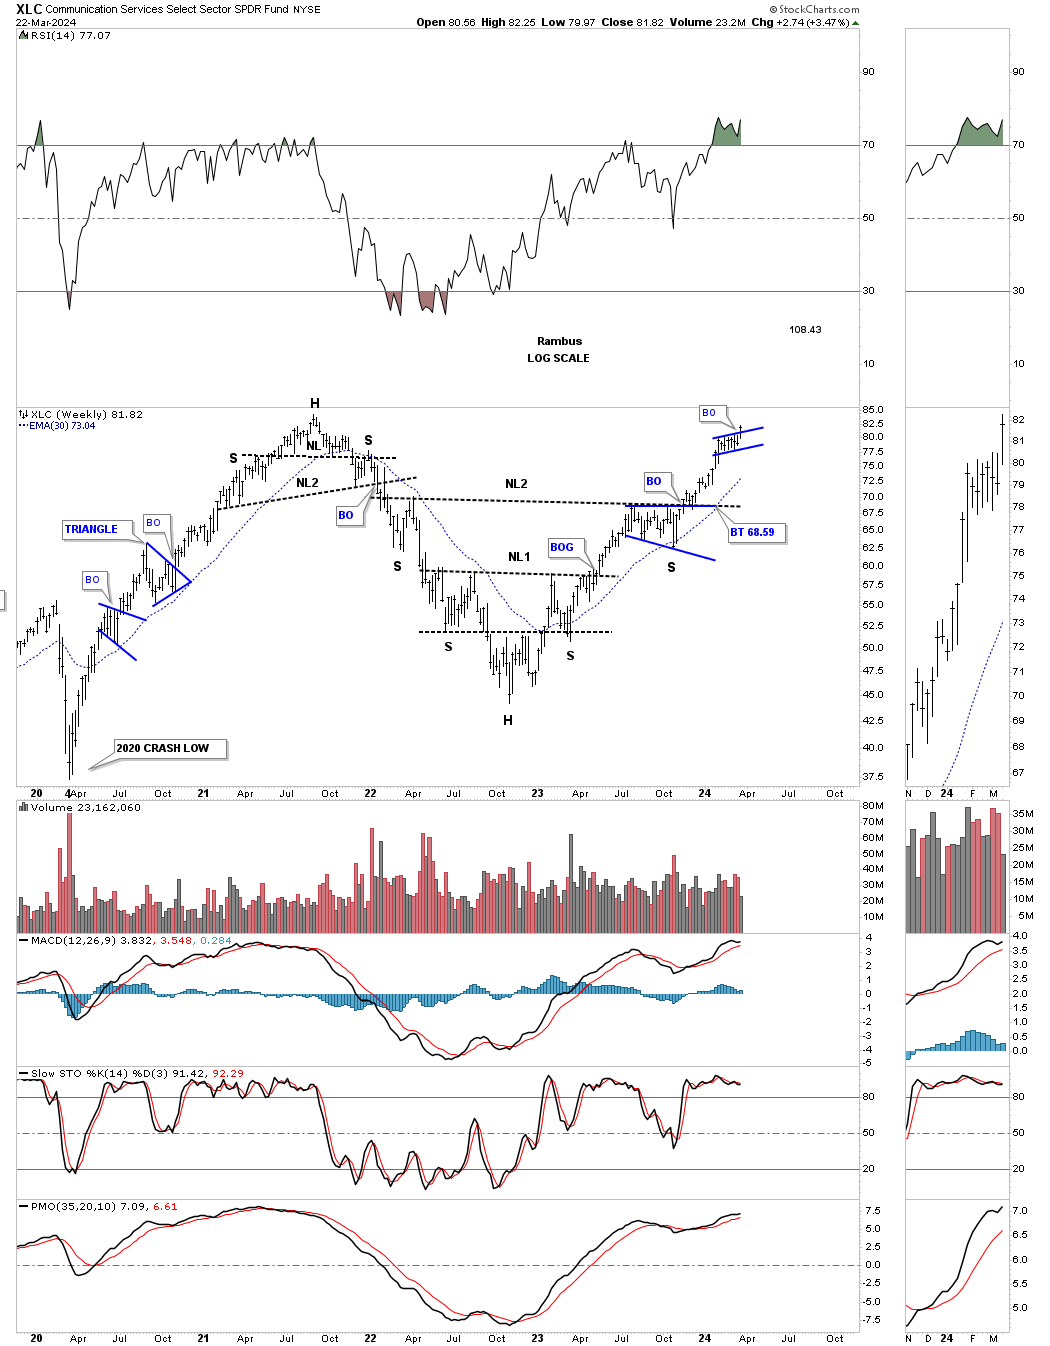
XLC, Communication services fund, has just broken out from a small blue bullish rising flag which formed at the previous 2021 all time high area which is strongly suggesting new all time highs are coming sooner rather than later.
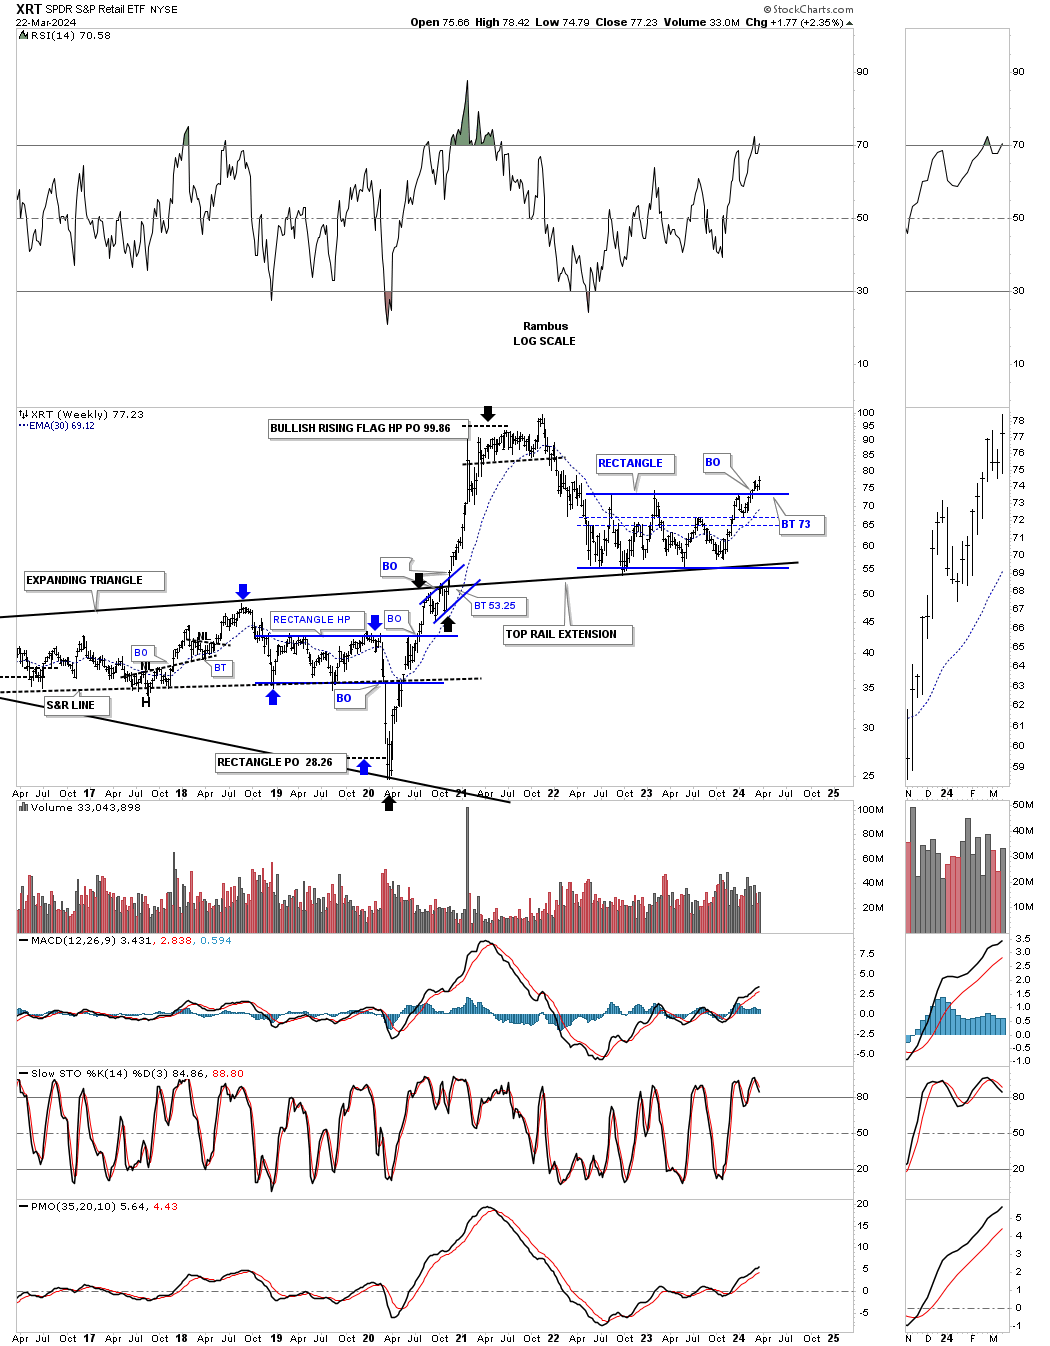
This last area I would like to show you tonight is the XRT, Retail etf, which has been lagging, but is in the process of breaking out from the two year rectangle reversal pattern. One of our best trades in the Leveraged Trade Portfolio, when we got positioned shortly after the 2020 crash low was RETL which is 3 X long the XRT. That was one heck of a ride. Note the blue bullish rising wedge which formed just below the top rail of the black expanding triangle which also shows up as a halfway pattern as shown by the black arrows.
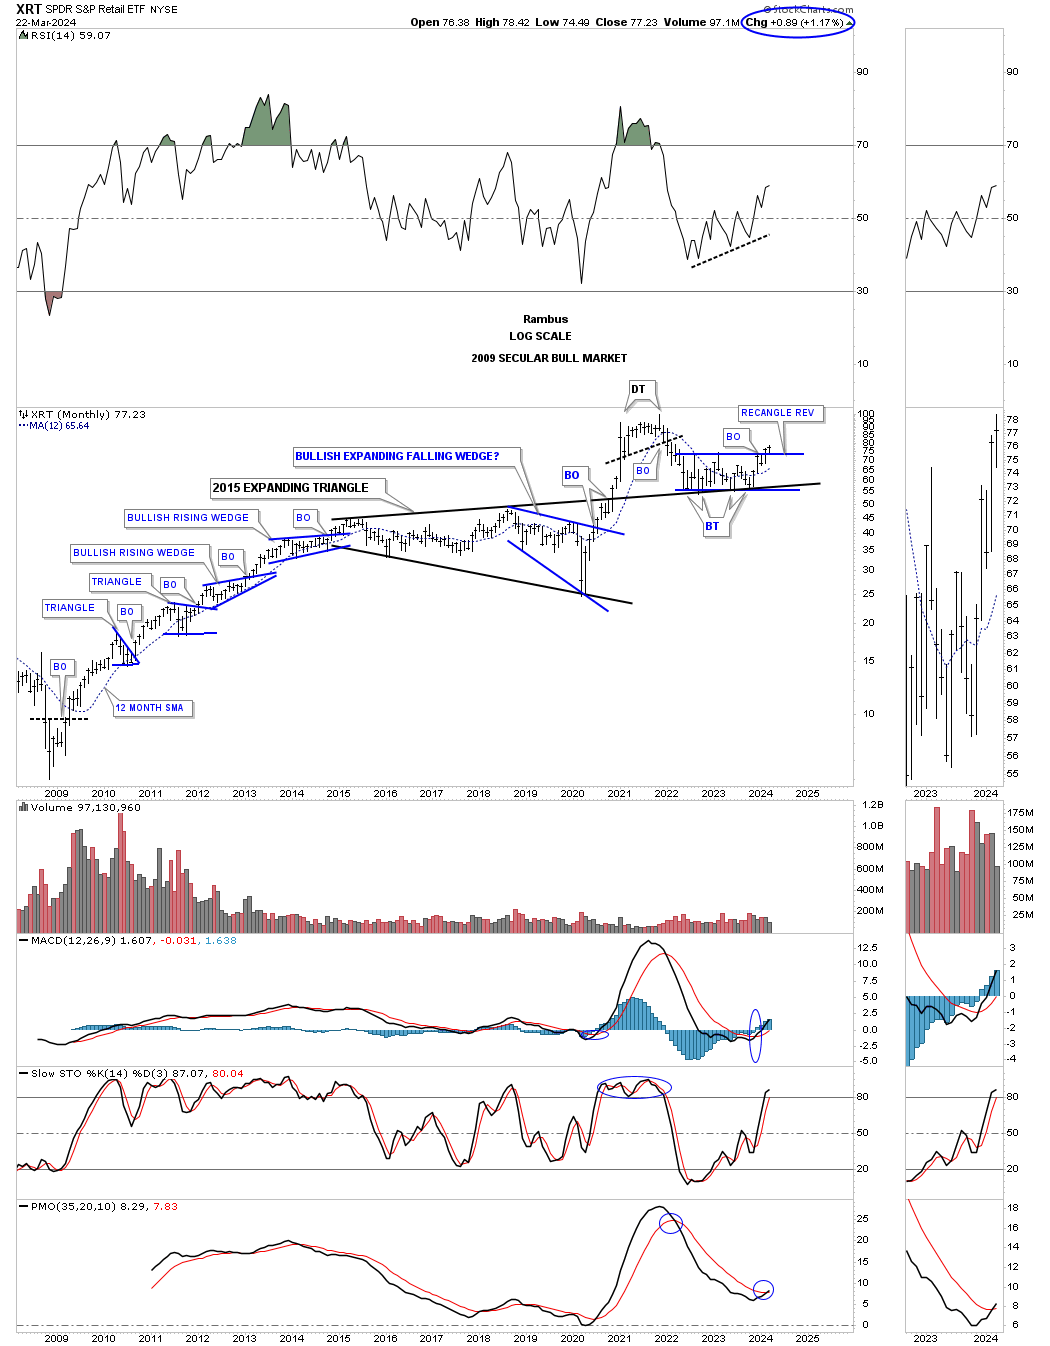
The 2009 secular bull market for the XRT.
Some of the overbought / oversold indicators that I follow have been showing overbought readings for the stock markets for the last 4 to 6 weeks or so which is quite a long time. As I mentioned at the beginning of this Weekend Report, it depends if the stock markets are in a melt up blowoff phase or just another normal impulse move in the 2009 secular bull market, I will let the price action show me what is possible. If the price action changes then I’ll change, but the last thing I want to do is screw up one of the most important bull market runs since the 1998 to 2000 secular bull market high. Have patience and stay strong. All the best…Rambus
Gold : Before And After Pictures
Tonight I would like to show you some before and after pictures for Gold we watched develop in real time. The reason I want to show you these long term chart patterns is so you know how important it is to have the big picture correct. If you have the big picture correct then you can use the shorter time frames to fine tune entry and exit points.
Also when you have the big picture correct you know that when the next important rally phase begins in a bull market it isn’t going to be over in a short period of time. This is where many investors, that don’t understand the importance of a big chart pattern, will try to trade in and out and will eventually be left behind and there is no worse feeling than being left behind in a very strong impulse move.
We are currently seeing this in the US stock markets right now. Since the October 2023 low last fall the SPX for instance hasn’t had a correction of over 3% leaving would be investors on the sidelines waiting for a bigger correction to get positioned. Maybe we will see a 10% correction before the current strong impulse move ends, but if the stock markets are in a true melt up phase those waiting for a low risk entry point will never get what they had wished for and will miss out on one of the greatest bull runs in history.
The toughest part of finding a big trading range that is still under construction is to wait for the pattern to complete. Many times in regards to a big trading range you might have to wait six months to a year or longer waiting patiently for the breakout to occur. Most investors don’t have the patience to wait that long and begin to over trade in frustration.
The beautiful part of finding a big trading range well before it completes is that you can be totally prepared for what is to come. Some of the biggest gains can come in the first few months of a strong impulse move as the price action blasts off leaving investors who were wondering, was that the bottom in disbelief, especially after a 4 1/2 year correction. It’s always easy to see the bottom in hindsight, but in real time it can be tricky, but if you have been waiting patiently for the setup you can be cool, calm and collected.
This first chart for tonight is the long term quarterly line chart we’ve been following even well before the breakout of the black expanding triangle. Look at where Gold was trading and what I suggested in the last sentence.
This is what I wrote on February 20th of this year just a few short months ago in regards to the 2020 black expanding triangle on Gold.
February 20, 2024:
With less than six weeks left of trading for the 1st quarter of 2024 Gold has tested the top rail of the black expanding triangle. A bullish sign would be to see no backtest at the end of March, but a new higher high.
Today April 7, 2024:
As you can see Gold did in fact show no backtest when the quarter ended at the end of March and shows a very strong breakout move. The reason I wasn’t expecting to see a backtest at the end of March is because from a quarterly line chart perspective they don’t show up.
Also when you look at this quarterly line chart very seldom do you see a lower monthly close. The biggest one we saw during the 2000 to the 2011 bull market was the 2008 crash low which is hardly noticeable. The impulse move out of the 2016 H&S consolidation pattern showed some nice reverse symmetry to the upside over the same area on the way down from the 2011 bull market high, blue arrows.
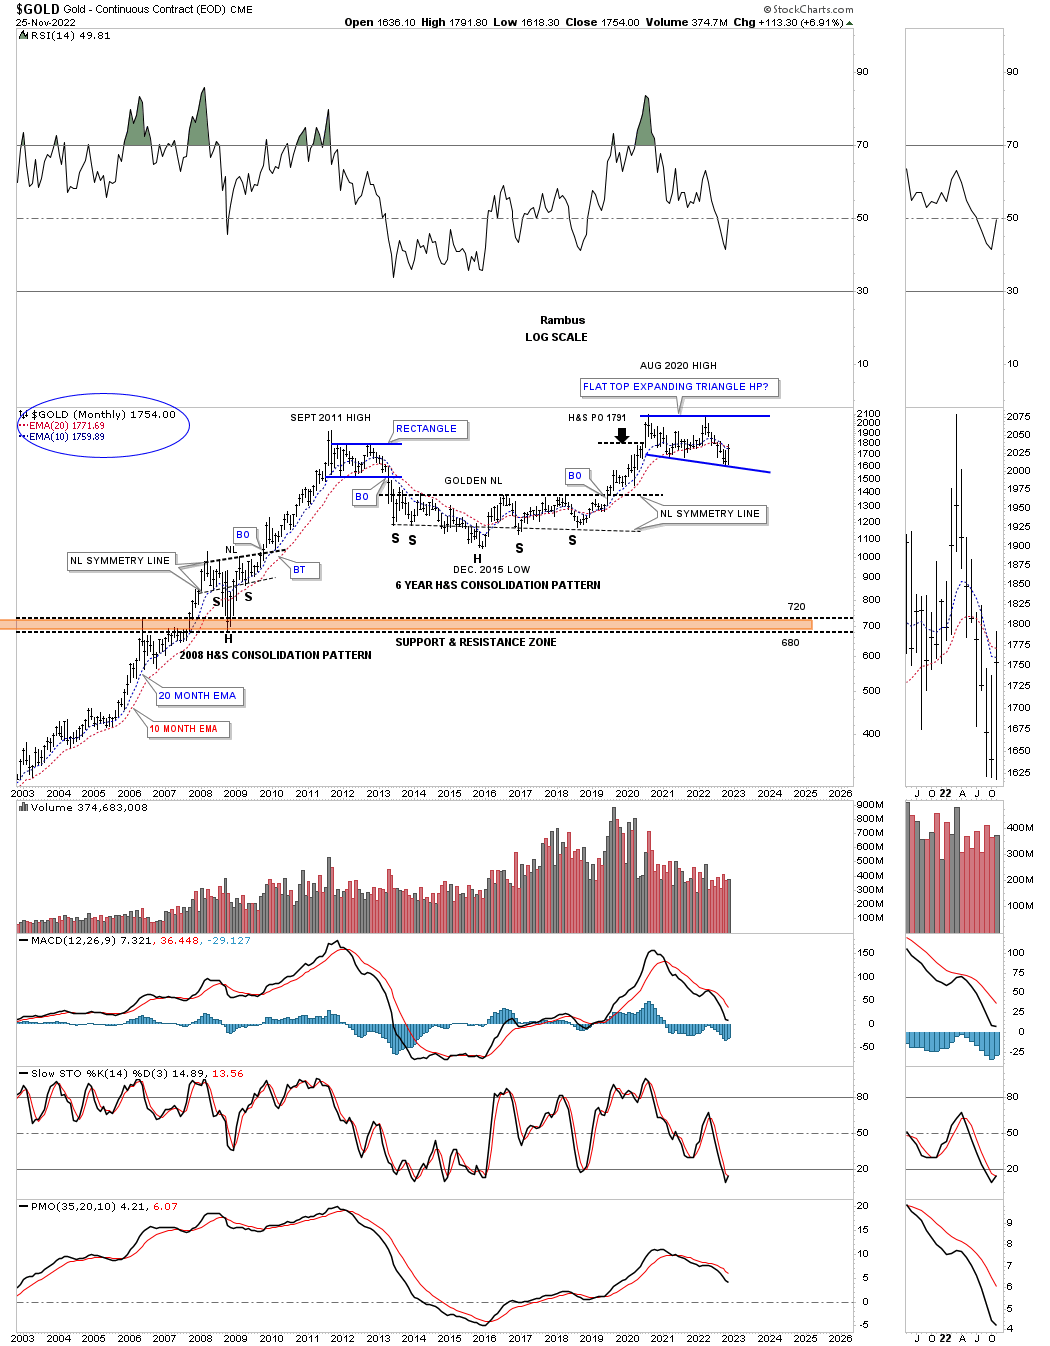
Lets now look at the 2020 trading range for Gold and what took place at the, Flat Top Expanding Triangle low or fourth reversal point. I was explaining its relative size to some of the previous consolidation patterns.
November 27, 2022:
Lets go back even further in time to see how the 2020 flat top expanding triangle looks relative to the other trading ranges before it. In 2008 Gold formed a fairly large H&S consolidation pattern that led to the blow off top in 2011. Gold then formed the blue rectangle that ended up having six reversal points before the price action broke to the downside. Again, the blue rectangle began to form below the 2011 high which is why it needed an even number of reversal points to be a consolidation pattern.
The bear market that followed the 2011 high finally came to an end with the formation of the nearly 6 year H&S consolation pattern. I’m calling it a consolation pattern because it is still forming in the 2000 secular bull market. The minimum price objective was hit, black arrow, with a little more follow through to the upside before that particular impulse move came to an end where the 2020 flat top expanding triangle began to form.
Gold still has a lot of work to do like closing a month above the 10 and 20 month ema’s for starters. Using the bottom rail of the 2020 flat top expanding triangle as a line in the sand you can see the risk to reward ratio massively favors the bulls especially if we are witnessing the last reversal point.
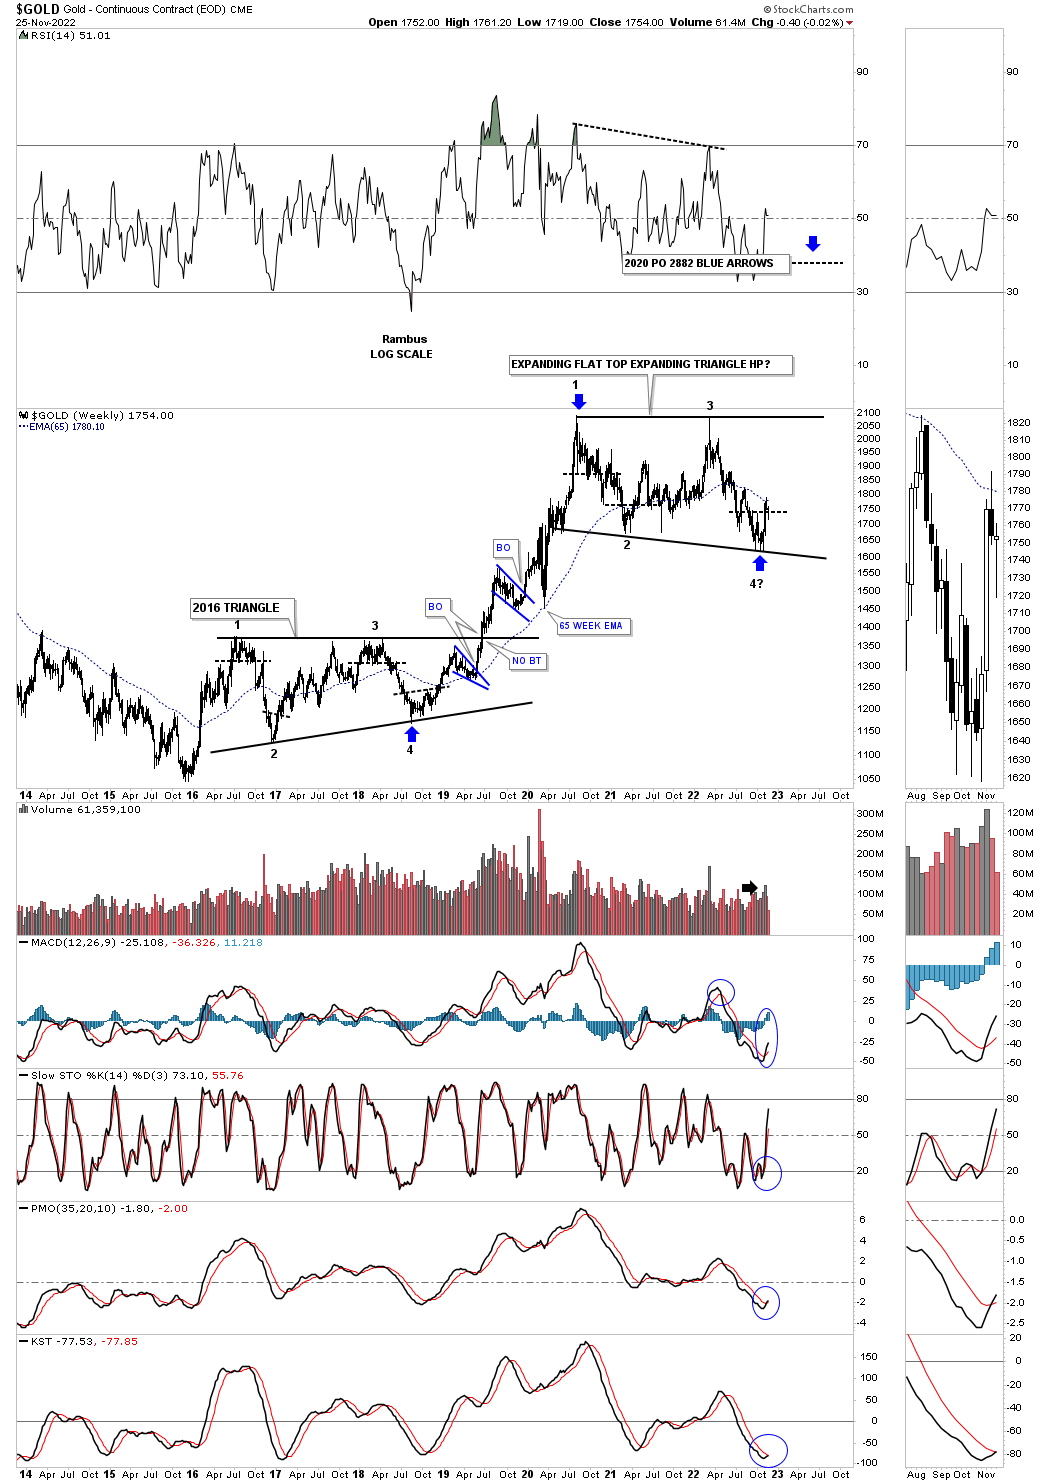
Same post: 2nd long term chart for Gold with the possible price objective as shown by the blue arrows
Looking out a little further in time you can see how the 2020 flat top expanding triangle fits into the slightly bigger picture as a possible halfway pattern. Since the 2016 triangle formed above the 2016 low it only needed four reversal points to be a valid consolidation pattern that worked out beautifully. That strong impulse move that began at the 4th reversal point formed several smaller consolidation patterns before the price action finally topped out in August of 2020 where the current flat top expanding triangle began to form. If this is the 4th reversal point the blue flat top expanding triangle will have a price objective up to the 2882 area as shown by the blue arrows.
Today April 7, 2024:
Below is the current weekly chart for Gold and shows what followed after the 4th reversal point low in the 2020 expanding flat top expanding triangle on the chart above.. The black arrows still show the minimum price objective around the 2880 area.
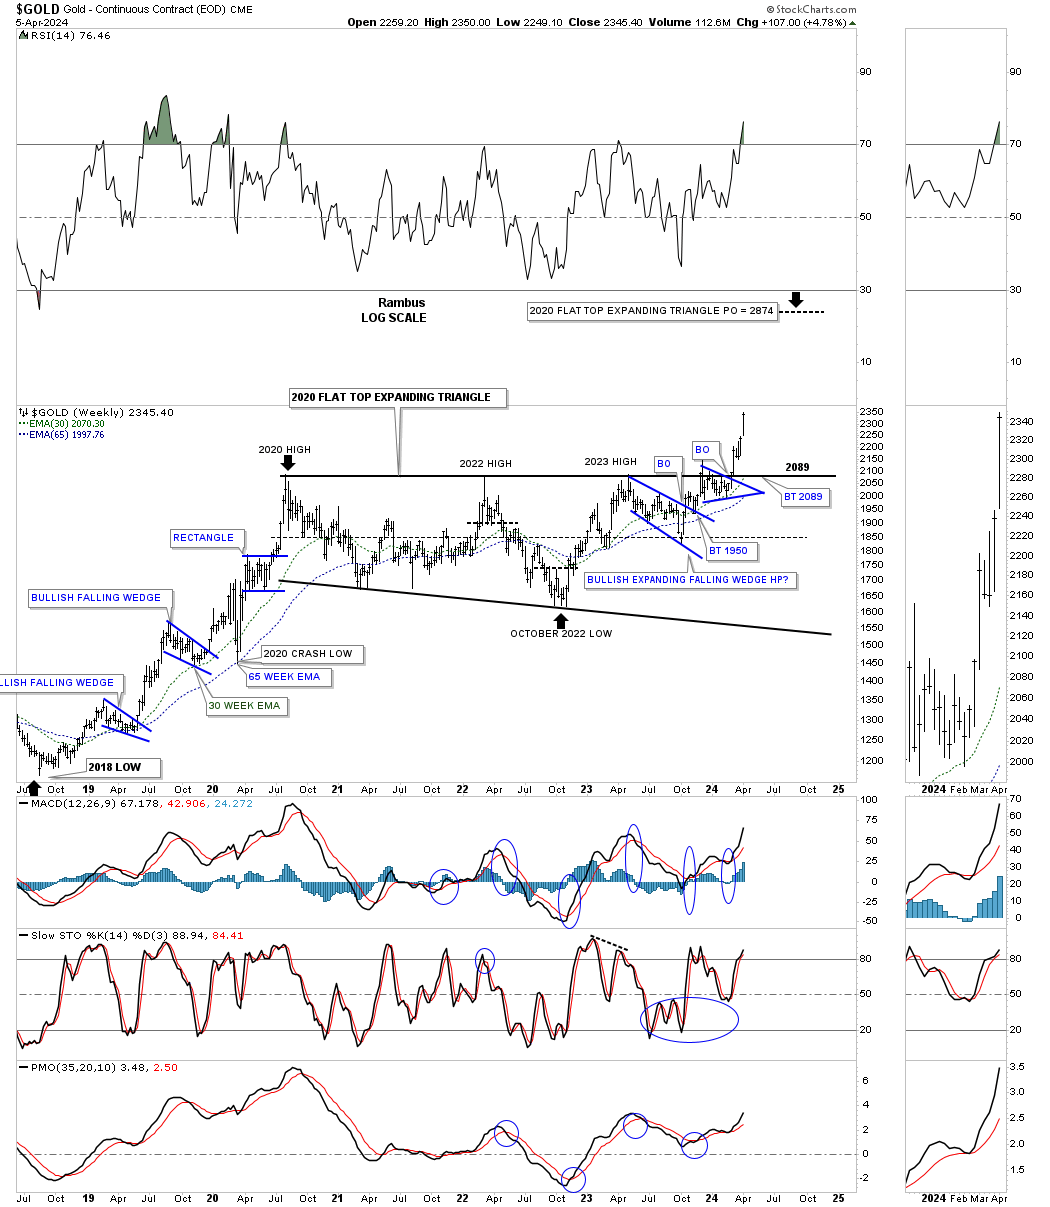
Now lets look at that massive 2016 H&S consolidation pattern that reversed the 2011 bear market and what followed.
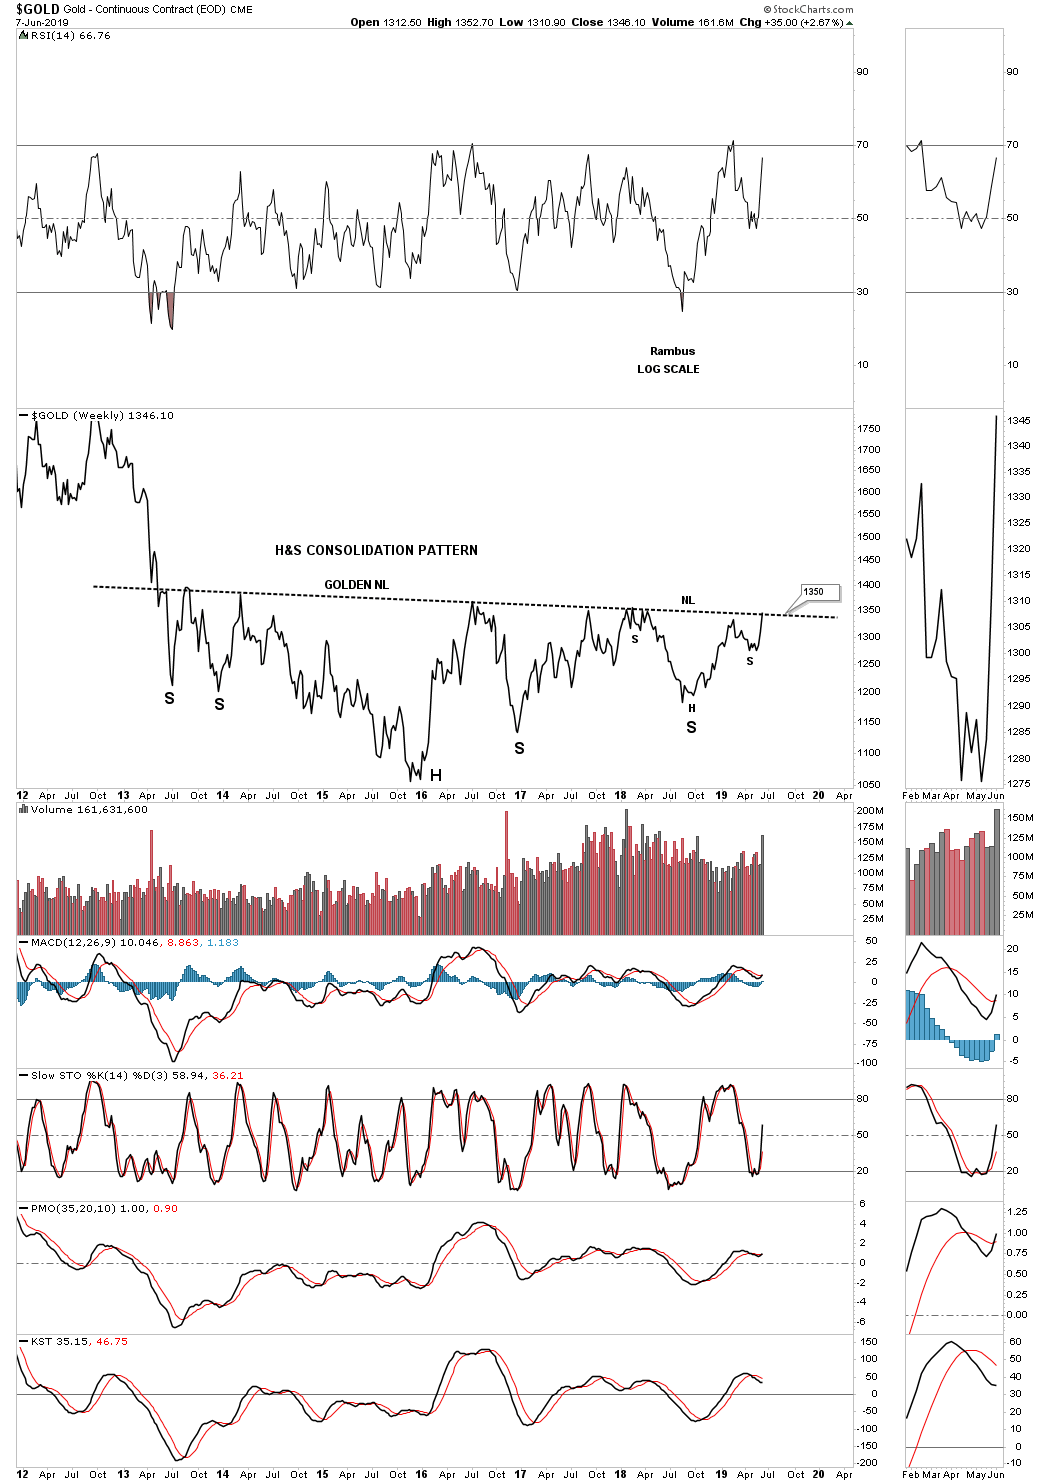
This is what I wrote on June 8, 2019 almost 5 years ago.
It’s hard to believe that the massive H&S consolidation pattern we’ve been following for several years began to develop all the way back in 2013 during the initial crash off the 2011 high. This weekly line chart shows the price action closing this week right on the neckline at 1350. Note how many touches the neckline has experienced from below with each one backing off. Now the question remains, how may bears are left to defend the 2013 neckline? There is a good chance that if they are exhausted that the price action could just spike right through the neckline this time around completing the massive H&S base which would be long term bullish. Big patterns lead to big moves.
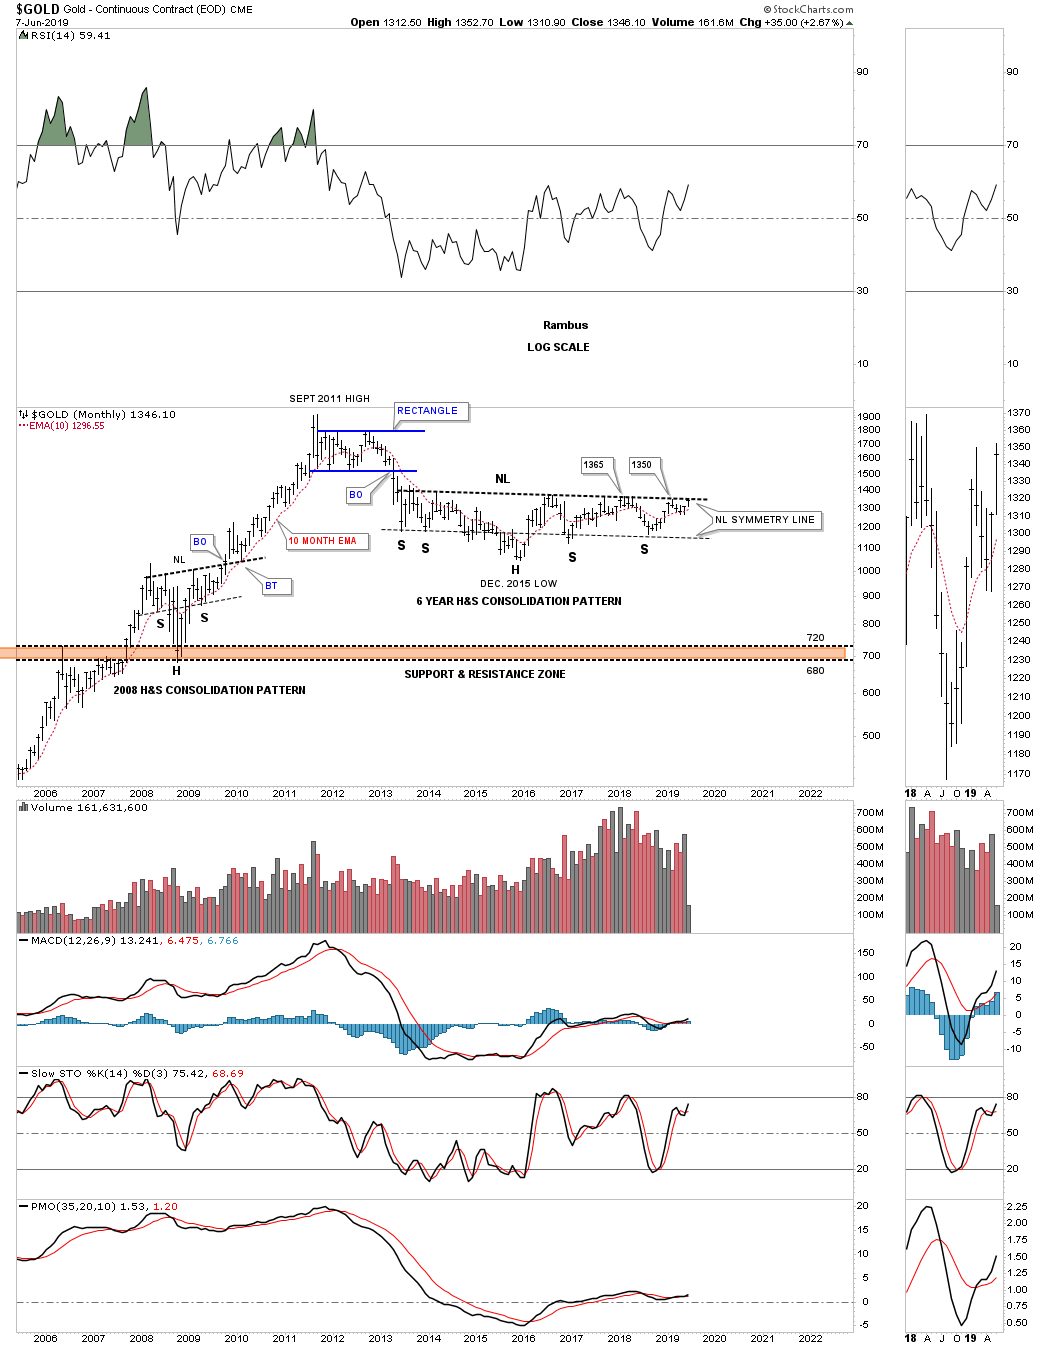
Same post longer term view.
This monthly chart shows how the H&S consolidation pattern fits into the bigger picture.
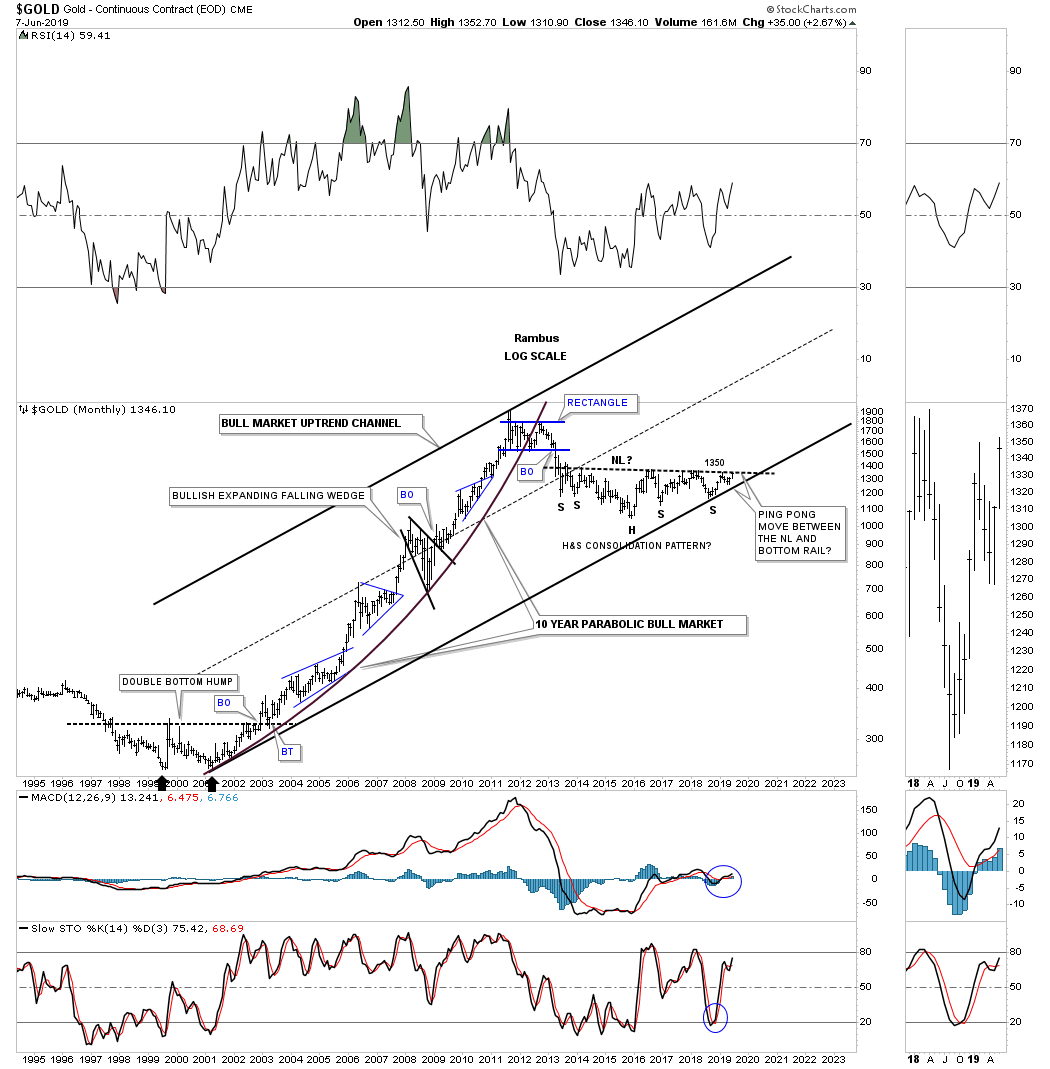
Same post 2000 secular bull market uptrend channel. Note the ping pong move I pointed out between the neckline and the bottom trendline of the 2000 secular bull market uptrend channel.
The reason I call this H&S a consolidation pattern is because of the way it fits into the major secular bull market uptrend channel.
Today April 7, 2024:
You can see that small ping pong move between the H&S neckline right shoulder and the bottom rail of the 2000 secular bull market uptrend channel and what followed.
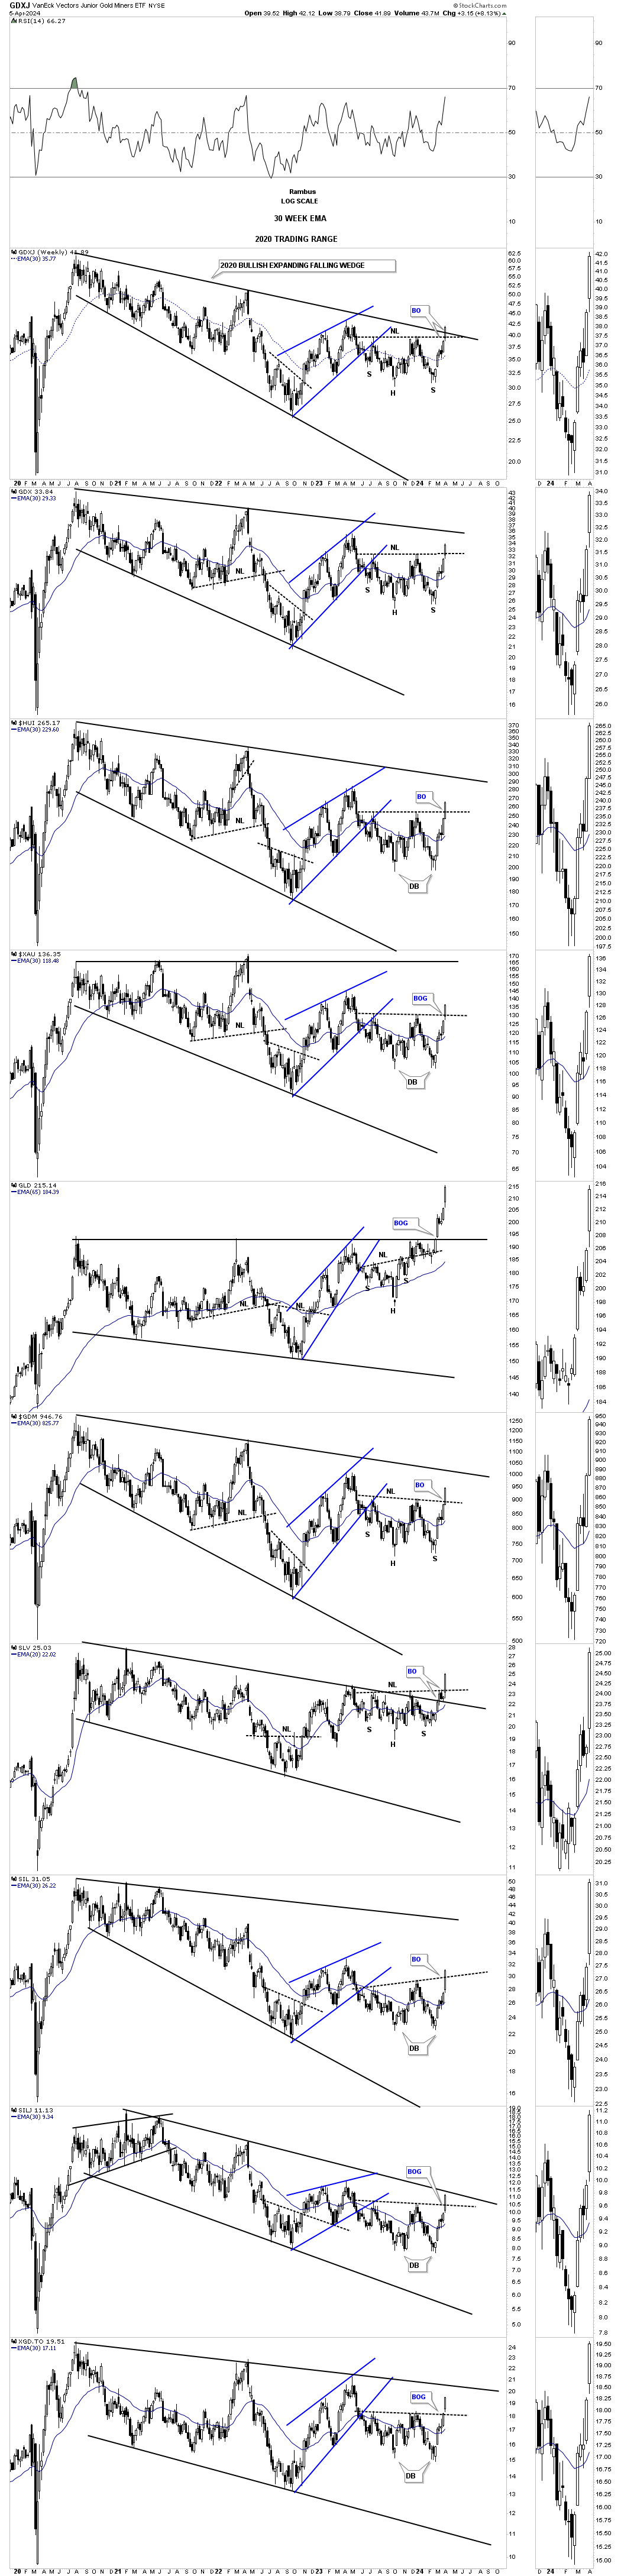
Back to the present. Below is the weekly candlestick chart for the PM complex we’ve been following for half of its existence. Since the October 2023 low the price action has built either a H&S consolidation pattern or a double bottom both of which are reversal patterns. Note several of the breakout gaps that occurred last Monday on the breakout of the neckline or double bottom trendline. Since they both have formed just below the top rail of the 2020 bullish expanding falling wedge it is strongly suggesting the top rail is going to give way. As you can see the GLD and SLV have already broken out with the GDXJ and SILJ strongly testing their top trendline.
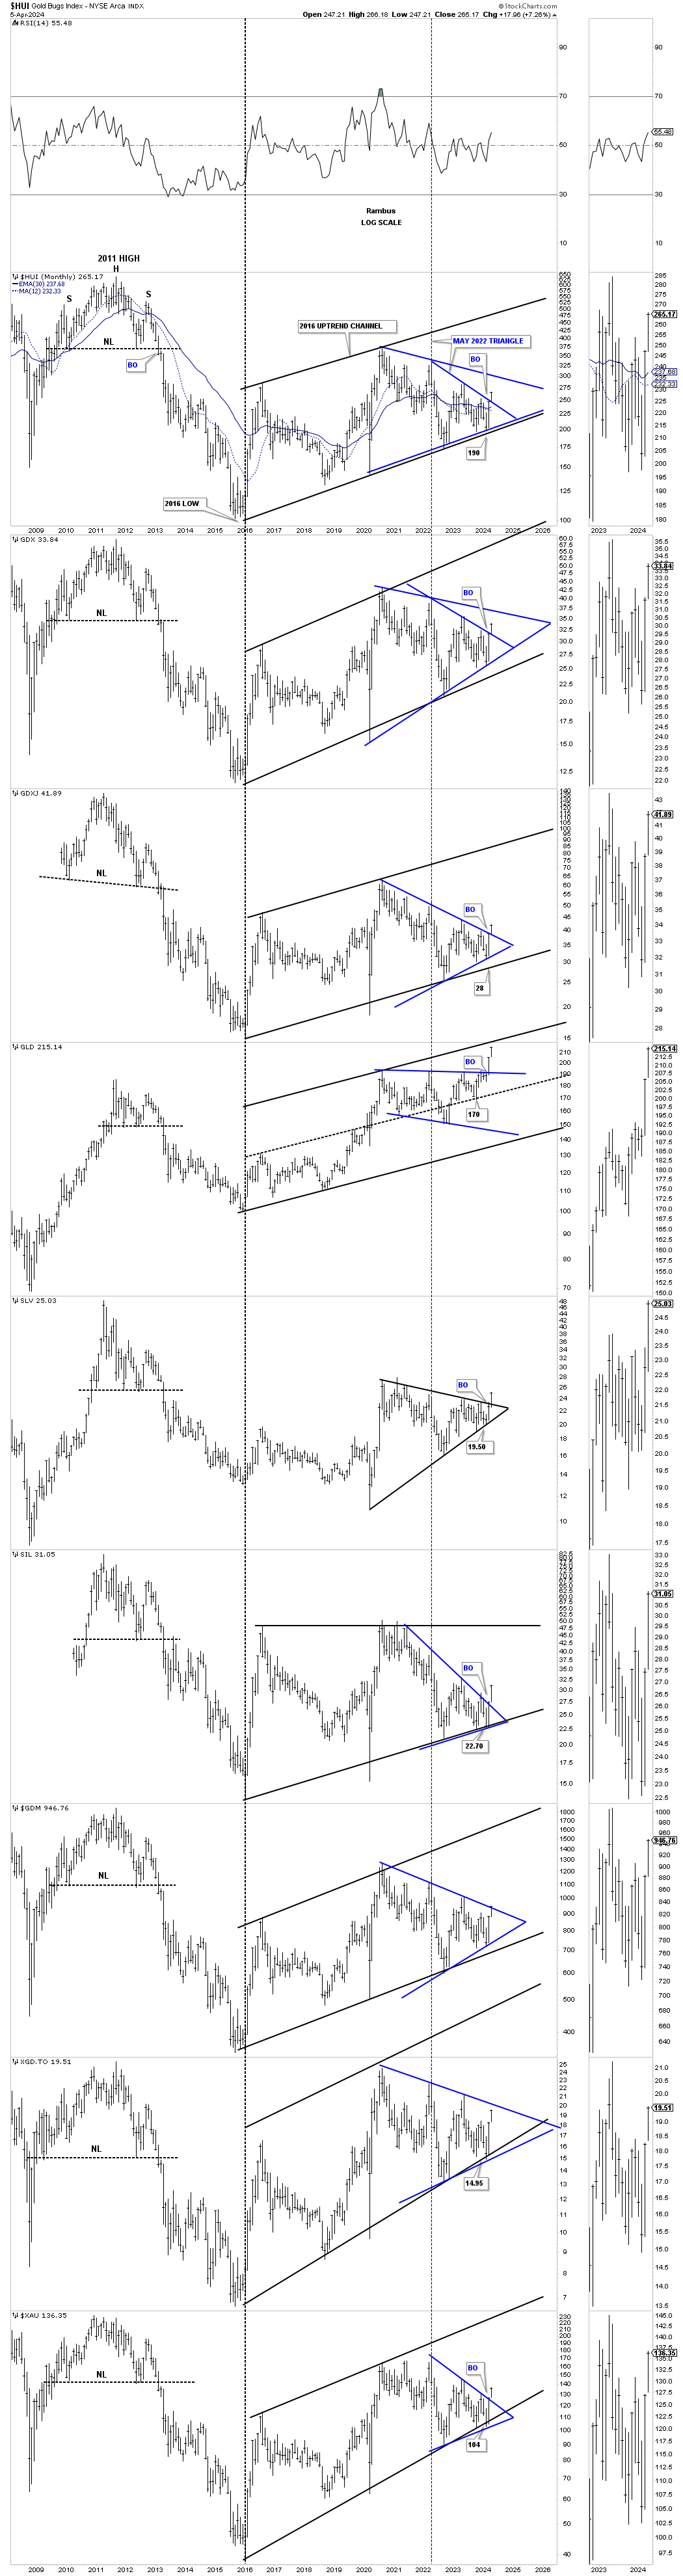
This next long term monthly chart for the PM complex goes all the way back to the very symmetrical H&S tops that formed at the end of the 2000 bull market. The black dashed 2016 vertical line divides the bear to the new bull market which I know doesn’t feel like it because of all the sideways chopping action since the 2016 low.
This combo chart focuses on the 2016 uptrend channel in most cases with the May 2022 triangle forming off the bottom trendline. In some cases the May 2022 triangle top trendline can extend back to the previous high making that trendline even more important which will be the next area of overhead resistance.
At a minimum I expect to see the top rail of the 2016 uptrend channels being hit over the next year or so that could coincide with the possible end of the melt up phase in the US stock markets may be in. If that turns out to be the case then everything including the PM complex won’t be immune to a hard sell off or bear market.
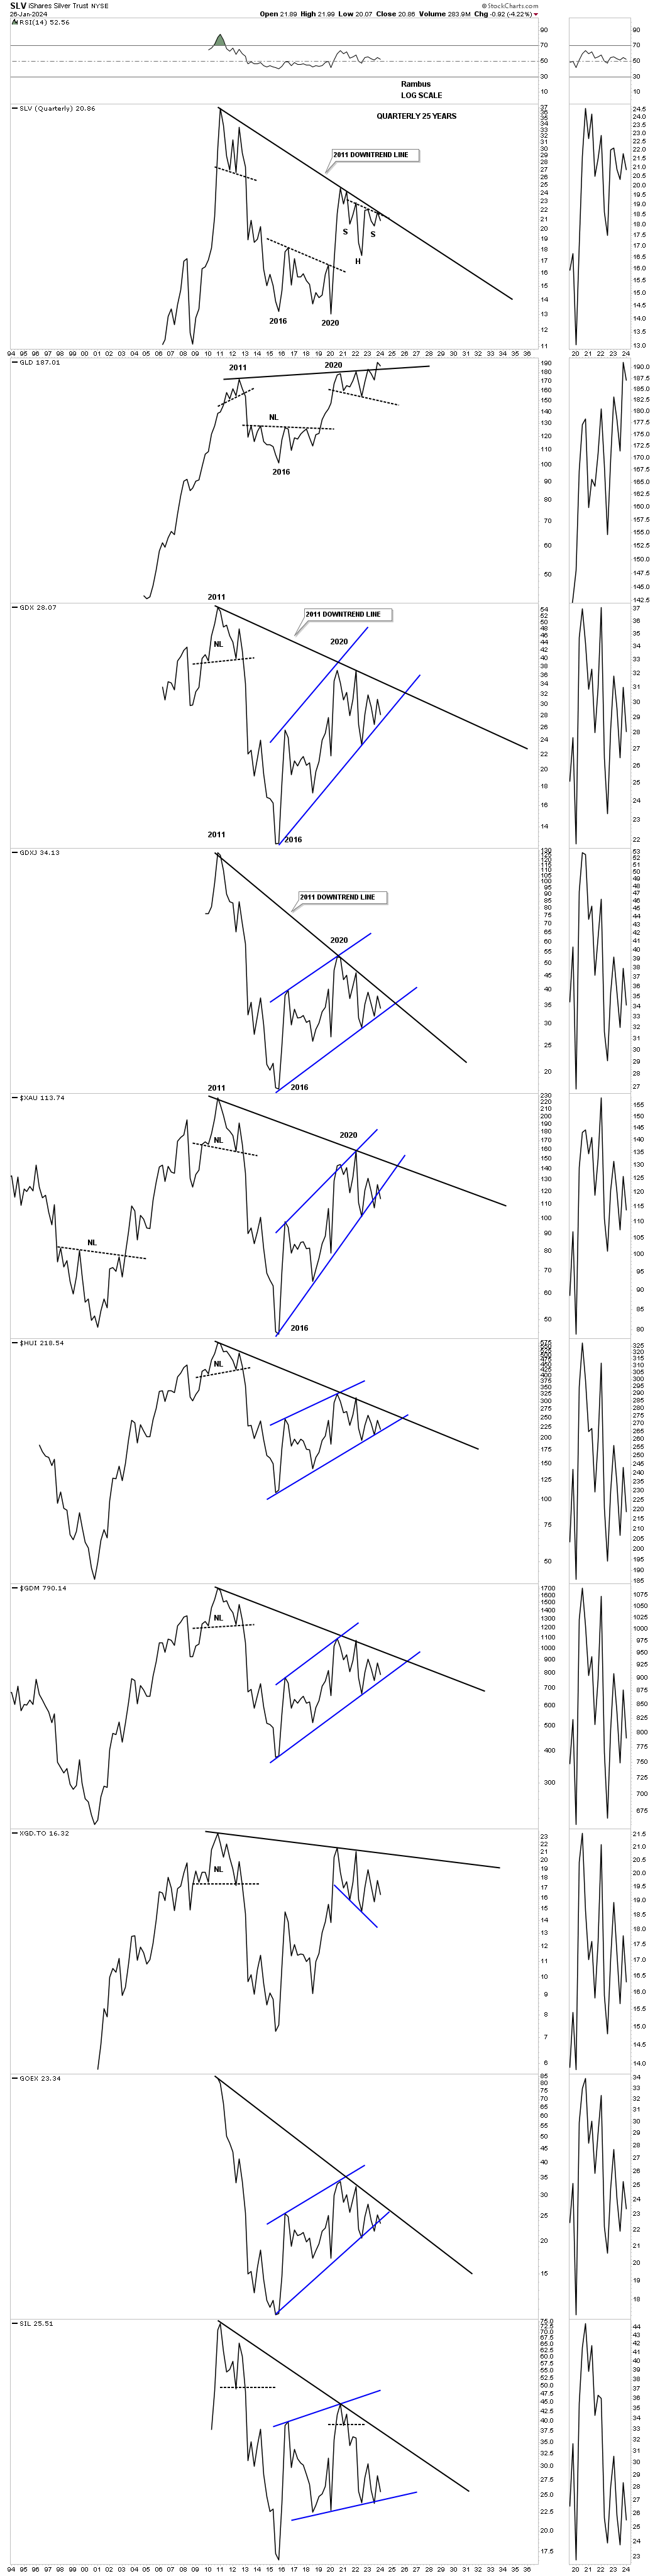
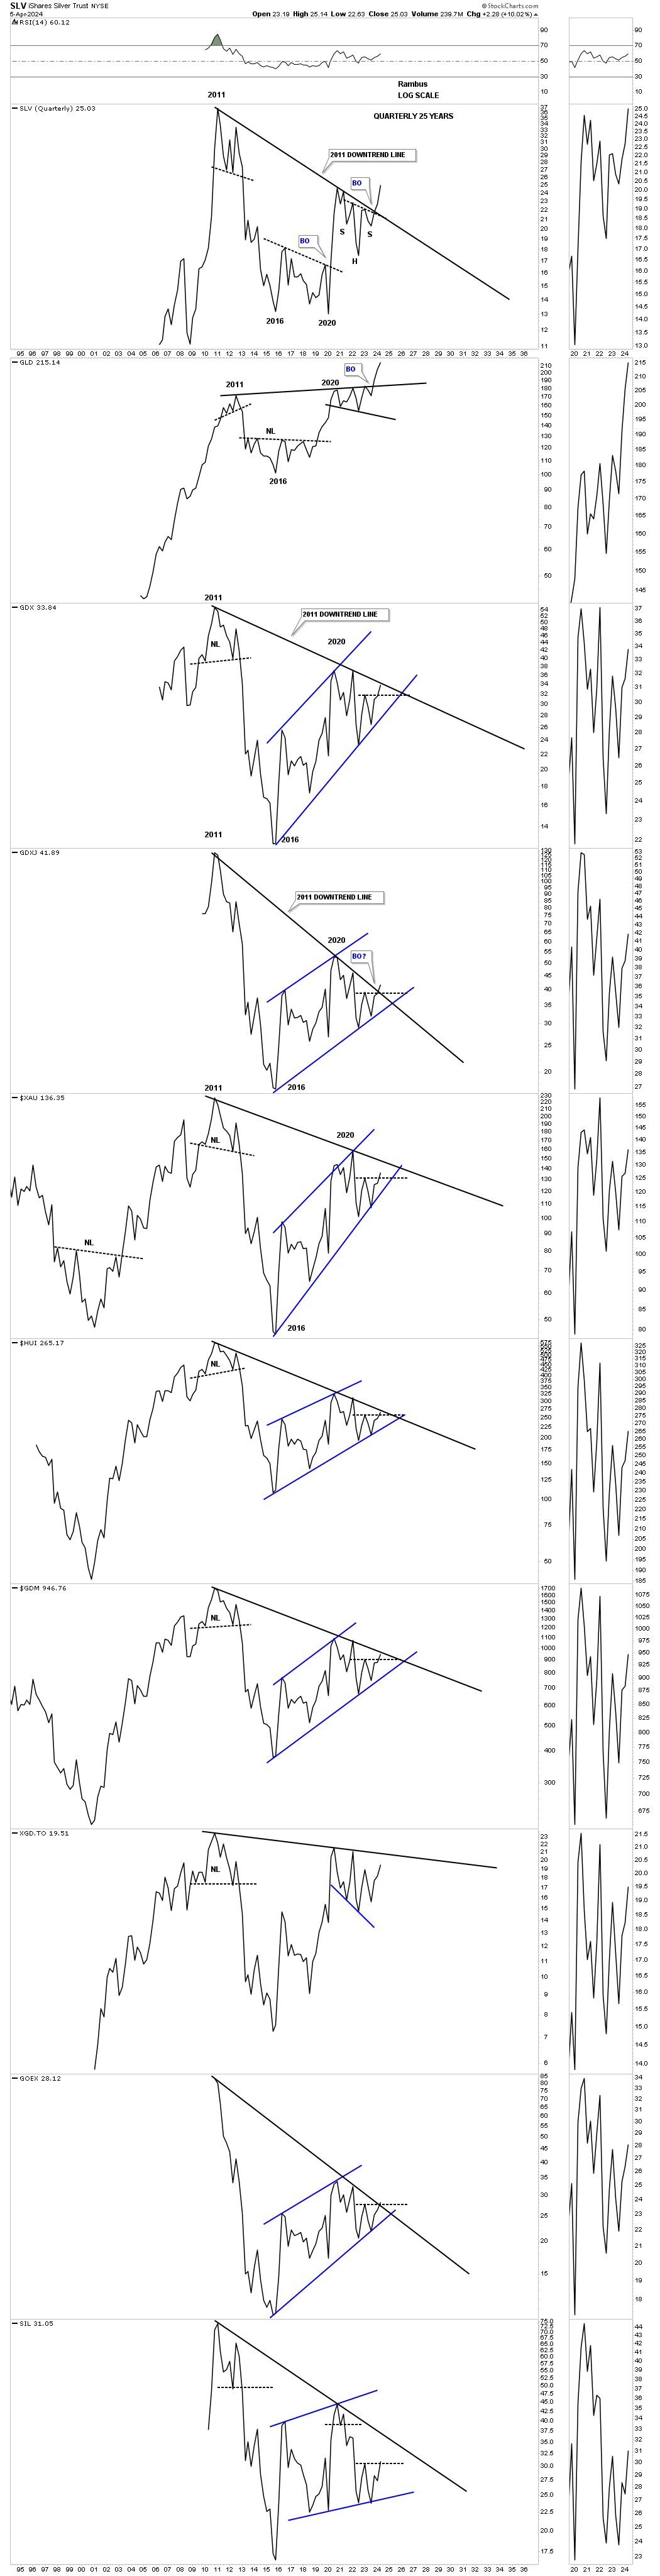
We’ll finish up by looking at the top rail of the bear market downtrend line taken form the 2011 high connecting several of the lower highs most notably the 2020 high. Please note where SLV, GLD and GDXJ were trading at the end of January of this year.
This is what I wrote on January 26, 2024:
This last chart for tonight is just a simple quarterly line chart. What this chart shows is the top trendline taken from the top in 2011 and the top made in 2020 which is slopping down showing the downtrend line which is still in play since 2011 except for Gold which has the only up slopping trendline. If the PM complex can overcome that 2011- 2020 trendline the bear market will be officially over IMHO. As you can see SLV has been testing it many times, but so far has failed to take it out. Hopefully it is just a matter of time.
The bottom line is that I’m still bullish on the PM complex, but just keeping an open mind if things don’t start improving soon. It looks like Silver could be the key to the next important direction for the PM complex. We have several different roadmaps in front of us that should help guide us and give us an important edge in staying on the right side of the PM complex.
Today April 7, 2024:
Now compare what SLV, GLD and GDXJ have done since January of this year. SLV has completed its large H&S consolidation pattern breaking the top rail of the 2011 downtrend line and the neckline in one breakout move. The backtest on GLD’s expanding triangle did in fact hold support and now the GDXJ is attempting to breakout above its 2011 downtrend line.
We are finally beginning to see that 2011 bear market downtrend line, which has been in control for 13 years, finally starting to give way. The metals are leading right now, but the PM stocks should begin to play catch up in a way we haven’t seen in a long time. Stay tuned as the, everything bubble phase, is still rocking and rolling. Have a great weekend and all the best…Rambus
Related Reading:
- Rambus: Blockbuster Chartology – January, 2024
- Rambus: Blockbuster Chartology – October, 2023
- Rambus: Blockbuster Chartology – August, 2023
- Rambus: Blockbuster Chartology – May, 2023
- Rambus: Blockbuster Chartology – January, 2023
- Rambus: Blockbuster Chartology – October, 2022
- Rambus: Blockbuster Chartology – July, 2022
- Rambus: Blockbuster Chartology – May, 2022
- Rambus: Blockbuster Chartology – February, 2022
- Rambus: Blockbuster Chartology – October, 2021
- Rambus: Blockbuster Chartology – July, 2021
- Rambus: Blockbuster Chartology – April, 2021
- Rambus: Blockbuster Chartology – January, 2021
- Rambus: Blockbuster Chartology – October, 2020
- Rambus: Blockbuster Chartology – July, 2020
- Rambus: Blockbuster Chartology – May, 2020
- Rambus: Blockbuster Chartology – January, 2020
- Rambus: Blockbuster Chartology – October, 2019
- Rambus: Blockbuster Chartology – July, 2019
- Rambus: Blockbuster Chartology – April, 2019
- Rambus: Blockbuster Chartology – January, 2019
- Rambus: Blockbuster Chartology – October, 2018
- Rambus: Blockbuster Chartology – July, 2018
- Rambus: Blockbuster Chartology – April, 2018
- 2017 Annual Wrap Up – Does Your Pension Fund Have A Deep State Drain? – January, 2018
- 1st Quarter Wrap Up 2018 Web Presentation
- Blockbuster Chartology with Rambus – October, 2017
- Blockbuster Chartology with Rambus – July, 2017
- Blockbuster Chartology with Rambus – May, 2017
- Blockbuster Chartology with Rambus – January, 2017
- Blockbuster Chartology with Rambus – October 20, 2016
- Blockbuster Chartology with Rambus – July 21, 2016
- Blockbuster Chartology with Rambus – April 21, 2016
- Rambus: Are We in a Deflationary Spiral? – January 28, 2016
- The Dollar, Gold & the S&P 500 with Rambus – October 15, 2015